Archive
The Fed’s Latest Word On Inflation
As I look with ever more confusion at the equity market, I am thankful that my expertise after all is in the bond market. Sure, the bond market is the one that is explicitly manipulated by the central bank right now, but in a way it is comforting that it is out in the open. Also, it creates great anticipation in my mind about what the Fed will do when they want to put the market somewhere and the market doesn’t want to go. That will be a fun day.
The Non-Manufacturing ISM was marginally weaker-than-expected at 57.3 versus expectations for 59.5, but it remains at a relatively high level. Of more interest were the minutes of the FOMC meeting, some snippets of which are below.
“Sizable increases in prices of crude oil and other commodities pushed up headline inflation, but measures of underlying inflation were subdued and longer-run inflation expectations remained stable.”
Well, not really. The Michigan survey’s measure of consumer expectations for inflation 5-10 years ahead jumped considerably this month, and surprisingly. Later, the minutes explicitly mentioned the survey before dismissing it:
“According to the Thomson Reuters/University of Michigan Surveys of Consumers, households’ near-term inflation expectations increased substantially in early March, likely because of the run-up in gasoline prices; longer-term inflation expectations moved up somewhat in the early March survey but were still within the range that prevailed over the preceding few years.”
As the chart below shows, this is only true because the “range” was extended on the high side in 2008 by the oil price spike and headline inflation over 5%.

Still within the range...I guess.
It seems disingenuous to say we are “still in the range” when we’re at the absolute limit of the last decade’s range with the singular exception of the inflation spike in 2008 that had policymakers pooping in their pants.
My suspicion is that the Fed is referring mostly to 5y, 5y forward inflation taken from the inflation swaps market or TIPS breakevens (see Chart below, source Enduring Investments). SOMA manager Brian Sack has written previously about 5y breakevens compared to 5y, 5y forward BEI and seems to be a fan of that measure. Certainly, the Fed focuses a great deal on it. In this case, that seems curious since the Fed is actively holding down the Treasury curve, which constrains breakevens by artificially keeping interest rates lower than they would be without a $600bln buyer.

Well, 5y5y (the green line) is still contained. Thanks to the Fed holding down longer-term Treasury yields.
But moving on, more from the minutes:
“In response to special questions, dealers reported some increase in the use of leverage over the prior six months by traditionally unlevered investors–in particular, asset managers, insurance companies, and pension funds. In addition, dealers reported an increase in leverage over the past six months by hedge funds that pursue a variety of investment strategies. More broadly, while the availability and use of dealer-intermediated leverage had increased since its post-crisis nadir in mid-2009, a review of information from a variety of sources suggested that lev-erage [sic] generally remained well below the levels reached prior to the recent financial crisis.”
It seems odd to speak nonchalantly about the increase in the use of leverage “by traditionally unlevered investors.” This would seem doubly chilling to me, even if overall leverage “generally remained well below the levels reached prior to the recent financial crisis.” First of all, I would hope that we all agree that the level of leverage reached in 2008 wasn’t just a little high, but was really way too high for a healthy financial sector. Second of all, the Fed’s worst nightmare would be if leverage surged back and brought money velocity (a related concept) back up with it. It was the crash in velocity that caused the flirtation with deflation, not the 5-10% M2 growth rate of 2008 through late 2009. We can be reasonably calm about inflation right now only because M2 has been growing relatively feebly (although back to 4.44% over the last 52 weeks). But all bets are off if velocity increases 20%. Then the Fed would need to drain aggressively to restrain inflation.
To me it seems like the Fed is missing some of the big lessons of the crisis, from an inflation-observer’s point of view. However, I was delighted to read this fairly enlightened exchange in the minutes:
“In contrast to headline inflation, core inflation and other measures of underlying inflation remained subdued, though they appeared to have bottomed out. A number of participants noted that, with significant slack in resource utilization and with longer-term inflation expectations stable, underlying inflation likely would remain subdued for some time. However, the importance of resource slack as a factor influencing inflation was debated. Some participants pointed to research indicating that measures of slack were useful in predicting inflation. Others argued that, historically, such measures were only modestly helpful in explaining large movements in inflation; one noted the 2003-04 episode in which core inflation rose rapidly over a few quarters even though there appeared to be substantial resource slack.”
Exactly the point I’ve been making for some time – if you’re relying on traditional aggregate demand/aggregate supply analysis to forecast inflation, you’re likely to be very disappointed. There is just not a lot of reason to think that these are anything more than “modestly helpful.” I am delighted that the discussion turned this way, but the point appeared to have been dropped for now.
Amazingly, there was zero discussion of the Bernanke press conferences! That was striking to me, since the decision to hold four press conferences a year is easily the biggest communications-related decision – and even more difficult to reverse than QE2 – in the last 5-10 years. I know they’ve been thinking about it for a while, but it is rather cavalier of the Committee to blithely brush past it in the meeting that immediately preceded the announcement!
None of this had any market impact of note. As I write this (at 3:30ET since I have an engagement in the city later), stocks are unchanged and while bonds are down on the day they didn’t react appreciably to anything in the minutes.
There is nothing on the economic calendar for Wednesday, so presumably we can expect another slow trading session. However, I want to share one more picture with you, and that’s the seasonal chart of bond yields over the last thirty years:

Average deviation of 10-year yields from the annual average, last 30 years.
The basic shape of this picture hasn’t changed for as long as I have been in the business. From April into early summer, yields tend to rise (about 70% of the time from early April over the next 60 days); they irregularly rally in the summer but with no tradeable consistency, and then starting in September with great regularity rates fall fairly sharply. In the context of this chart, we should be wary about the recent back-up in yields – although yields are in the middle of recent ranges, and although the seasonal pattern here is not automatic, it does suggest that there is a better chance of a break higher in yields than of a break lower in yields over the next month or two.
Disciplined or Delusional?
If you feel as if this comment has become a little less regular over recent days, it is because it has. Partly, that is because business has been increasingly busy. Institutions are increasingly interested in exploring inflation-related exposures that they may have and developing ways (process-related or investment-related) to mitigate those risks. Investment managers who don’t currently have a product offering are interested in developing something or potentially subcontracting out the product management. And individuals of course are always trolling for strategies that provide inflation protection, offer a superior rate of return, are highly liquid, and can be implemented easily and inexpensively. In other words, business is improving for inflation experts, and today’s upward surprise in the Eurozone CPI estimate doesn’t hurt either. That’s good news (well, for me).
But that isn’t the only reason the comment has become more sporadic. I freely admit to being somewhat befuddled by the market’s behavior. Yes, of course markets can deviate for long periods of time from fair value or rational behavior. In those times, a disciplined approach is incredibly difficult but will produce the best long-term results. Well, my discipline hasn’t changed much in the last fifteen years, which is why I have been underweight equities – and at times, completely out – since the end of 1998. There is always the chance that the market has passed me by, and that the “new ordinary” multiples are sustainable. If that is the case, I will miss the run-up of the S&P from 1300 to 10,000 in the same way I have largely missed the run-up from 10,500 or so (I still hold some defensive stocks, but am only about 15% in equities overall).
Missing run-ups doesn’t bother me very much at all. I have great confidence in the discipline that has produced excellent long-run returns. It really is the character of the run-up that is disturbing. Since the local bottom on March 16th, the S&P has rallied in 10 of 13 sessions. The 10y note contract fell for nine consecutive sessions from March 16th through March 29th, and 11 of 13 overall. Those are remarkable numbers especially when you consider that really, nothing has changed except the regime in Portugal. The economic data hasn’t been getting rosier; in fact, it has been surprising less on the upside than it had been (see Chart below).
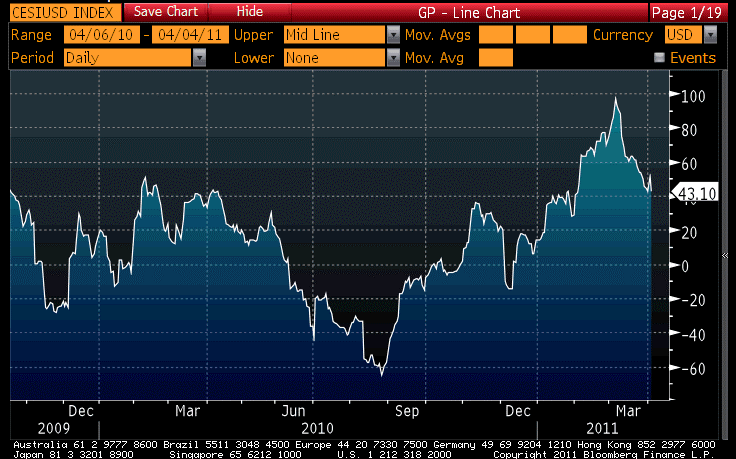
The Citi Economic Surprise index. Lower numbers mean fewer upside and more downside surprises.
This rally in stocks/selloff in bonds has occurred on decreasing volume (quarter-end aside), with today’s session the slowest of the year on the NYSE, which should be a concern but so far hasn’t been. To me it feels more like investors who know they shouldn’t be buying, but are ‘throwing in the towel,’ but that might be just my ego trying to make me feel better. But the optimists (some might say the Pollyannas) are winning. By the way, good for them if they can also turn the economic tables – pushing the market higher doesn’t really change anything except the price I have to pay.
I look askance at several things that should be worrying us more. The continuing debacle in Japan seems to have temporarily receded to the back pages, but that may change once post-earthquake economic data begins to be released. Last month, predictably, vehicle sales plunged some -37% year-on-year, the worst performance ever. Machine Tool Orders are due out tonight. We still have another week or two before numbers such as Bankruptcies and the “Economy Watchers Survey” (April 8), Bank Lending (April 11), Consumer Confidence (April 19), Trade figures (April 24) and the Employment report (April 27) are released. I’m not a Japanese scholar so I can’t tell you which of these are market-moving data, but I can tell you that until now we have seen almost no post-earthquake data. The economic news is likely to be pretty grim, and I wonder if it will make investors sit up and take notice. Probably not.
Energy prices are not following the usual pattern we see in markets after a spike. Since front Crude rallied to and surpassed the $100/bbl mark in late February, the market hasn’t ebbed. Instead, it is crawling slowly higher ($108 today). See the Chart below. I can’t tell you what this means on a daily chart, but I can tell you that when the bond market spikes intraday on a payrolls day, it usually settles and trades sideways and often gives back some of the gain. However, on occasion it ‘extends the range’ later in the day, and when you see that – and it looks much like this daily chart – it is a clear buying signal because you often get a melt-up from the folks who had sold into the first spike. Again, I’m not sure if this translates to the dailies.

Front Crude is not fading from the spike, but extending the range higher.
Already, slow wage growth combined with quickening price increases on non-discretionary food and energy purchases is pressuring discretionary spending. There is enough good news right now that consumers seem to be opening up a little more, but this isn’t a trend that is sustainable long-term.
So how do you write a daily comment if none of the daily occurrences seem to have anything except long-term consequences? Let me assure you, it is a struggle. All I can say is “trust me, it will matter. But probably not today,” and that’s not particularly helpful to the typical fast-twitch investor. To them, I apologize.
But for those readers who are striving like me to be disciplined investors, we must remember that paths which seem easy are probably false, and that investment success isn’t a place but a process. “Before enlightenment, chop wood and carry water. After enlightenment, chop wood and carry water.”
.
Tomorrow, while the non-manufacturing ISM (Consensus: 59.5 from 59.7) is released at 10ET, the important item is the 2:00ET release of the FOMC minutes from the March meeting. Be very careful of the headlines, which will almost certainly be taken out of context. There is no doubt that the FOMC discussed the improving data, and no doubt that they considered whether to stop the QE program early. The early headlines will be taken from these sensational points, but it is the context that matters. Frankly, I am more interested in the reasoning given to the really bad decision to let Bernanke hold a press conference after four FOMC meetings per year. As long as it is “to enhance the overall goal of making communications more transparent,” then it is misguided but shouldn’t have any direct market implications. But beware if there is anything suggesting that the bully pulpit is specifically considered to be useful for guiding the market to recognize policy changes and to understand the Fed’s exit strategy as it develops. I don’t think they are seriously considering an exit strategy, but rather trying to convince the market that they are doing so…but if the market gets a whiff from the official communications, rather than from one-off cowboy comments by the likes of Kocherlakota and Hoenig, that the Fed is thinking about how quickly they can drain the bathtub, then both stocks and bonds are likely to get hurt.
Fed buying or not, I am getting increasingly bearish on fixed-income although bonds are still in a holding pattern for now. I’d start to get more actively bearish if 10-year yields rise above 3.60%.
