Summary of My Post-CPI Tweets (September 2018)
Below is a summary of my post-CPI tweets. You can (and should!) follow me @inflation_guyPV and get this in real time, by going to PremoSocial. Or, sign up for email updates to my occasional articles here. Investors with interests in this area be sure to stop by Enduring Investments or Enduring Intellectual Properties. Plus…buy my book about money and inflation. The title of the book is What’s Wrong with Money? The Biggest Bubble of All; order from Amazon here.
- Half hour to CPI. Early thoughts:
- This is one of those months where, because they have different survey respondents, the consensus core CPI index number does not match up with the consensus core y/y number.
- the index number implies 0.19% m/m rise in core. But we are rolling off 0.21% or so, and only barely ticked to a rounded 2.4% core CPI last month. Ergo, if we get that index number we’ll see a rounded 2.3% on core.
- BUT the consensus core y/y is (according to Bloomberg) 2.4%. These can’t both be true except for different survey populations.
- The weak PPI doesn’t really concern me. The components we care about, mainly health care, were not particularly weak. PPI is one of those numbers that’s all over the place. I showed this chart yesterday. Not a lot of signal through the noise.

- But since we’re fighting over the Maginot line of 0.2%, it could well make a difference and cause a “surprise” downtick to 2.3% on core CPI this month. I think that is the whisper consensus, is an 0.1% or low 0.2% and a core number that drops slightly.
- That would be another excuse for an equity rally although not sure whether bond guys would buy it.
- If there’s an UPSIDE surprise, likely will come from core goods. Got all the way to flat last month, first time in a dog’s age. And this with the dollar generally strong.
- Some are concerned about the jump in housing last mo, but that jump merely reversed the prior drop. Don’t expect re-deceleration. Home prices remain sturdy, and wage increases are starting to provide better support to household formation and therefore, housing demand.
- As usual keep an eye on cars as an element of core goods. Last month the y/y rose to 0.84%, finally starting to reflect some of the strength of private surveys. Will it continue?
- Pharma is also in core goods, and it dropped precipitously last month & probably will bounce. But it has been weakening generally for a while now. Even if that trend is valid, it got ahead of itself I think.
- So, there ARE some upside risks too. Trying to see through all of that, I will be looking at core-ex-housing, which got to 1.5% last month – hasn’t been a lot higher than that in a long time.
- But the real bottom line is this: inflation is accelerating globally and we’re seeing lots of signs of that. Core might tick down on a y/y basis today – if it doesn’t, that’s pretty bullish. But it’s going to be going higher.
- That’s all for now…more in about 22 minutes!
- Ouch! Soft number. 0.1% m/m on core, 2.2% on y/y.
- 08% m/m on core.

- 19% on core y/y. Wasn’t even a round-down. Waiting on components.
- I gotta say, the slow-rolling of the components is starting to get ridiculous. It used to be they came out at 8:30 like everything else. It’s 8:35 and the BLS still hasn’t posted the files. Which means Bloomberg also doesn’t have them.
- Well, they still don’t have all the data on Bloomberg but I’m pulling the BLS figures. There was a sharp drop in Apparel, -1.6% m/m, which makes little sense in a world of tariffs.
- The big effect was a large decline in owners’ equivalent rent to 3.33% from 3.39%, which is questionable. Primary rents down slightly.
- Also decelerations in doctors’ services and hospital services, to 0.31% from 0.64% and to 4.17% from 4.59%, respectively. Pharma didn’t bounce; it fell further to 0.77% from 0.92%.
- Consequence of OER, doctors/hospital services is that core services inflation dropped from 3.1% to 3.0% y/y. Core goods, thanks to Apparel, fell to -0.2% from 0.0%.
- Core goods declined even though Used Cars rose to 1.25% y/y vs 0.84% last month. Well, that’s something.
- Boys’ apparel y/y went to -3.43% from +4.11%. All apparel decelerated (not boys & girls or men’s footwear, but everything else), but boys’ fell the most. That’s likely a seasonal effect due to placement of Labor Day and hence start of school.
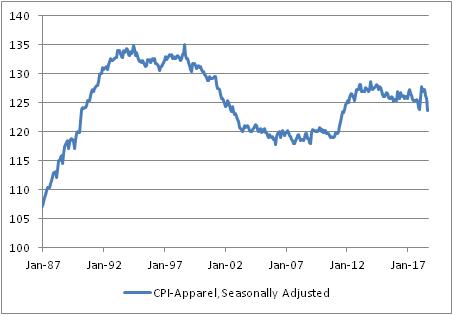
- Yeah, so here’s apparel. Evidently plunging! As a reminder we import virtually all apparel. Looking at this it’s less obviously “transitory”, but also not obvious what’s going on. With trade wars it’s simply the wrong direction.
- Core ex-housing decelerated to 1.34% vs 1.50% last month. Not a huge move, actually, and tells you how much of this was the deceleration in OER.
- In the grand scheme of things, OER is just hugging the model. I don’t see any reason to expect it to suddenly drop but leveling off was in the cards.

- I mentioned the rise in used cars. New cars didn’t do much, 0.30% from 0.23%.
- Here’s the drop in professional services (doctors). No trade effect here.

- Tuition and fees is starting to re-accelerate…2.77% vs 2.15% y/y
- FWIW, Median will be soft too but not THAT soft. 0.14%-0.17% depending on where OER-South Urban falls on a seasonally-adjusted basis.
- I’m a little torn on what to think of this report. Obviously some parts are just nonsense, like the apparel bit. The OER was large for one month but not wholly unexpected. Medical Care continues to be a conundrum. Autos are finally doing what they’re supposed to do.
- I guess my gut feeling is that aside from apparel, this is a fairly normal report and shouldn’t really change your opinion one way or the other. The 0.2% drop in the rounded core CPI was big, but it was a tougher comp.
- Annualized 3-month core CPI is at 2% – kinda where it has been.

- Let’s look at the four-pieces charts and see if that sways me. Food & Energy:

- Piece 2, core goods. I don’t think this setback is serious. A lot of it is apparel and, outside of apparel, this is doing well. Pharmaceuticals are a little weak. But cars are strong. I suspect this reverses next month.

- Piece 3, core services less shelter. Again, a little dip here on softness in medical care services, but nothing alarming to the bullish case yet.

- Piece 4, rent of shelter. Down this month, and clearly flattening out, but that’s what we expected.

- In sum, I think those pictures say that this was a widespread, but fairly shallow dip. It was a tough comp versus year ago. The left tail is getting heavy again, but the median isn’t moving much.

- weight above 3%

- Next month, the m/m dropping off is only 0.13%, so core will pop back up again especially if any of these factors reverse. Could easily get back to 2.4% although 2.3% should be the expectation. Month after that the comp is 0.21%, and then 0.12%, and then it gets tougher.
- So this month was the lowest m/m core in a long time, but no sign of any sea change – unless Apparel is telling us that trade wars lower prices for consumers, in which case let’s do more of that!
- It is somewhat soothing after signs last month that the trend was not only rising (higher inflation) but accelerating (rising at an increasing rate) past the prior trend.
- But the signs from wages (which admittedly lag), the UIG, and the underlying components is that we’re not out of the woods yet. But have a relaxed month chasing stocks higher on more-dovish fed talk! This also fits into the positive bond market seasonal from Sept-Nov.
- That’s all for today. Thanks for tuning in.
To bottom-line it: this was a soft number with some one-offs but, with the exception of the Apparel miss – and that’s just highly unlikely to be real – it seems to be broad and slightly soft, rather than narrower with things that look like potential changes in macro trends. Housing does not look poised to collapse while unemployment and wages are pointing in the right direction, and medical care isn’t going to (probably) move into outright deflation. It’s already the slowest in a couple of generations (see chart, source Bloomberg).
 I think this number will make the Fed feel better, and make investors feel better, and people who don’t take the time to peel the onion might think that the Fed has won, can stop tightening, and we can just expand the economy without price pressures or any price implications from trade. That’s almost certainly wrong, but this is a good number for the market and I totally expect talking Fed heads to be sounding even more dovish than they were.
Mike, the decline in apparel is due to devaluation of yuan to a greater degree than the impact, so far, of tariffs. In other words, currency manipulation.
kinda weird for a 6-month trend to be reflected all in a single month, though, don’t you think? And where was the acceleration in apparel in 2017 when the CNY rose by as much as it fell this year? And only 1/3 of apparel imports come from China. I agree this is part of the story. I just don’t want to oversimplify. I think this is mostly noise. We will see!
While I’m no conspiracy theorist, after all people cannot keep secrets, does the fact that the number is soft into the beginning of increased trade tensions and tariffs smell a little fishy?
Ha – I definitely agree it sounds fishy! However, the bureaucrats at the BLS are lifers. And I doubt they all share one political persuasion. The apparel thing is quite strange, though.