Summary of My Post-CPI Tweets (March 2019)
Below is a summary of my post-CPI tweets. You can (and should!) follow me @inflation_guy. Or, sign up for email updates to my occasional articles here. Investors with interests in this area be sure to stop by Enduring Investments or Enduring Intellectual Properties. Plus…buy my book about money and inflation. The title of the book is What’s Wrong with Money? The Biggest Bubble of All; order from Amazon here.
- About 6 minutes to CPI. Consensus calls for 0.2% on core. The last few have been 0.20, 0.23, 0.18, and 0.24.
- y/y core should stay at 2.2% after rounding – We are dropping off 0.174% and it would take a really weak figure to push y/y lower and a really strong one to make it round to 2.3%.
- Last month, one of the big drivers was primary rents. Pundits saw last month’s CPI as very strong; I thought it was only slightly above expectations.
- It’s surprising to see the forecasts at 0.2% on core, actually, given the narratives about how strong that inflation figure was, and how it came from Rents that many forecasters are bearish on. I thought we’d see 0.1% forecasts.
- So we’ll watch primary rents of course, but I still think the trend in core goods is an interesting one to watch. Last month y/y core goods reached the highest level since 2013. Just barely out of deflation, but with the trade situation that’s where we want to watch.
- So, here we go. Good luck all.
- Yep, there we go. Core CPI only 0.11%, making the y/y 2.08%. Just when pundits were finally thinking inflation could be a “problem,” and stopped forecasting weakness…we get weakness!
- Last 12. You can see why people were worrying if you cover the last bar. But the uptrend was not as big as it looked. And we’re really just bumping along in the 2.1-2.3% zone on core.


- There are some interesting crosscurrents in this number. Remember how I said Rents were strong last month? They were again this month. Y/Y Primary rents rose to 3.51% from 3.43%; OER went to 3.32% from 3.21%. Lodging Away from Home another jump.
-
These guys are gonna take all the fun out of live analysis. 🙂 https://t.co/P5Sd3M0YOG
— Michael Ashton (@inflation_guy) March 12, 2019
- Other Goods and Services were +0.54% m/m, which is a big jump for a catch-all category. Worth drilling deeper. Medical Care and Recreation had big drops.
- Core Goods dropped to 0.1% y/y from 0.3%. A significant contributor there was a decline in CPI-Used Cars and Trucks, which fell to 1.1% from 1.6% y/y. That’s not as big a deal as you think. But it’s big enough to matter at the margin in core goods.

- Our model has core goods rising a bit further, and you can see that even a simple look like a correlation with core import prices suggests we should see a bit more. And with tariffs, hard to think the dip in core goods sticks.

- I mentioned Used cars and trucks fell, but New vehicles rose to 0.29% y/y from 0.04%, reversing last month’s decline. Overall, used and new together (which is 7% of CPI!) fell to 0.49% from 0.92%.
- Now let’s look at medical care. 1.73% y/y from 1.90% for the broad category. Medicinal drugs fell to -1.12% y/y from -0.36%. Again, core goods. Actually I wonder what core goods ex pharma and cars must have been doing so core goods only fell to 0.1% from 0.3% y/y!
- Now this is really interesting. Pharma as I said was negative, and is continuing an amazing trend. But think this looks amazing?

- Here’s what the pharma looks like in terms of level. Medicine prices have peaked? Is the move to biologics, which tend to be cheaper, accelerating and causing this? Or…

- …or is this just another period like 2012-2013, when we had a temporary slowdown (driven by medicare if I recall) but then caught up? FWIW, my guess is that this slowdown represents a real evolution in care, though I don’t think we’ve seen the end of pharmaceuticals.

-
That could be part of it, definitely. https://t.co/olh1fW7N2z
— Michael Ashton (@inflation_guy) March 12, 2019
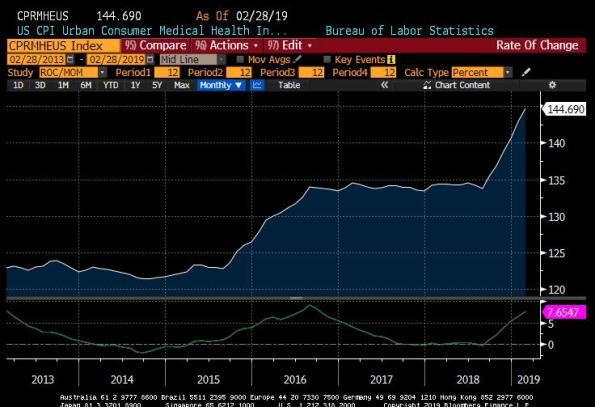
- Back to Medical Care: Professional Services fell to 0.97% from 1.16% y/y; Hospital and Related Services decelerated to 2.12% from 2.44%. This is helping hold down core services generally. But Health Insurance (which in CPI is a residual) rose smartly. Now 7.66% y/y from 6.46%.
- Here’s health insurance. Only 1.1% of CPI, which is one way you know it’s just a residual. CPI accounts for the increase in care costs mostly directly so this chart doesn’t show the full story of what’s happening in insurance. But it’s a cool chart.
- College Tuition and Fees rose to 3.13% from 2.93%. It has started to rise again partly because market returns were worse last year (60/40 was -2.4% and many other asset classes declined too).

- (When endowment returns suffer, tuitions accelerate. This is why we invented the S&P Target Tuition Inflation Index. https://us.spindices.com/indices/multi-asset/sp-target-tuition-inflation-index … )
- FWIW, Postage is +5.89% y/y. Not sure I would read a lot into that. 🙂

- Biggest declines on the month, with annualized rates of change: Car and Truck Rental (-57%), Jewelry and Watches (-34%), Leased Cars and Trucks (-18%), and Medical Care Commodities (pharma) (-11%).
- Biggest increases on the month, with annualized rates of change: Misc Personal Goods (52%), Men’s and Boys’ Apparel (50%), Infants’ and Toddlers’ Apparel (33%), Fuel Oil and Other Fuels (21%).
- This month we will again be reminded why looking at Median CPI matters. My guess at Median CPI is 0.26%, which would bring y/y back up to 2.78%. Won’t know for a few hours.
- Lest we think that inflation markets behave rationally…here are 10-year inflation swaps in red, against current median CPI. Calling for a lot of deceleration that we’re not seeing in the data yet.


- Core ex-shelter declined this month to 1.18% y/y from 1.39%. OK, so that’s one place we’re seeing deceleration. So you might say that inflation markets are betting on a serious deceleration in housing inflation.
- Well, we see a slowdown in OER, but not such a large one that long-term inflation swaps look fair.

- So for the cherry on top here are the four pieces charts. Each one is about a quarter of CPI, plus or minus, in order of least stable to most. First is Food and Energy.

- Second piece is core goods. Setback this month, but I’m not convinced that used cars and trucks are leading the way on this series at the moment.

- Core Services less Rent of Shelter. Here’s where the disinflationists need to make hay. And medical care inflation is helping them. Hard to see anything but a downtrend here at the moment.

- On the other hand, Rent of Shelter – the most stable component – continues to NOT COLLAPSE as some are expecting it to. Yes, shelter costs are outrunning wage growth. But not so much any more, thanks to accelerating wages.

- Actually, that wages/rents thing is a bit of a canard. Here is the Atlanta Fed’s Wage Growth Indicator vs Rent of Shelter. Wages have actually been keeping up fine with housing inflation. (& the increased cost of housing is one reason people are fighting for higher wages).

- In conclusion, until I think of something else: last month CPI wasn’t as strong as people thought; this month is isn’t as weak as people think. With interest rates soggy the risk of a serious inflation debacle in this stroke of the economic cycle is receding. However…
- …however, I do think that we are unlikely to see in the next recession anything like the dip we saw in the last recession. There’s a lot of good news in the figure right now. And when interest rates start to rise again, we’re going to see a higher high.
Categories: CPI, Tweet Summary
Comments (0)
Trackbacks (0)
Leave a comment
Trackback