Summary of My Post-CPI Tweets (Mar 2018)
Below is a summary of my post-CPI tweets. You can (and should!) follow me @inflation_guyPV and get this in real time, by going to PremoSocial. Or, sign up for email updates to my occasional articles here. Investors with interests in this area be sure to stop by Enduring Investments or Enduring Intellectual Properties. Plus…buy my book about money and inflation. The title of the book is What’s Wrong with Money? The Biggest Bubble of All; order from Amazon here.
- OK, 15 minutes out from CPI. Exciting one after last month’s WTF print.
- Last month remember core CPI was +0.349% m/m, highest m/m in 12 years. 1.846% on y/y, so almost printing 0.4% and 1.9% which would have been emotionally challenging for the markets and Fed.
- For this month, 0.17% is rough consensus on core. For the economists. The Street is leaning short of that number. The story is that last month’s CPI was pulled higher by one-offs.
- But some of those things they think are one-offs, like Apparel, weren’t. They were reversing previous one-offs.
- Maybe some of them were, but I don’t see many. I think another 0.3% is unlikely but the market – both bonds and stocks – would react extremely poorly if we got it, even if it was just rounded up to 0.3%.
- Anything 0.18% and higher will cause y/y core to tick up to 1.9%. To go to 1.7% you’d need 0.07%. So bigger risk of an uptick.
- At some level this isn’t really a risk…it’s going to happen over next few months anyway. Mar-July 2017 was 0.9% annualized on core CPI.
- This month we’re watching apparel of course (+1.66% m/m last month). Also used cars & trucks, which everyone thinks is going down but I think is still going up.
- And medical care, which looks a little like it might be hooking higher but has a long way to go. Hospital services is one place we could see mean reversion. If I made point forecasts, I’d probably be roughly on consensus. But I don’t. I spend my time thinking about risks.
- …and while some of the risks to the consensus are lower, they’re already incorporating some mean reversion. Underlying pace of inflation is ~2.4% ex- the one-offs, so 0.17% is a bit below the ‘natural’ current run rate. And as I said the Street is leaning shorter than that.
- Anyway, we’ll find out in 10 minutes. Either way, I’m on the TD Ameritrade Network at 3:05 to talk about CPI. Also, if you missed it check out the Odd Lots podcast I’m featured on this week: http://www.podbean.com/media/share/dir-zinyp-3b109f4
- Going into the number, 10y Treasury yields are -1bp, Breakevens +0.25bp roughly, S&P futures +4.6.
- Well 0.18% on core m/m, and 1.857% on y/y. Those economists are goooood. But that’s above where traders were looking.
- Last 12 months. This does make the slope look less scary.

- Hey look! Another one-off on Apparel (tongue in cheek). +1.46% m/m. But that only pushes the y/y to 0.40%.
- Hey look! Another one-off in used cars and trucks, +0.89% m/m. But that only pushes the y/y to -0.1%. [Editor’s Note – see below for my mea culpa. This was NSA. Seasonally-adjusted it was actually down, though I have the y/y right.]

- But Primary Rents, which were +0.34% last month, only 0.20% this month. y/y to 3.64% from 3.73%. And OER 0.20% m/m (0.28% last m/m), and y/y falls to 3.15% from 3.20%. And those are big chunks. And those really ARE probably one-offs.
- I am less sure that medical care is a one-off…-0.11% this month vs +0.18% last month. y/y slips to 1.76% vs 1.98%. Pharma lower (2.06% vs 2.39% y/y), and yep! Hospital Services mean-reverted. 5.01% y/y vs 6.04% y/y.
- Also big weakness in recreation. +0.61% y/y vs +1.12% y/y. I’m going to want to drill deeper on that one.
- Core goods rose to -0.5% y/y vs -0.7%. Core services were steady at +2.6%. That rise in core goods is largely the result of apparel of course. But the fact core goods are still in deflation tells you how widespread the goods deflation is.
- Breakevens down slightly on this report, which seems odd to me. Stocks and bonds stronger. I don’t get the reaction…I guess investors outside of the Street were leaning towards a high miss? Always was nice as a bank trader to be wrong and still make money.
- …and there goes Tillerson, according to WaPo. That’s probably not related to CPI.
- FWIW, I said the y/y core CPI was 1.86%, which it was on a SA basis. But the NSA y/y was 1.847%, which is the reason the ‘official’ print didn’t go to 1.9%.
- Finally drilling down. in Recreation…Video and Audio I guess is the culprit. 1.47% vs 2.29%. Recreation is only 5.7% of CPI, I guess that’s probably not worth obsessing over.
- Lodging away from home, incidentally, was -1.51% vs -1.27%. prepare for more declarations of the “AirBnB effect.” Onle reason Housing rose, rather than falling on weak Rent and OER, was the jump in Household Energy.
- Just realize I didn’t show a chart of the Hospital Services mean reversion. I did warn you.


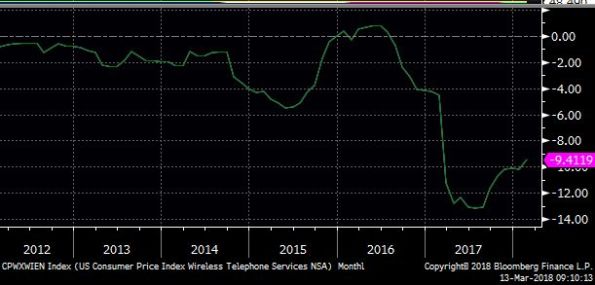
- Good segue. Here’s y/y for wireless telecom. Over the last 6 months, it’s actually flat. Because once you have infinity data, it’s hard to have more more quality improvement.
- Core ex-housing is 0.92%, highest in a year, and it’s going to bounce higher next month (again, cell phones).
- Still, core ex-shelter of 1.xx is nothing to be terrified about.
- Here’s a long-term view of Apparel (geez, I’m jumping around a lot). The two-month jump puts us basically flat for the last five years. I didn’t think we would get a reversal of last mo’s jump, but two in a row is a bit sporty. Might get some next month.

- I think if anyone says “used cars should reverse lower,” you can point out that NEW cars dove at an annualized 5.75% rate this month. That’s at least as likely to reverse higher as used are to reverse lower.
- NEW vehicles are at -1.47% y/y, the lowest since 2009. That’s weird.
- Biggest one-month jumps are in apparel, motor vehicle insurance, and leased cars and trucks. Which is interesting. Probably not worth reading into one month in automotive.
- Early guess at Median…is 0.17%, bringing y/y to 2.41% (lower than last mo). But again there’s a caveat in that I have a regional OER as the median category, and the Cleveland Fed seasonally adjusts those separately so I may (will) be off on that. But probably not a lot.

- You heard it here first! About three or four months ago…!
- I think the summary of this report is that…if you thought inflation is contained, and last month was just a normal data wobble, this report doesn’t change your mind. And if you thought last month was a harbinger, this report doesn’t change your mind.
- …and therefore, this shouldn’t change any minds at the Fed. They’re as hawkish or dovish now as they were before this report.
- For me the picture is the same – the dramatic acceleration we are seeing and will see in the y/y numbers make for ugly optics over the next 5 months. But the underlying fact is that inflation is accelerating, but fairly slowly so far.
- Oh, you know what…mea culpa on the used cars. I was looking at the NSA. The y/y is still higher, at -0.1% from -0.6%, but the m/m was actually down on a SA basis. My mistake.
- OK, four-pieces charts. Food & Energy:

- Core Goods – finally showing some reaction to the dollar’s decline? This is a key piece of the argument that inflation will head higher over the medium term…if it does, core goods can’t be stuck in deflation in nominal terms.

- What I meant by that last remark…they can deflate RELATIVELY, but if the general level of inflation is going higher in a sustainable way, it can’t be all housing.
- Piece 3…core services less ROS. This is going to go higher next month with cell phones. The key question is whether medical is going to mean revert. Again, an important part of the picture if core is going to go above 3% eventually.

- Rent of Shelter. This has returned to the uptrend line and I wouldn’t expect much additional weakness. The trend here is stable to higher.

- One final chart…the weight of categories inflating faster than 3%. The distribution is about half showing inflation >3%, and then about 10-15% of consumption is deflating. So draw whatever conclusion you want!

- That’s all for today. Thanks for tuning in!
After last month’s crazy print, this month’s CPI was much more ham-on-rye as they say. Declines in the big housing categories and a retracement in hospital services were counterbalanced by a rise in Apparel (which could be partly reversed). Also, cars and trucks were a drag on the m/m. The strange weakness in new cars is confounding, with the weakness in the dollar especially but also the hurricane effect. It’s probably a sign of overbuilding in that industry. Well, a tariff on steel ought to help reverse those price declines…
There’s nothing here that suggests the underlying story isn’t still the same: underlying inflation is slowly, and not dramatically, increasing. As the one-offs dissipate, the y/y figures will accelerate more dramatically and indeed the comps over the next five months virtually assure we’ll see core inflation around 2.4%-2.5% by summer. But that’s where inflation already is…it’s just the optics catching up.
And, as a result, there’s nothing here that changes the trajectory of Fed policy. I suppose this data will be taken as positive by equity investors, if they are in a good mood and inclined to take no-bad-news as good news. If they’re in a bad mood, they’ll tend to take no-good-news as bad news, of course, but right now they seem to be in a good mood!