Archive
You Haven’t Missed It
A question I always enjoy hearing in the context of markets is, “Have I missed it?” That simple question betrays everything about the questioner’s assumptions and about the balance of fear and greed. It is a question which, normally, can be answered “no” almost without any thought to the situation, if the questioner is a ‘normal’ investor (that is, not a natural contrarian, of which there are few).
That is because if you are asking the question, it means you are far more concerned with missing the bus than you are concerned about the bus missing you.
It usually means you are chasing returns and are not terribly concerned about the risks; that, in turn – keeping in mind our assumption that you are not naturally contrary to the market’s animal spirits, so we can reasonably aggregate your impulses – means that the market move or correction is probably underappreciated and you are likely to have more “chances” before the greed/fear balance is restored.
Lately I have heard this question arise in two contexts. The first was related to the stock market “correction,” and on at least two separate occasions (you can probably find them on the chart) I have heard folks alarmed that they missed getting in on the correction. It’s possible, but if you’re worried about it…probably not. The volume on the bounces has diminished as the market moves away from the low points, which suggests that people concerned about missing the “bottom” are getting in but rather quickly are assuming they’ve “missed it.” I’d expect to see more volume, and another wave of concern, if stocks exceed the recent consolidation highs; otherwise, I expect we will chop around until earnings season is over and then, without a further bullish catalyst, the market will proceed to give people another opportunity to “buy the dip.”
The other time I have heard the angst over missing the market is in the context of inflation. In this, normal investors fall into two categories. They’re either watching 10-year inflation breakevens now 100bps off the 2016 lows and 50bps off the 2017 lows and at 4-year highs (see chart, source Bloomberg) and thinking ‘the market is no longer cheap’, or they just noticed the well-telegraphed rise in core inflation from 1.7% to 2.1% over the last several months and figuring that the rise in inflation is mostly over, now that the figure is around the Fed’s target and back at the top of the 9-year range.

Here again, the rule is “you didn’t miss it.” Yes, you may have missed buying TIPS 100bps cheap to fair (which they were, and we pointed it out in our 2015Q3 Quarterly Inflation Outlook to clients), but breakevens at 2.17% with median inflation at 2.48% and rising (see chart, source Bloomberg), and still 25bps below where breakevens averaged in the 5 years leading up to the Global Financial Crisis, says you aren’t buying expensive levels. Vis a vis commodities: I’ve written about this recently but the expectations for future real returns are still quite good. More to the point, inflation is one of those circumstances where the bus really can hit you, and concern should be less about whether you’ve missed the gain and more about whether you need the protection (people don’t usually lament that they missed buying fire insurance cheaper, if they need fire insurance!).

(In one way, these two ‘did I miss it’ moments are also opposites. People are afraid of missing the pullback in stocks because ‘the economy still looks pretty strong,’ but they’re afraid they missed the inflation rally because ‘the economy is going to slow soon and the Fed is tightening and will keep inflation under control.’ Ironically, those are both wrong.)
My market view is this:
- For some time, TIPS have been very cheap to nominal bonds, but rich on an absolute Negative real yields do not a bargain make, even if they look better than other alternatives when lots of asset classes are even more expensive. But as real yields now approach 1% (70bps in 5y TIPS, 80bps in 10y TIPS), and with TIPS still about 35bps cheap to nominal bonds, they are beginning to be palatable to hold on their own right. And that’s without my macro view, which is that over the next decade, one way or the other, inflation protection will become an investment theme that people tout as a ‘new focus’ even though it’s really just an old focus that everyone has forgotten. But the days of <1% inflation are over, and we aren’t going to see very much <2% either. We may not see 4% often, or for long, but at 3% inflation is something that people need to take into account in optimizing a portfolio. I think we’re at that inflection point, but if not then we will be in a year or two. And TIPS are a key, and liquid, component of smart real assets portfolios.
- Stocks have been outrageously expensive with very poor forward return expectations for a long time. However, these value issues have been overwhelmed by strong momentum (that, honestly, I never gave enough credit to) and the currently in-vogue view that momentum is somehow better than value. But perennially strong momentum is no longer a foregone conclusion. Momentum has stalled in the stock market – the S&P has broken the 50-day, 100-day, and (a couple of times, though only briefly so far) 200-day moving averages. The 50-day has now crossed below the 100-day. And the longer that the market chops sideways the weaker the momentum talisman becomes. Eventually, the value anchor will take over. There may be more chop to come but as I said above, I think another leg down is likely to come after earnings season.
And so, in neither case have you “missed it.”
Being Closer to the ‘Oh Darn’ Inflation Strike
The time period between spikes of inflation angst seems to be shortening. I am not sure yet about the amplitude of those spikes of angst, but the concern seems to be quickening.
This is not without reason as it seems that concerning headlines are occurring with more frequency. This week the Bloomberg Commodity Index again challenged the 2016 and 2017 highs before backing off today (see chart, source Bloomberg).

Somewhat more alarming than that, to people who watch commodities, is how the commodity indices are rallying. The culprits are energy as well as industrial metals, and each has an interesting story to tell. Energy has been rallying partly because of global tensions, but also partly because US shale oil production appears to be running into some bottlenecks on production (wages, shortages of frack sand) as well as delivery (capacity constraints on pipelines), and part of what has kept a lid on energy prices over the last couple of years was the understanding that shale oil production was improving rapidly and becoming lots more efficient due to improved technology. If shale is limited, the ‘lid’ on prices is not as binding as we had thought. On industrial metals, some of the upward pressure has been due to fallout from US sanctions on Rusal, a major supplier of aluminum and alumina. Since those sanctions were announced, aluminum prices have risen around 25%, and alumina (a raw input to aluminum production) about 50%, with knock-on effects in other industrial metals.
Both of these items bear on the market’s recent fears about new pressures on inflation – capacity constraints (especially rising wages for long-haul truckers) and potential fracturing of the global trade détente.
And 10-year breakevens are at new 4-year highs, although it is worth remembering that this is nowhere near the 10-year highs (see chart, source Bloomberg).

Shorter inflation swaps look less alarming, and not at new four-year highs. However, even here the news is not really soothing. The reason that shorter inflation swaps are lower than they have been in the past is because the energy curves are in backwardation – meaning that the market is pricing in lower energy process in the future. In turn, this means that implied core inflation – once we strip out these energy effects – are, in fact, at 4-year highs (see chart, source Enduring Investments).

So there is legitimate cause to be concerned about upside risks to inflation, and that’s one reason the market is a bit jumpier in this regard. But there is also additional premium, volatility, and angst associated with the level of inflation itself. While as I have pointed out before much of the rise in core inflation to date due to optics arising from base effects, that doesn’t change the fact that the ‘oh, rats’ strike is closer now. That is to say that when core inflation is running at 1.5%, stuff can go wrong without hurting you if your pain threshold is at 3%. But when core inflation is at 2.5% (as it will be this summer), not as much “bad stuff” needs to happen to cause financial pain. In other words, both the ‘delta’ and the ‘gamma’ of the exposure is higher now – just as if one were short a call option struck at (say) 3% inflation. Because, implicitly, many investors are.
If inflation is low, then even if it is volatile in a range it can be consistent with high market valuations for stocks and bonds. But when inflation starts to creep above 3%, those markets tend to suffer in non-linear fashion.
And this, I believe, is why the market’s nervousness about inflation (and market volatility resulting from that nervousness) is unlikely to soon abate.
Why the M2 Slowdown Doesn’t Blunt My Inflation Concern
We are now all good and focused on the fact that inflation is headed higher. As I’ve pointed out before, part of this is an illusion of motion caused by base effects: not just cell phones, but various other effects that caused measured inflation in the US to appear lower than the underlying trend because large moves in small components moved the average lower even while almost half of the consumption basket continues to inflate by around 3% (see chart, source BLS, Enduring Investments calculations).

But part of it is real – better central-tendency measures such as Median CPI are near post-crisis highs and will almost certainly reach new highs in the next few months. And as I have also pointed out recently, inflation is moving higher around the world. This should not be surprising – if central banks can create unlimited amounts of money and push securities prices arbitrarily higher without any adverse consequence, why would we ever want them to do anything else? But just as the surplus of sand relative to diamonds makes the former relatively less valuable, adding to the float of money should make money less valuable. There is a consequence to this alchemy, although we won’t know the exact toll until the system has gone back to its original state.
(I think this last point is underappreciated. You can’t measure an engine’s efficiency by just looking at the positive stroke. It’s what happens over a full cycle that tells you how efficient the engine is.)
I expect inflation to continue to rise. But because I want to be fair to those who disagree, let me address a potential fly in the inflationary ointment: the deceleration in the money supply over the last year or so (see chart, source Federal Reserve).

Part of my thesis for some time has been that when the Fed decided to raise interest rates without restricting reserves, they played a very dangerous game. That’s because raising interest rates causes money velocity to rise, which enhances inflation. Historically, when the Fed began tightening they restrained reserves, which caused interest rates to rise; the latter effect caused inflation to rise as velocity adjusted but over time the restraint of reserves would cause money supply growth (and then inflation) to fall, and the latter effect predominated in the medium-term. Ergo, decreasing the growth rate of reserves tended to cause inflation to decline – not because interest rates went up, which actually worked against the policy, but because the slow rate of growth of money eventually compounded into a larger effect.
And so my concern was that if the Fed moved rates higher but didn’t do it by restraining the growth rate of reserves, inflation might just get the bad half of the traditional policy result. The reason the Fed is targeting interest rates, rather than reserves, is that they have no power over reserves right now (or, at best, only a very coarse power). The Fed can only drain the inert excess reserves, which don’t affect money supply growth directly. The central bank is not operating on the margin and so has lost control of the margin.
But sometimes they get lucky, and they may just be getting lucky. Commercial bank credit growth (see chart, source Federal Reserve) has been declining for a while, pointing to the reason that money supply growth is slowing. It isn’t the supply of credit, which is unconstrained by reserves and (at least for now) unconstrained by balance sheet strength. It’s the demand for credit, evidently.

Now that I’ve properly laid out that M2 is slowing, and that declining M2 growth is typically associated with declining inflation (and I haven’t even yet pointed out that Japanese and EU M2 growth are both also at the lowest levels since 2014), let me say that this could be good news for inflation if it is sustained. But the problem is that since the slowing of M2 is not the result of a conscious policy, it’s hard to predict that money growth will stay slow.
The reason it needs to be sustained is that we care about percentage changes in the stock of money plus the percentage change in money velocity. For years, the latter term has been a negative number as money velocity declined with interest rates. But M2 velocity rose in the fourth quarter, and my back-of-the-envelope calculation suggests it probably rose in Q1 as well and will rise again in Q2 (we won’t know Q1’s velocity until the advance GDP figures are reported later this month). If interest rates normalize, then it implies a movement higher in velocity to ‘normal’ levels represents a rise of about 12-14% from here (see chart, source Bloomberg.[1])

If money velocity kicks in 12-14% over some period to the “MVºPQ” relationship, then you need to have a lot of growth, or a pretty sustained decline in money growth, to offset it. The following table is taken from the calculator on our website and you can play with your own assumptions. Here I have assumed the economy grows at 2.5% per year for the next four years (no mean feat at the end of a long expansion).

The way to read this chart is to say “what if velocity over the next four years returns to X. Then what money growth is associated with what level of inflation?” So, if you go down the “1.63” column, indicating that at the end of four years velocity has returned to the lower end of its long-term historical range, and read across the M2 growth rate row labeled “4%”, you come to “4.8%,” which means that if velocity rises to 1.63 over the next four years, and growth is reasonably strong, and money growth remains as slow as 4%, inflation will average 4.8% per year over those four years.
So, even if money growth stays at 4% for four years, it’s pretty easy to get inflation unless money velocity also stays low. And how likely is 4% money growth for four years? The chart below shows 4-year compounded M2 growth rates back thirty or so years. Four percent hasn’t happened in a very long time.

Okay, so what if velocity doesn’t bounce? If we enter another bad recession, then it’s conceivable that interest rates could go back down and keep M2 velocity near this level. This implies flooding a lot more liquidity into the economy, but let’s suppose that money growth is still only 4% because of tepid credit demand growth and velocity stays low because interest rates don’t return to normal. Then what happens? Well, in this scenario presumably we’re no longer looking at 2.5% annual growth. Here’s rolling-four-year GDP going back a ways (source: BEA).

Well, let’s say that it isn’t as bad as the Great Recession, and that real growth only slows a bit in fact. If we get GDP growth of 1.5% over four years, velocity stays at 1.43, and M2 grows only at 4%, then:
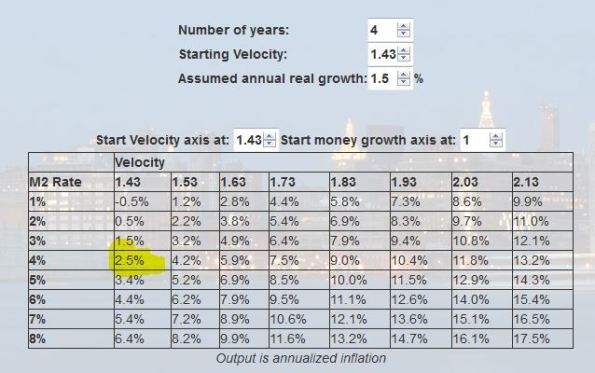
…you are still looking at 2.5% inflation in that case.
I’m going through these motions because it’s useful to understand how remarkable the period we’ve recently been through actually is in terms of the growth/inflation tradeoff, and how unlikely to be repeated. The only reason we have been able to have reasonable growth with low inflation in the context of money growth where it has been is because of the inexorable decline in money velocity which is very unlikely to be repeated. If velocity just stops going down, you might not have high inflation numbers but you’re unlikely to get very low inflation outcomes. And if velocity rises even a little bit, it’s very hard to come up with happy outcomes that don’t involve higher inflation.
I admit that I am somewhat surprised that money growth has slowed the way it has. It may be just a coin flip, or maybe credit demand is displaying some ‘money illusion’ and responding to higher nominal rates even though real rates have not changed much. But even then…in the last tightening cycle, the Fed hiked rates from 1% to 5.25% over two years in 2004-2006, and money growth still averaged 5% over the four years ended in 2006. While I’m surprised at the slowdown in money growth, it needs to stay very slow for quite a while in order to make a difference at this point. It’s not the way I’d choose to bet.
[1] N.b. Bloomberg’s calculation for M2 velocity does not quite match the calculation of the St. Louis Fed, which is presumably the correct one. They’re ‘close enough,’ however, for this purpose, and this most recent print is almost exactly the same.
Summary of My Post-CPI Tweets (Apr 2018)
Below is a summary of my post-CPI tweets. You can (and should!) follow me @inflation_guyPV and get this in real time, by going to PremoSocial. Or, sign up for email updates to my occasional articles here. Investors with interests in this area be sure to stop by Enduring Investments or Enduring Intellectual Properties. Plus…buy my book about money and inflation. The title of the book is What’s Wrong with Money? The Biggest Bubble of All; order from Amazon here.
- After a couple of weeks of relative quiet on the inflation theme, it seems people the last few days are talking about it again. Big coverage in the Daily Shot about the underlying pressures.
- I don’t normally pay much attention to PPI, but it’s hard to ignore the momentum that has been building on that side of things. In particular, the medical care index that PCE uses has been rising rapidly in the PPI. Doesn’t affect us today w/ CPI but affects the Fed convo.
- But back on CPI. Of course the main focus this month for the media will be the dropping off of the -0.073% m/m figure from March 2017, which will cause y/y CPI to jump to around 2.1% from 1.8%. It’s a known car wreck but the reporters are standing at the scene.
- That year-ago number of course was caused by cell phone services, which dropped sharply because of the widespread introduction of ‘unlimited data’ plans which the BLS didn’t handle well although they stuck to their methodology.
- Consensus expectations for this month are for 0.18% on core, which would cause y/y to round down to 2.1%. (Remember that last month, core y/y was very close to rounding up to 1.9%…that shortfall will make this month look even more dramatic.)
- It would only take 0.22% on core to cause the y/y number to round UP to 2.2%, making the stories even more hyperventilated.
- I don’t make point estimates of monthly numbers, because the noise swamps the signal. We could get an 0.1% or an 0.3% and it wouldn’t by itself mean much until we knew why. But I will say I think there are risks to a print of 0.22% or above.
- First, remember the underlying trend to CPI is really about 0.2% anyway. Median inflation is 2.4% and after today core will be over 2%. So using the last 12 months as your base guess is biased lower.
- Also, let’s look back at last month: Apparel was a big upside surprise for the second month in a row, while shelter was lower than expected. But…
- But apparel was rebounding from two negative months before that. We’re so used to Apparel declining but really last month just brought it back up to trend. And with the trade tensions and weak dollar, am not really shocked it should be rising some.
- Apparel is only +0.40% y/y, so it’s not like it needs to correct last month.
- On the other hand, OER decelerated to 0.20 from 0.28 and primary rents decelerated to 0.20 from 0.34, m/m. But there’s really no reason yet to be looking for rent deceleration – housing prices, in fact, are continuing to accelerate.

- No reason to think RENTAL costs should be decelerating while PURCHASE costs are still accelerating. Could happen of course, but a repeat of last month’s numbers is less likely.
- Finally – this gets a little too quanty even for me, but I wonder if last month’s belly flop in CPI could perturb the monthly seasonal adjustments and (mistakenly) overcorrect and push this month higher. Wouldn’t be the first time seasonals bedeviled us.
- I don’t put a lot of weight on that last speculation, to be clear.
- Market consensus is clearly for weakness in this print. I’m just not so sure the ball breaks that way. But to repeat what I said up top: the monthly noise swamps the signal so don’t overreact. The devil is in the details. Back up in 5 minutes.
- ok, m/m core 0.18%. Dang those economists are good. y/y to 2.12%.
- After a couple of 0.18s, this chart looks less alarming.

- OK, Apparel did drop again, -0.63% m/m, taking y/y to 0.27%. So still yawning there. Medical Care upticked to 1.99% from 1.76% y/y, reversing last month’s dip. Will dig more there.
- In rents, OER rose again to 0.31% after 0.20% soft surprise last month, and primary rents 0.26% after a similar figure. y/y figures for OER and Primary Rents are 3.26% and 3.61% respectively. That primary rent y/y is still a deceleration from last mo.
- Core services…jumped to 2.9% from 2.6%. Again not so surprising since cell phone services dropped out. So that’s the highest figure since…a year ago.
- Core goods, though, accelerated to -0.3% from -0.5%. That’s a little more interesting. It hasn’t been above 0 for more than one month since 2013, but it’s headed that way.

- Within Medical Care…Pharma again dragged, -0.16% after -0.44% last month…y/y down to 1.87% from 2.39% two months ago. So where did the acceleration come from?
- Well, Hospital Services rose from 5.01% to 5.16% y/y, which is no big deal. But doctors’ services printed another positive and moved y/y to -0.83% from -1.27% last month and -1.51% two months ago. Still a long way to go there.

- Oh wait, get ready for this because the inflation bears will be all about “OH LODGING AWAY FROM HOME HAD A CRAZY ONE-MONTH 2.31% INCREASE.” Which it did. Which isn’t unusual.

- Interestingly those inflation bears who will tell us how Lodging Away from Home will reverse next month (it will, but hey folks it’s only 0.9% of the index) are the same folks always telling us that AirBnB is killing hotel pricing. MAYBE NOT.
- Finally making it back to cars. CPI Used cars and trucks had another negative month, -0.33% after -0.26% last month. That really IS a surprise: we’ve never seen the post-hurricane surge that I expected.

- Sure, used cars are out of deflation, now +0.37% y/y. New cars still deflating at -1.22% vs -1.47% y/y last month. But that really tells you how bad the inventory overhang is in autos. Gonna suck to be an auto manufacturer when the downturn hits. As usual.
- Leased cars and trucks, interestingly (only 0.64% of CPI) are +5.26% y/y. Look at that trend. Maybe that’s where the demand for cars is going.

- Oh, how could I forget the star of our show! Wireless telephone services went to -2.41% y/y from -9.43% y/y last month. Probably will go positive over next few months – a real rarity! But after “infinity” data where does the industry go on pricing? Gotta be in the actual price!
- College tuition and fees: 1.75% y/y from 2.04%. Lowest in a long time. This is a lagged effect of the big stock and bond bull market, and that effect will fade. Tuition prices will reaccelerate.
- Bigger picture. Core ex-housing rose to 1.23% from 0.92%. Again, a lot of that is cell phone services. But deflation is deep in the rear-view mirror.
- While I’m waiting for my diffusion stuff to calculate let’s look ahead. We’re at 2.1% y/y core CPI now. The next m/m figures to “roll off” from last year are 0.09, 0.08, 0.14, and 0.14.
- In other words, core is still going to be accelerating optically even if there’s no change in the underlying, modestly accelerating trend. Next month y/y core will be 2.2%, then 2.3%, then 2.4%. May even reach 2.5% in the summer.
- This is also not in isolation. The Underlying Inflation Gauge is over 3% for the first time in a long time. Global inflation is on the rise and Chinese inflation just went to the highest level it has seen in a while.
- One of the stories I’m keeping an eye on too is that long-haul trucker wages are accelerating quickly because new technology has been preventing drivers from exceeding their legal driving limits…which has the effect of restraining supply in trucking capacity.
- …and that feeds into a lot of things. Until of course the self-driving cars or drone air force takes care of it.
- The real question, of course, is whence inflation goes after the summer. I believe it will continue to rise as higher interest rates help to goose money velocity after a long time. But it takes time for that theme to play out.
- time for four-pieces. Here’s Food & Energy.

- Core goods. Consistent with our theme. it’s going higher.

- OK, here’s where cell phone services come in: core services less rent of shelter. So the recent jump is taking us back to where we were a year ago. Real question here is whether medical rallies. Some signs in PPI it may be.

- Rent of Shelter continues to be on our model. Some will look for a reversal in this little jump – not me.

- Another month where one of the OER subindices will probably be the median category so my guess won’t be fabulous. It will probably either be 0.26% m/m on median (pushing y/y to 2.49%), or 0.20% (y/y to 2.44%). Either way it’s a y/y acceleration.
- Oh, by the way…10y breakevens are unchanged on the day. This is the second month of data that was ‘on target,’ but surprised the real inflation bears. There isn’t anything really weird here or doomed to be reversed…at least, nothing large.
- Bottom line for markets is core CPI will continue to climb; core PCE will continue to climb. For at least a few more months (and probably longer, but next 3-4 are baked into the cake). Even though this is known…I don’t know that the Fed and markets will react well to it.
- That’s all for today, unless I think of something in 5 minutes as usually happens. Thanks for subscribing!!
As I said in the tweet series – this was at some level a ham-on-rye report, coming in right on consensus expectations. But some observers had looked for as low as 0.11% or 0.13% – some of them for the second month in a row – and those observers are either going to have to get religion or keep being wrong. There are a couple of takeaways here and one of them is that even ham-on-rye reports are going to cause y/y CPI to rise over the next four months. This is entirely predictable, as is the fact that core PCE will also be rising rapidly (and possibly more rapidly since medical care in the PCE seems to be turning up more quickly). But that doesn’t mean that the market won’t react to it.
There are all sorts of things that we do even though we know we shouldn’t. I would guess that most of us, noticing that our sports team won when we wore a particular shirt or a batter hit a home run when we pet the dog a certain way, have at some point in the past succumbed to the “well, maybe I should do it just in case” aspect of superstition. But there’s more to it than that. In the case of markets, it is well and good to say “I know this isn’t surprising to see year-on-year inflation numbers rising,” but there’s the second-level issue: “…but I don’t know that everyone else won’t be surprised or react, so maybe I should do something.”
By summertime, core CPI will have reached its highest level since the crisis. Core PCE will probably also have reached its highest level since the crisis. Median CPI has been giving us a steadier reading and so perhaps will not be at new highs, but it will be near the highest readings of the last decade. I believe that whether we think it should happen or not, the dot plots will move higher (unless growth stalls, which it may) and markets will have to deal with the notion that additional increases in inflation from there would be an unmitigated negative. So we will start to price that in.
Moreover, I am not saying that there aren’t underlying pressures that may, and indeed I think will, continue to push prices higher. In fact, I think that there is some non-zero chance of an inflationary accident. And, in the longer run, I am really, really concerned about trade. It doesn’t take a trade war to cause inflation to rise globally; it just takes a loss of momentum on the globalization front and I think we already have that. A bona fide trade war…well, it’s a really bad outcome.
I don’t think that just because China has been making concessionary noises that a trade spat with China has been averted. If I were China, then I too would have made those statements: because the last half-dozen Administrations would have been content to take that as a sign of victory, trumpet it, and move on. But the Trump Administration is different (as if you hadn’t noticed!). President Trump actually seems hell-bent on really delivering on his promises in substance, not in mere appearance. That can be good or bad, depending on whether you liked the promise! In this case, what I am saying is – the trade conflict is probably not over. Don’t make the mistake of thinking the usual political dance will play out when the newest dancer is treating it like a mosh pit.
And all of this is pointed the same direction. It’s time, if you haven’t yet done it, to get your inflation-protection house in order! (And, one more pitch: at least part of that should be to subscribe to my cheapo PremoSocial feed, to stay on top of inflation-related developments and especially the monthly CPI report! For those of you who have…I hope you feel you’re getting $10 of monthly value from it! Thanks very much for your support.)
Inflation and Castles Built on Sand
Note: my articles are now released somewhat earlier on the blog site and on my private Twitter feed @inflation_guyPV, which you can sign up for here, than they are released on my ‘regular’ Twitter feed. Moreover, my monthly live tweets during the CPI report are only available on that feed.
Also note: if you haven’t heard it yet, you can listen to my appearance on the Bloomberg Odd Lots podcast last month here. For that matter, you can listen to it at that link even if you have heard it yet.
Now that we can stop focusing on the imminent destruction of wealth in the stock market, for at least today (I am underwhelmed at the rebound on light volume), we can get back to something that matters: inflation.
The chart below shows a straight, unweighted average of core or median inflation in the US, Europe, Japan, the UK, and China. (The chart looks similar if we only include the US, Europe, and China and exclude the recent ‘outlier’ Japan and UK experiences).

We know that, in the US, measured inflation is going to be rising at least until the summer, as the one-offs from 2017 drop out of the data. The prior decline, and the current rise, obscure the underlying trend…which is for steady acceleration in prices. But it’s important to realize that this is not merely a US trend, caused supposedly by ‘tight labor markets’ or somesuch. It is a much broader phenomenon. The chart below shows four of those five countries.

In the US, inflation has been rising steadily (other than that one-off burp caused by cell phones etc) since 2013. In the UK, China, and Europe, inflation has been rising since ~2015, to lesser or greater degree. In the UK, core inflation is showing some signs of topping as the Brexit-related spike fades, and the trend is less convincing in Europe so far. In Japan (see below), inflation has been rising since 2010, but the tax-induced spike in 2014 has messed up the steadiness of the trend. And of course, it is worth pointing out that 0.3% is only high relative to the average of -0.3% since 1999!

I point out these trends because inflation is less of a concern if it happens in one country than if it happens as part of a global inflation process. Imagine that inflation is represented by the proportion of the sand on a beach that is wet rather than dry. There are two ways that sand can get wet: because of random wave action that comes and goes, or because the tide is coming in.
Where you build your sand castle depends on which of these two – tide or waves – is responsible for wetting the sand on the beach.
This isn’t an idle question or speculation. In 2005, two researchers at the ECB[1] discovered that the first principal component of inflation in the G7 countries accounted for about 60-70% of the inflation in those countries. They theorized that this factor was a “global inflation” process and that FX rates compensated for the accumulated idiosyncratic inflation in each country pair. (Enduring Investments subsequently confirmed their work and we actually use this insight to drive some of our strategy models). It makes sense that there is an inflation “tide,” since central bank behaviors as well as fiscal behaviors (and cross-border interactions such as trade liberalization) are somewhat synchronized globally. Over the last decade, everyone has been easing monetary policy and running stimulative fiscal policy. Since the early 1990s, until lately, everyone was liberalizing trade policy and reaching more free trade agreements. So it isn’t a stretch to think that to at least some degree, the global inflation cycle should be synchronized as well.
(Indeed, I would argue that if there had been less synchronization in policy, then the idiosyncratic factor of an aggressively easing Japanese central bank would probably have led to a much weaker Yen and higher inflation in Japan than we have seen. Easy monetary policy is only inflationary in the short-term if there is an FX response – the waves that impact inflation idiosyncratically – which don’t really happen when everyone is doing it.) In the long-run, of course, excessively easy monetary policy changes the tide level. And, like the tide, it isn’t that easy to reverse.
The signs suggest the tide is coming in. Place your sand castle accordingly.
[1] M. Ciccarelli & B. Mojon, “Global Inflation”, ECB Working Paper N⁰537, October 2005.