Archive
Trade Surplus and Budget Deficit? Ouch.
The market gyrations of late are interesting, especially during the NCAA Basketball tourney. Normally, volatility declines when these games are on during the week, as traders watch their brackets as much as they do the market (I’ve seen quantitative analysis that says this isn’t actually true, but I’m skeptical since I’ve been there and I can promise you – the televisions on the trading floor are tuned to the NCAA, not the CNBC, on those days). Higher volatility not only implies that lower prices are appropriate in theory but it also tends to happen in practice: higher actual volatility tends to force leveraged traders to reduce position size because their calculation of “value at risk” or VAR generally uses trailing volatility; moreover, these days we also need to be cognizant of the small, but still relevant, risk-parity community which will tend to trim the relative allocation to equities when equity vol rises relative to other asset classes.
My guess is that the risk-parity guys probably respond as much to changes in implied volatility as to realized volatility, so some of that move has already happened (and it’s not terribly large). But the VAR effect is entirely a lagging effect, and it’s proportional to the change in volatility as well as to the length of time the volatility persists (since one day’s sharp move doesn’t change the realized volatility calculation very much). Moreover, it doesn’t need to be very large per trader in order to add up to a very large effect since there are many, many traders who use some form of VAR in their risk control.
Keep in mind that a sharp move higher, as the market had yesterday, has as much effect on VAR as a sharp move lower. The momentum guys care about direction, but the VAR effect is related to the absolute value of the daily change. So if you’re bullish, you want a slow and steady move higher, not a sharp move higher. Ideally, that slow and steady move occurs on good volume, too.
The underlying fundamentals, of course, haven’t changed much between Friday and Monday. The chance of a trade war didn’t decline – the probability of a trade war is now 1.0, since it has already happened. Unless you want to call an attack and counterattack a mere skirmish, rather than a trade war, there is no longer any debate about whether there will be conflict on trade; the only discussion is on magnitude. And on that point, nothing much has changed either: it was always going to be the case that the initial salvo would be stridently delivered and then negotiated backwards. I’m not sure why people are so delighted about the weekend’s developments, except for the fact that investors love stories, and the story “trade war is ended!” is a fun story to tell the gulli-bulls.
As a reminder, it isn’t necessary to get Smoot/Hawley 2.0 to get inflation. Perhaps you need Smoot/Hawley to get another Depression, but not to get inflation. The mere fact that globalization is arrested, rather than continuing to advance, is enough to change the tradeoff between growth and inflation adversely. And that has been in the cards since day 1 of the Trump Administration. A full-on trade war, implying decreased globalization, changes the growth/inflation tradeoff in a very negative way, implying much tighter money growth will be required to tamp down inflation, which implies higher interest rates. I’m not sure we aren’t still headed that way.
But there is a much bigger issue on trade, which also implies higher interest rates…perhaps substantially higher interest rates. We (and by ‘we’ I mean ‘he’) are trying to reduce the trade deficit while increasing the budget deficit sharply. This can only happen one way, and that is if domestic savings increases drastically. I wrote about this point first in 2010, and then re-blogged it in 2013, here. I think that column is worth re-reading. Here’s a snippet:
“And this leads to the worry – if the trade deficit explodes, then two other things are going to happen, although how much of each I can’t even guess: (I) protectionist sentiment is going to become very shrill, and fall on the ears of a President who is looking to burnish his populist creds, and (II) the dollar is going to be beaten like a red-headed stepchild (being a red-headed stepchild, I use that simile grudgingly).”
Well, it took a while to happen and I never dreamed the “President looking to burnish his populist creds” would be a (supposed) Republican…but that’s what we have.
Here’s the updated chart showing the relationship between these two variables.

It’s important to remember that you can’t have a trade account surplus and a financial account surplus. If someone sells a good to a US consumer, that seller holds dollars and they can either sell the dollars to someone else (in which case the problem just changes hands), buy a US good (in which case there’s no trade deficit), or buy a US security. If we need non-US persons to buy US securities, then we need to run a trade deficit. If we want to run flat on trade, then we either need to run a balanced budget or fund the difference out of domestic savings. A large increase in domestic savings implies a large decrease in domestic spending, especially if the Fed is now ‘dissaving’ by reducing its balance sheet. Inducing extra domestic savings also implies higher real interest rates. Now, this isn’t a cataclysmic result – more domestic savings implies more long-term domestic growth, although perhaps not if it’s being sopped up by the federal government – but it’s a very large shift to what the current balances are.
If you want to run a flat balance of trade, the best way to do it is to run a balanced federal budget. Going opposite directions in those two accounts implies uncomfortably large shifts in the account that makes up the difference: domestic savings, and large shifts in interest rates to induce that savings.
Nudge at Neptune
Okay, I get it. Your stockbroker is telling you not to worry about inflation: it’s really low, core inflation hasn’t been above 3% for two decades…and, anyway, the Fed is really trying to push it higher, he says, so if it goes up then that’s good too. Besides, some inflation isn’t necessarily bad for equities since many companies can raise end product prices faster than they have to adjust wages they pay their workers.[1] So why worry about something we haven’t seen in a while and isn’t necessarily that bad? Buy more FANG, baby!
Keep in mind that there is a very good chance that your stockbroker, if he or she is under 55 years old, has never seen an investing environment with inflation. Also keep in mind that the stories and scenes of wild excess on Wall Street don’t come from periods when equities are in a bear market. I’m just saying that there’s a reason to be at least mildly skeptical of your broker’s advice to own “100 minus your age” in stocks when you’re young, which morphs into advice to “owning more stocks since you’re likely to have a long retirement” when you get a bit older.
Many financial professionals are better-compensated, explicitly or implicitly, when stocks are going up. This means that even many of the honest ones, who have their clients’ best interests at heart, can’t help but enjoy it when the stock market rallies. Conversations with clients are easier when their accounts are going up in size every day and they feel flush. There’s a reason these folks didn’t go into selling life insurance. Selling life insurance is really hard – you have to talk every day to people and remind them that they’re going to die. I’d hate to be an insurance salesman.
And yet, I guess that’s sort of what I am.
Insurance is about managing risks. Frankly, investing should also be about managing risks – about keeping as much upside as you can, while maintaining an adequate margin of safety. Said another way, it’s about buying that insurance as cheaply as you can so that you don’t spend all of your money on insurance. That’s why diversification is such a powerful idea: owning 20 stocks, rather than 1 stock, gets you downside protection against idiosyncratic risks – essentially for free. Owning multiple asset classes is even more powerful, because the correlations between asset classes are generally lower than the correlations between stocks. Diversification works, and it’s free, so we do it.
So let’s talk about inflation protection. And to talk about inflation protection, I bring you…NASA.
How can we prevent an asteroid impact with Earth?
The key to preventing an impact is to find any potential threat as early as possible. With a couple of decades of warning, which would be possible for 100-meter-sized asteroids with a more capable detection network, several options are technically feasible for preventing an asteroid impact.
Deflecting an asteroid that is on an impact course with Earth requires changing the velocity of the object by less than an inch per second years in advance of the predicted impact.
Would it be possible to shoot down an asteroid that is about to impact Earth?
An asteroid on a trajectory to impact Earth could not be shot down in the last few minutes or even hours before impact. No known weapon system could stop the mass because of the velocity at which it travels – an average of 12 miles per second.
NASA is also in the business of risk mitigation, and actually their problem is similar to the investor’s problem: find protection, as cheaply as possible, that allows us to retain most of the upside. We can absolutely protect astronauts in space from degradation of their DNA from cosmic rays, with enough shielding. The problem is that the more shielding you add, the harder it is to go very far, very fast, in space. So NASA wants to find the cheapest way to have an effective cosmic ray shield. And, in the ‘planetary defense’ role for NASA, they understand that deflecting an asteroid from hitting the Earth is much, much easier if we do it very early. A nudge when a space rock is out at the orbit of Neptune is all it takes. But wait too long, and there is no way to prevent the devastating impact.
Yes, inflation works the same way.
The impact of inflation on a normal portfolio consisting of stocks and bonds is devastating. Rising inflation hurts bonds because interest rates rise, and it hurts stocks because multiples fall. There is no hiding behind diversification in a ’60-40’ portfolio when inflation rises. Other investments/assets/hedges need to be put into the mix. And when inflation is low, and “high” inflation is far away, it is inexpensive to protect against that portfolio impactor. I have written before about how low commodities prices are compared with equity prices, and in January I also wrote a piece about why the expected return to commodities is actually rising even as commodities go sideways.
TIPS breakevens are also reasonable. While 10-year breakevens have risen from 1.70% to 2.10% over the last 9 months or so, that’s still below current median inflation, and below where core inflation will be in a few months as the one-offs subside. And it’s still comfortably below where 10-year breaks have traded in normal times for the last 15 years (see chart, source Bloomberg).

It is true that there are not a lot of good ways for smaller investors to simply go long inflation. But you can trade out your nominal Treasuries for inflation bonds, own commodities, and if you have access to UCITS that trade in London there is INFU, which tracks 10-year breakevens. NASA doesn’t have a lot of good options, either, for protecting against an asteroid impact. But there are many more plausible options, if you start early, than if you wait until inflation’s trajectory is inside the orbit of the moon.
[1] Your stockbroker conveniently forgets that P/E multiples contract as inflation rises past about 3%. Also, your stockbroker conveniently abandons the argument about how businesses can raise prices before raising wages, meaning that consumer inflation leads wage inflation, when he points to weak wage growth and says “there’s no wage-push inflation.” Actually, your stockbroker sounds like a bit of an ass.
Summary of My Post-CPI Tweets (Mar 2018)
Below is a summary of my post-CPI tweets. You can (and should!) follow me @inflation_guyPV and get this in real time, by going to PremoSocial. Or, sign up for email updates to my occasional articles here. Investors with interests in this area be sure to stop by Enduring Investments or Enduring Intellectual Properties. Plus…buy my book about money and inflation. The title of the book is What’s Wrong with Money? The Biggest Bubble of All; order from Amazon here.
- OK, 15 minutes out from CPI. Exciting one after last month’s WTF print.
- Last month remember core CPI was +0.349% m/m, highest m/m in 12 years. 1.846% on y/y, so almost printing 0.4% and 1.9% which would have been emotionally challenging for the markets and Fed.
- For this month, 0.17% is rough consensus on core. For the economists. The Street is leaning short of that number. The story is that last month’s CPI was pulled higher by one-offs.
- But some of those things they think are one-offs, like Apparel, weren’t. They were reversing previous one-offs.
- Maybe some of them were, but I don’t see many. I think another 0.3% is unlikely but the market – both bonds and stocks – would react extremely poorly if we got it, even if it was just rounded up to 0.3%.
- Anything 0.18% and higher will cause y/y core to tick up to 1.9%. To go to 1.7% you’d need 0.07%. So bigger risk of an uptick.
- At some level this isn’t really a risk…it’s going to happen over next few months anyway. Mar-July 2017 was 0.9% annualized on core CPI.
- This month we’re watching apparel of course (+1.66% m/m last month). Also used cars & trucks, which everyone thinks is going down but I think is still going up.
- And medical care, which looks a little like it might be hooking higher but has a long way to go. Hospital services is one place we could see mean reversion. If I made point forecasts, I’d probably be roughly on consensus. But I don’t. I spend my time thinking about risks.
- …and while some of the risks to the consensus are lower, they’re already incorporating some mean reversion. Underlying pace of inflation is ~2.4% ex- the one-offs, so 0.17% is a bit below the ‘natural’ current run rate. And as I said the Street is leaning shorter than that.
- Anyway, we’ll find out in 10 minutes. Either way, I’m on the TD Ameritrade Network at 3:05 to talk about CPI. Also, if you missed it check out the Odd Lots podcast I’m featured on this week: http://www.podbean.com/media/share/dir-zinyp-3b109f4
- Going into the number, 10y Treasury yields are -1bp, Breakevens +0.25bp roughly, S&P futures +4.6.
- Well 0.18% on core m/m, and 1.857% on y/y. Those economists are goooood. But that’s above where traders were looking.
- Last 12 months. This does make the slope look less scary.

- Hey look! Another one-off on Apparel (tongue in cheek). +1.46% m/m. But that only pushes the y/y to 0.40%.
- Hey look! Another one-off in used cars and trucks, +0.89% m/m. But that only pushes the y/y to -0.1%. [Editor’s Note – see below for my mea culpa. This was NSA. Seasonally-adjusted it was actually down, though I have the y/y right.]

- But Primary Rents, which were +0.34% last month, only 0.20% this month. y/y to 3.64% from 3.73%. And OER 0.20% m/m (0.28% last m/m), and y/y falls to 3.15% from 3.20%. And those are big chunks. And those really ARE probably one-offs.
- I am less sure that medical care is a one-off…-0.11% this month vs +0.18% last month. y/y slips to 1.76% vs 1.98%. Pharma lower (2.06% vs 2.39% y/y), and yep! Hospital Services mean-reverted. 5.01% y/y vs 6.04% y/y.
- Also big weakness in recreation. +0.61% y/y vs +1.12% y/y. I’m going to want to drill deeper on that one.
- Core goods rose to -0.5% y/y vs -0.7%. Core services were steady at +2.6%. That rise in core goods is largely the result of apparel of course. But the fact core goods are still in deflation tells you how widespread the goods deflation is.
- Breakevens down slightly on this report, which seems odd to me. Stocks and bonds stronger. I don’t get the reaction…I guess investors outside of the Street were leaning towards a high miss? Always was nice as a bank trader to be wrong and still make money.
- …and there goes Tillerson, according to WaPo. That’s probably not related to CPI.
- FWIW, I said the y/y core CPI was 1.86%, which it was on a SA basis. But the NSA y/y was 1.847%, which is the reason the ‘official’ print didn’t go to 1.9%.
- Finally drilling down. in Recreation…Video and Audio I guess is the culprit. 1.47% vs 2.29%. Recreation is only 5.7% of CPI, I guess that’s probably not worth obsessing over.
- Lodging away from home, incidentally, was -1.51% vs -1.27%. prepare for more declarations of the “AirBnB effect.” Onle reason Housing rose, rather than falling on weak Rent and OER, was the jump in Household Energy.
- Just realize I didn’t show a chart of the Hospital Services mean reversion. I did warn you.


- Good segue. Here’s y/y for wireless telecom. Over the last 6 months, it’s actually flat. Because once you have infinity data, it’s hard to have more more quality improvement.
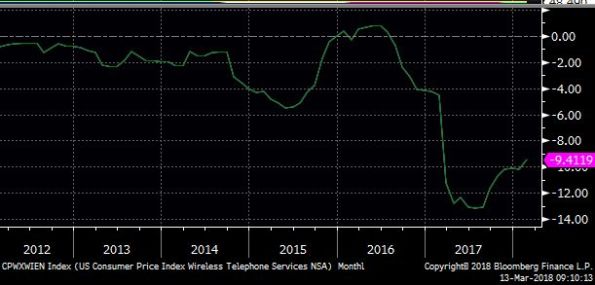
- Core ex-housing is 0.92%, highest in a year, and it’s going to bounce higher next month (again, cell phones).
- Still, core ex-shelter of 1.xx is nothing to be terrified about.
- Here’s a long-term view of Apparel (geez, I’m jumping around a lot). The two-month jump puts us basically flat for the last five years. I didn’t think we would get a reversal of last mo’s jump, but two in a row is a bit sporty. Might get some next month.

- I think if anyone says “used cars should reverse lower,” you can point out that NEW cars dove at an annualized 5.75% rate this month. That’s at least as likely to reverse higher as used are to reverse lower.
- NEW vehicles are at -1.47% y/y, the lowest since 2009. That’s weird.
- Biggest one-month jumps are in apparel, motor vehicle insurance, and leased cars and trucks. Which is interesting. Probably not worth reading into one month in automotive.
- Early guess at Median…is 0.17%, bringing y/y to 2.41% (lower than last mo). But again there’s a caveat in that I have a regional OER as the median category, and the Cleveland Fed seasonally adjusts those separately so I may (will) be off on that. But probably not a lot.

- You heard it here first! About three or four months ago…!
- I think the summary of this report is that…if you thought inflation is contained, and last month was just a normal data wobble, this report doesn’t change your mind. And if you thought last month was a harbinger, this report doesn’t change your mind.
- …and therefore, this shouldn’t change any minds at the Fed. They’re as hawkish or dovish now as they were before this report.
- For me the picture is the same – the dramatic acceleration we are seeing and will see in the y/y numbers make for ugly optics over the next 5 months. But the underlying fact is that inflation is accelerating, but fairly slowly so far.
- Oh, you know what…mea culpa on the used cars. I was looking at the NSA. The y/y is still higher, at -0.1% from -0.6%, but the m/m was actually down on a SA basis. My mistake.
- OK, four-pieces charts. Food & Energy:

- Core Goods – finally showing some reaction to the dollar’s decline? This is a key piece of the argument that inflation will head higher over the medium term…if it does, core goods can’t be stuck in deflation in nominal terms.

- What I meant by that last remark…they can deflate RELATIVELY, but if the general level of inflation is going higher in a sustainable way, it can’t be all housing.
- Piece 3…core services less ROS. This is going to go higher next month with cell phones. The key question is whether medical is going to mean revert. Again, an important part of the picture if core is going to go above 3% eventually.

- Rent of Shelter. This has returned to the uptrend line and I wouldn’t expect much additional weakness. The trend here is stable to higher.

- One final chart…the weight of categories inflating faster than 3%. The distribution is about half showing inflation >3%, and then about 10-15% of consumption is deflating. So draw whatever conclusion you want!

- That’s all for today. Thanks for tuning in!
After last month’s crazy print, this month’s CPI was much more ham-on-rye as they say. Declines in the big housing categories and a retracement in hospital services were counterbalanced by a rise in Apparel (which could be partly reversed). Also, cars and trucks were a drag on the m/m. The strange weakness in new cars is confounding, with the weakness in the dollar especially but also the hurricane effect. It’s probably a sign of overbuilding in that industry. Well, a tariff on steel ought to help reverse those price declines…
There’s nothing here that suggests the underlying story isn’t still the same: underlying inflation is slowly, and not dramatically, increasing. As the one-offs dissipate, the y/y figures will accelerate more dramatically and indeed the comps over the next five months virtually assure we’ll see core inflation around 2.4%-2.5% by summer. But that’s where inflation already is…it’s just the optics catching up.
And, as a result, there’s nothing here that changes the trajectory of Fed policy. I suppose this data will be taken as positive by equity investors, if they are in a good mood and inclined to take no-bad-news as good news. If they’re in a bad mood, they’ll tend to take no-good-news as bad news, of course, but right now they seem to be in a good mood!
Trump and Tariffs – Not a New Risk
Last week, the stock market dove in part because President Trump appeared to be plunging ahead with new tariffs; on Monday, the market recouped that loss (and then some) as the conventional wisdom over the weekend was that Congress would never let that happen and so it is unlikely that tariffs will be implemented.
I’m always fascinated by market behavior around events like this. Investors seem to love to guess right, and to put 100% of their bet on an outcome that depends on being right. Here’s what I know about tariffs – prior to last week, if there was a risk that tariffs would be implemented that risk was not priced into the markets. And markets are supposed to price risks. Regardless of what you think the probability of that outcome is, surely the probability is non-zero and, therefore, ought to be worth something on the price. Putting it another way: if I was willing to pay X for the market when I wasn’t worried about the possibility of the detrimental effect of future tariffs, then assuredly I will pay less than X once I start to consider that possibility. Although the outcome may be binary (there will be increasing tariffs and decreasing free trade, or there won’t be), the risk doesn’t have to be either/or.
This is one of the things that irritates me about the whole “risk on/risk off” meme. There is no such thing as “risk off.” Risk is ever-present, and an investor’s job is not to guess at which risks will actually present themselves, but to efficiently preserve as much upside as possible while protecting against downside risks cheaply. Risk management is really, really important, but it often seems to get overlooked in the ‘storytime’ that 24-hour market news depends on.
To be sure, the risk of tariffs coming out of the Trump Administration is not new…it’s just that it has been ignored completely until now. Right after Trump’s election, in our Quarterly Inflation Outlook I wrote about which elements of Trump’s professed plans were a risk to steady inflation. The one area which I felt could be the real wildcard leading to higher inflation as a result of policy (as opposed to higher inflation from natural dynamics, which are also a risk as interest rates normalize) was the possibility of a Trump tariff. Here is what I wrote at that time – and it’s poignant today:
Policies Which Will Erect Trade Barriers of Some Kind
This is the area in which we would be most concerned about the possible upward pressure on inflation from a Trump Administration. The President-Elect got to this point partly by pledging to “make better deals” with trading counterparties such as China, and to work to “bring jobs back” to the US. While this may be at least partly bluster, Mr. Trump was consistent enough during the campaign on this topic that it is hard to imagine him doing an about-face and strengthening NAFTA, rather than weakening it.
And here is why it matters. We have written in the past that a big part of the reason for the generous growth/inflation tradeoff of the 1990s was the rapid globalization of many industries following the end of the Cold War. Parameterizations of inflation models, in general, cannot be consistently calibrated on any period that spans 1992-1993. That is to say that for any model that we have seen, the parameters if the model is fit to 1972-1992 are different than if the model is fit to 1994-2014. Specifically, models calibrated to the former period consistently over-estimate inflation in the latter period, while models calibrated to the latter period consistently under-estimate inflation in the former period. The Federal Reserve believes that this is because inflation expectations (which we cannot measure very well) somehow became “anchored” in 1993. On the other hand, we believe that the culprit was globalization. In the 2014Q3 QIO, we illustrated that assertion with this chart of Apparel prices, set against domestic apparel production.
 The chart (Source Bloomberg) is updated to 2016. We think it illustrates clearly the inflation dividend brought by globalization – as production was moved to cheaper overseas manufacturers, apparel price increases first leveled off, and then actually declined. Prices continued to go sideways or down until apparel production in this country was essentially gone – and thus, there was no further gain in production costs to be passed on to consumers. In late 2012, apparel prices started to rise again, although it has still been only in fits and starts. (We think this is because manufacturing is being moved further downstream, to manufacturers located in even cheaper countries – but this can only go on for so long of course.)
What we haven’t been able to find before, until recently, is more general evidence that there was a dramatic shift in the globalization dynamic in general, rather than in this isolated case. We found the evidence recently in a Deutsche Bank piece, in a chart that plots the number of free trade agreements signed per year. The chart is printed below (sources: as cited).
 This chart is the “smoking gun” that supports our version of events, in terms of why the inflation dynamic shifted in the early 1990s. The apparel story is supporting evidence about the next step in the chain, illustrating how free trade helped to restrain prices in certain goods, by allowing the possibility of significant cost savings on production.
The flip side of a cost savings on production, though, is a loss of domestic manufacturing jobs; it is this loss that Mr. Trump took productive advantage of. We believe that Mr. Trump is likely to move to increase tariffs and other barriers to trade, and to reverse some of the globalization trend that has driven lower prices for the last quarter-century. We view this as potentially very negative news for inflation. While there was some evidence that the globalization dividend was beginning to get ‘tapped out’ as all of the low-hanging fruit had been harvested – and such a development would cause inflation to be higher than otherwise it would have been – we had not expected the possibility of a reversal of the globalization dividend except as a possible and minor side-effect of tensions with Russia over the Ukraine, or the effect the Syrian refugee problem could have on open borders. The election of Mr. Trump, however, creates the very real possibility that the reversal of this dividend might be a direct consequence of conscious policy choices.
The Fed’s Accidental Preoccupation with Housing
I have neglected to post here the links to recent TV appearances. Here’s one on TD Ameritrade network from February 12th; here’s one from Bloomberg TV on February 14th, the day of the shocking CPI.
I get asked frequently about Core PCE inflation. Because the Fed obsesses over Core PCE, as opposed to one of the many flavors of CPI (core, median, trimmed-mean, sticky-price), investors therefore obsess over it as well.
My usual response is that I don’t pay much attention to Core PCE, for several reasons. First, there are no market instruments that are remotely tied to PCE, so you can’t trade it (and, for the conspiracy-minded among you, that means there is no instrument whose market price can call shenanigans if the government figure is ‘massaged’). Second, while PCE is interesting and useful for some uses – it measures prices from a different perspective, mainly from the supplier-side of the equation so that, for example, it captures what Medicare pays for care as opposed to just what consumers pay – those aren’t my uses. Markets respond to inflation, and to perceptions of inflation, but what the government pays for healthcare isn’t something we perceive directly.
So, I care about PCE more than, say, PPI, but only just. The only reason I care about PCE is that the Fed cares about it.
Now, PCE differs from CPI in a couple of key ways – apart from the philosophical way mentioned above, that one measures the price of things businesses sell and one measures the price of things people buy. But those key ways are mostly interesting to pointy-head economists who are interested in calculating the third decimal point. Me, I’m just trying to get “higher” or “lower” correct. (Ironically, those folks who are interested in the third decimal point are the same folks who miss the big figure in front). So they wail at the following chart (source: Bloomberg), and moan about how the Fed has been unable to get inflation higher because of this persistent shortfall of PCE compared to CPI. Try harder!

The pocket-protector set can keep their ‘formula differences.’ There’s really only one important difference that has caused the gap between PCE and CPI over the last half-dozen years: the difference in the weight allocated to housing. In the PCE, “Rental of tenant-occupied nonfarm housing” and “Imputed rental of owner-occupied nonfarm housing” add up to about 16% of the overall PCE. In the CPI, “Rent of primary residence” and “Owners’ equivalent rent of residences,” the corresponding categories, sum to about 32% of overall CPI.
Housing is both the largest weight in CPI, as well as one of the most stable parts of CPI. So, when shelter costs are running ahead of “the rest of CPI”, then Core CPI tends to be above core PCE. I’m actually soft-pedaling that. Given how shelter inflation has been relatively elevated now for some time, it is far and away the most important difference in CPI and PCE. So much so that I can create the following chart in a couple of minutes: I merely took Core CPI and backed out half of the weight of housing inflation, and compare that to Core PCE.

Remarkably, making that simple, back-of-the-envelope adjustment puts core CPI right smack on top of core PCE.
The implication is that in choosing to focus on Core PCE, rather than Core CPI[1], the Fed is saying that housing is just not as important as it seems to consumers. Although you spend about a third of your money on shelter (about 40%, after we take out food and energy), the Fed is behaving as if that inflation only matters about half that much. I don’t think the central bankers are doing this on purpose; I think they believe that the PCE is a more-pure economic statistic that perhaps gives them a better read on ‘overall’ inflation. But in this case, they’re effectively biasing their monetary policy looser for one reason: because housing costs are already going up faster than overall inflation.
Now, to me that sounds like they’re biased the wrong way. But the academics will write a paper in five or ten years and explain why that’s wrong, even though it turned out badly.
[1] Median CPI is better yet, but let’s take baby steps.