Archive
Penalizing Apple Pay
Something odd happened to me several times over our Christmas holiday trip back home, and I’ve been mulling it ever since. It feels significant, albeit on a long-horizon time scale.
At least three times, restaurants added a ‘credit card surcharge’ to our check, or had a sign on the door warning customers of the same. The surcharge was small, on the order of what the credit card processors charge the restaurateur (1-2% of the bill), and was often framed that way.
Think about that for a moment. First of all, credit card fees haven’t changed meaningfully in a long time. Probably on balance they’ve risen, but it’s fractions of a percentage point. In the running of a restaurant, it is total rounding error.
Moreover, if the cost of processing credit cards had gone up, say, 1%, then it would be much better to simply raise prices 1%. Diners aren’t particularly resistant to small changes in prices, especially after 2021 broke the skin of the milk so to speak. Adding a surcharge to use a different payment method ticks the customers off, and I saw this a couple of times.
The number of patrons who are using credit cards has probably gone up a lot in recent years. I’ve noticed myself that I so rarely use cash that I sometimes forget my ATM PIN. Apple Pay and other proximity-payment methods make it so easy that carrying my whole wallet so that I can have physical cash seems silly. It has bitten me a couple of times when I wanted to tip someone, but that’s the only time it has made a difference. Almost no one takes only cash any more. We are not yet (in the US) a ‘cashless society,’ but ease of payment has pushed us pretty far in that direction. But still, that effect is simply not big enough to make much of a difference to the restaurateur – and if it was, then it would be simply solved by changing prices just a tiny bit. Your $15 entrée becomes a $15.15 entrée. No one is walking out over that.
When you see something that seems to make little sense economically, it usually means one of two things. (1) there’s some weird behavioral bias happening, or the problem is complex and confusing, so that people are making the non-optimal decision, or (2) people are behaving rationally; you just haven’t figured it out yet. The former point seems unlikely here. The problem is pretty simple, and the behavioral biases work the wrong direction – your customers get irrationally annoyed by a 1% surcharge, so all else equal you’d want to avoid that.
So I have been mulling #2, and I have a possible answer. Why would restaurateurs annoy their customers by adding a 1% surcharge to their checks, which can be easily avoided by paying cash? Obviously, it’s because they want to receive cash. Why annoy their customers over something so small that can be addressed another way? Because the actual cost to them is not as small as it appears.
When a business receives cash, or credit, there’s a small difference in the revenue received. Why does this matter to gas stations, which have applied a discount for cash for decades and not to a service business like a restaurant? Another difference between a restaurant and a gas station is that a gas station’s costs are almost entirely the cost of goods sold – gasoline – while for a restaurant the COGS is more like 25-40% of revenues. In what way does this increase the value of cash to a restaurateur?
The answer is simple – by operating part of the restaurant on a cash basis, a very significant cost can be reduced: taxes. A gas station would have a hard time pocketing cash and not declaring the revenue, because it would be quickly obvious when the tax man looked at the books. If you’re taking in less revenue than the actual cost of the gasoline, something’s fishy. But for a restaurant, that’s harder to establish especially if you pay some of the staff in cash.
The only way it makes sense to me that some restaurants would risk ticking off customers in order to push them towards cash in a very blatant way is if the cash revenue is worth much more than a 1-2% advantage over credit card revenue, and if the number of cash-paying patrons was changing meaningfully. The former has been true for a while, but as long as plenty of people still paid cash there was no reason to risk annoying customers. Only if cash as a payment form is decreasing meaningfully – and I would bet it is – would this make sense.
I’m open to other possibilities.
The reason this is interesting to me is that the driving force here is the desire to avoid metering of revenue. But the habits of the customer base aren’t the only reason this is changing. A sign at my bank warns that anyone who transacts in cash will be subject to extra questions and ID requirements. As government deficits stay wide and taxation rates rise, incidence of avoidance should be expected to go up.
Some people are aggrieved by the movement by central banks towards Central Bank Digital Currencies (CBDCs) because they fear that authorities could abuse having absolute power over the medium of exchange. That only works if it is the only medium of exchange. But the restaurant behavior suggest that moving entirely to a cashless society could also raise prices in some ways.[1] If people simply won’t pay with cash, prices will have to go up to cover the additional taxes that business owners will have to pay on the newly-recognized revenues. Incidentally, to the extent that a movement towards contactless payments (CBDC or no) moves commerce from the cash economy to the metered economy…growth will also appear artificially higher by a small amount and tax receipts will also be higher than would otherwise be expected.
Outside of restaurants, I don’t know how prevalent cash payments for services are. I know that it is a large part of home improvement and maintenance, and I know that car dealers vastly prefer cash. If it’s just 2% of the economy, then this is merely interesting. If it’s 5-10% of the economy, it’s also significant. I don’t know that in either case I can see a trade to be made, but it’s interesting.
What do you think?
[1] Hey, I have to tie this back to inflation somehow.
Beware the Hook
The bungee jumper doesn’t just bounce once.
Stated in a more high-falutin’ way, perturbed systems normally don’t converge straight back to equilibrium.
Obviously, the 2020-2021 COVID-triggered episode took the form of a severe shock to the system. The initial shock (to relitigate the familiar story for the thousandth time) was the panicky global shutdown initiated due to a fear of the unknown parameters of the virus. The counter-shock was the massive fiscal and monetary response to that shutdown. Almost all of the inflation-related problems we have had since then can be traced back to the fact that the initial shock lasted 6-9 months while the counter-shock lasted multiple years. “Can you give me a little push, Daddy?” says the child on the swing. “Sure,” says Dad, who then launches Junior screaming into orbit with a mighty shove.
It doesn’t matter if Daddy stops pushing; it’ll take a while for Junior’s oscillations to get back to zero. (The therapy sessions will last for years.) And so it is with the economy.[1] Positive momentum succumbs to gravity, which induces negative momentum, which succumbs to gravity again on the other side of the zero mark.
The Fed’s massive push shows up in the following chart (source: Bloomberg); highlighted in blue (left scale) is the sharp rise in M2 from 2020-2022. This surge – which indirectly financed the direct Federal stimulus payments – was meant to offset the various contractionary forces caused by forced idleness among the ‘non-essential’ workforce, such as the 140bln contraction in revolving consumer credit (in black, right scale).

So far, so good, although you can see that the M2 explosion lasted far longer than the damage to consumer credit and most other growth and liquidity metrics. The Fed adroitly (if belatedly) began to shrink its balance sheet slowly, leaning against the continued recovery in private markets. Inflation began to subside, and although it has happened more slowly than everyone would like it is going to continue a while further as rents gradually recede to a 3-4% rate of increase.
That does not, though, get the inflation rate to smoothly converge on the target even though that seems to be the forecast of a great majority of the economists out there who are employed in fancy glass and steel buildings by fancy institutions. Indeed, we are starting to see signs of a ‘hook’ higher in certain metrics that could presage a second wave of upside surprises in inflation. The system overcorrects: the latest news from Black Friday and Cyber Monday that sales were stronger than expected driven partly by increased popularity of ‘buy now pay later’ plans[2] is something that we perhaps should have expected. And so the combination of slow-but-constant balance-sheet shrinkage at the Fed and faster credit growth is helping to produce a gentle hook higher in money growth.

To be clear, I do not expect this ‘hook’ to produce a new high in the inflation rate, and any increase is probably not even to be enough to trigger further Fed tightening from here. But it should keep the Fed sternly standing off to the side, hands on hips, with a gaze which says plainly “stop playing on that swing. You have chores.”
The point is…and I guess this goes back to some extent to my observation back in July that the volatility of inflation is a tell that the oscillations still have a ways to go before dampening back to equilibrium…that this hook is evident in lots of measures. Recently, it has been pointed out that the year-ahead inflation expectations measure in the University of Michigan consumer sentiment survey has leapt higher despite declining gasoline prices (see chart), as consumers react negatively to the disconnect between politicians saying that prices are declining and their perceptions that prices are still increasing (even if inflation is declining).

And, since the Case-Shiller numbers were out today, I’d be remiss if I didn’t point out that y/y home prices are rising again in sharp contrast to where public forecasts of rents, home prices, and housing futures have been mooted.

The reason this matters is that it seems like the investing universe is all-in on the idea that not only has inflation crested, but it is heading right back down placidly to target. The bungee-jumper’s bounce is distinctly out-of-consensus, and it could scare some people if it is perceived as a new wave, rather than as a bounce. The housing market re-acceleration, in particular, could start to get some attention and some observers might think that means the Fed needs to hike interest rates further. The reality here isn’t as important as the inflection in the narrative. Beware the hook.
[1] Fortunately, I am an inflation therapist with a very reasonable hourly rate although I do not accept most insurance.
[2] AKA “I’ll gladly pay you Tuesday for a hamburger today.”
Inflation Volatility Tells Us This is Probably Not Over
In the course of this inflation cycle – and I do think this is a cycle, and not necessarily a one-off, although the subsequent peaks may not surpass this year’s peak in Median CPI for some years – the typical topic has of course been the level of inflation, and/or its acceleration or deceleration (not to mention, many uneducated suppositions about the cause, which we know good and well boils down to profligate spending and unprecedented provision of money). I’ve also written and talked about the oft-overlooked fact that when inflation rises for some time above about 2.5%-3%, stocks and bonds become correlated rather than inversely correlated, and this has a significant effect on portfolio risk that insightful investment managers will take into account.
What I haven’t written about much is the fact that problems are also caused by the volatility of inflation. While this tends to go hand-in-hand with higher inflation, the problems caused by inflation’s volatility are somewhat different than those caused by its level.

The current episode follows a 15-year period during which inflation was both low and stable. The thirty years prior to that, from 1973-2003, the level of inflation was a bit more than twice the 2004-2018 period average but the volatility of inflation was tripled.
The importance of inflation volatility is that it operates on inflation expectations in a very different way than the inflation level does. (We know that inflation expectations do not have the center-stage role in ‘anchoring inflation’ that previously-discredited theory claimed it did, but I do think there is a psychological tendency that adds some inertia to inflation by affecting businesses’ beliefs about how easy it will be to increase prices.) Inflation volatility tends to increase consumers’ perceptions of inflation through the behavioral tendencies towards loss aversion and attribution bias (as I argued in a 2012 paper published in Business Economics). But it has other effects as well.
Quantitatively, higher variance makes it harder to reject the null hypothesis that inflation is staying high; an uncertain worker is therefore less likely to accept a lower wage that may not suffice and a business is less likely to hold the line on prices that may be continuing to rise elsewhere. When you don’t know the true competitive pricing situation, both businesses and their employees are likely to err on the conservative side. This also gives momentum to inflation.
Higher inflation volatility is what causes the inflation factor to carry more weight in the minds of consumers and investors, which in turn is what induces the aforementioned positive correlation between stocks and bonds. When inflation is low (but more importantly stable), the importance of inflation to investors is also low and variations in inflation are given less weight than variations in growth. Since stocks and bonds behave similarly with respect to inflation, but inversely with respect to economic growth, the dampening of the inflation factor is the reason that stocks and bonds are inversely-correlated in low-and-stable inflation regimes.
Also, although investors seem not to incorporate this understanding into prices, higher inflation volatility should increase the value of a “tail outcome” in inflation, and increase the value of holding that option by being long breakevens, or long TIPS instead of nominal bonds. That is, when inflation isn’t going to vary too much then it’s hard to win big by owning TIPS over nominals; but if inflation varies a lot then there should be a fairly large premium built into breakevens since you’d much rather be long them (and long that tail) than short them (and short the tail). However, as I said this seems not to actually be incorporated in inflation markets, which trade far below the level they ought to if inflation tails have even a small value.
So, how volatile has inflation been?
When I started thinking about this blog post I was originally going to point out that the volatility of Used Car CPI is so much higher than it used to be. We almost never spent a lot of time thinking about how much Used Cars would add or subtract from core. Here is a chart of the rolling 12-month volatility of y/y Used Cars CPI.

Not surprisingly, the volatility of CPI for Used Cars and Trucks reached nearly double the level it did in the aftermath of the Global Financial Crisis, when the “cash for clunkers” program and the destruction wrought by Hurricane Katrina both had major impacts on the market for used cars. But it goes beyond that.
The unusual volatility of the food and beverages group, partly as a result of the war in Ukraine and the spikes in fertilizer prices, has been documented previously. It seems to be receding but remains quite high historically.

Heck, let’s look at three of my ‘Four Pieces’ (leaving aside energy). Here’s Core Goods.

Even though the level of core goods inflation has come way back down, the volatility of core goods means that consumers can’t get terribly comfortable with prices (nor can producers).
How about ‘supercore’?

This is also high, but the interesting part is how tame it had been for most of the post-GFC period. Remembering that this is the category where the wage-price feedback loop is felt most strongly, I think this says something about the flaccidity of labor power during that decade. Well, that’s back – and perhaps we’ve re-entered an extended period of volatility in that group?
Here is the volatility of Owners’ Equivalent Rent (which looks about the same as Primary Rents, for what it’s worth, so I didn’t feel I needed to show them both).

Not as terrible as I would have thought, although to be fair this is typically a less-volatile category anyway. Again, though, look at the amazingly boring period post-GFC. (As an aside, that’s when a certain inflation specialist was trying to get attention for Enduring Investments.)
In a second I’ll show all-items CPI, but first let’s look at Medical Care.

This is the only category of the ones I’ve shown where volatility is still increasing. That’s largely because of Health Insurance, which as I’ve documented/complained about for some time has endured one of the most massive swings in any imputed category. That will not plummet soon, though, since in October the Health Insurance drag of -4% or so annualized will reverse to +1% or so.
Last but not least, here is headline CPI’s volatility.

I will just say that it is a good thing that inflation dealers no longer really trade inflation options. Because, if they did, they not only would be generally short a whole lot of in-the-money inflation cap delta in the book but also would be short a bunch of vega too and implied vol would probably be a lot higher. But the importance of this picture is that while headline inflation has been receding (largely due to energy) and core inflation has been dropping too (not-insignificantly due to Health Insurance and Used Cars), the volatility of inflation does not yet look like it’s calming down in a decisive way.
Until it does, I think it would be cavalier to assume that we are heading back to the low-and-stable inflation regime, even if the last few months’ out-turns for CPI have been agreeable. Volatility, and not just the level of inflation, matters.
The Political Temptation Posed by “Price Gouging”
The arc of explanations about the rise in inflation and the end of the disinflationary era was foreordained:
- There’s no inflation.
- What you’re calling inflation is just a series of one-offs.
- This is just a ‘transitory’ phenomenon, a one-off at the broad economy level, and will soon fade.
- “It’s actually okay.” (NY Times: Inflation Could Stay High Next Year, and That’s OK)
- It’s greedy manufacturers and vendors that are price-gouging. Where is my pitchfork?
In the current arc, we are already easing past level 3, as “transitory” is starting to be stretched a bit to “well, not past 2022” (Former Fed Chair Ben Bernanke opined yesterday at an online event that inflation would “moderate” in 2022). And we’ve seen signs of #4, and even some #5. The blame game is heating up, and with an Administration under pressure for its handling of…well, everything…I suspect we will move sooner rather than later into the full-blown level 5, complete with price controls in some industries and possibly economy-wide. Yes, there’s a very clear lesson from history that price controls don’t work to restrain inflation, but (a) today’s politicians don’t seem to really know much history, and (b) price controls need not be about restraining inflation – for some, it’s worth the political points.
Since it’s a term we will hear more of, I thought I’d try and put a little more structure around the accusation of “price gouging.” It is an easy term to throw around, but what does it mean?
Developed economies are still mostly free markets, in that buyers and sellers are given wide latitude to negotiate on price and quantity. In certain markets, where there are limitations on competition (electric utilities being a classic example) or vast differences in negotiating power or information (health insurance?) there are limits on the terms of trade but for the most part, if you want to buy an apple from the apple vendor you can strike whatever deal suits you both. In a free market, either the buyer or the seller can choose not to transact at the proffered price; ergo, economists assume that if a transaction occurs then both buyer and seller made themselves better off or at least not worse off. Unlike many economist assumptions, this one doesn’t seem like a bad one, at least in most cases.
If the price is “too high” for the buyer, then the buyer can complain but the buyer can always choose to not transact. So there’s only two senses in which “price gouging” might mean something:
- The price is egregiously high because the seller knows you really have no alternative, as the buyer, other than to buy. If there is a mandate to buy insurance or lose your liberty, but no cap on the price of insurance, then the insurance provider can charge any price it wants. This is infrequent. Arguably, in the aftermath of hurricanes it might apply to building materials, but even in that case I would argue #2 below is a more-accurate sense of the word.
- The price is, in some sense, “unfair.”
What is “unfair?” We do, as social animals, have some innate sense of fairness. A classic result from “the ultimatum game,” where one person is endowed with money that he/she chooses unilaterally how to split with a second person who can in turn accept the split or reject it (in which case both parties get nothing) is that under experimental conditions splits that are worse than 70:30 tend to be rejected by the responding party – in other words, the respondent would rather get zero than 30%, if it feels “unfair.” It is in that context that “price-gouging” accusations could be related to “anchored” inflation expectations. If a vendor is charging a very high price, but the buyer expects price changes to be large, volatile, and generally not in the buyer’s favor, then an accusation of “price gouging” is less likely than if the buyer expects price changes to be low and random. So, it might be that accusations of price gouging simply means that the buyers have not adjusted to a new inflation/pricing paradigm, and perceive the price increases as unfair even if they are objectively fair.
If that’s the case, then the buyer is going to lose in cases where the higher prices are a result of changes in the supply/demand balance. Higher prices are how limited supply gets rationed among the buyers – it is a feature, not a bug, of the capitalist system. In the case where a surge in demand (caused by, say, massive government transfers to consumers) causes stock-outs and rising prices, then accusations of price gouging are just sour grapes. Rising prices in this case are simply normal inflation happening in an environment that has not adapted to normal inflation again. (Listen to the Inflation Guy Podcast, episode 2, where I point out that “supply chain problems” is exactly what inflation caused by too much money looks like.)
Nevertheless, where the “price gouging” accusation is code for “this feels unfair,” it is a terrific opportunity for a political lever. Politicians will feel that they can make people happy by instituting price controls, and blaming the wealthy industrialist, even though economics and history tell us that this isn’t the right answer. But it is a siren song, and I think that we are very likely to start hearing this more and more.
Once price controls are instituted, what follows is that the stock market craters (since the difference between input costs and consumer prices is some part profit), a black market develops in the restricted goods and services, and many products get impossible to acquire or rationed by a lengthening waitlist rather than by price.
Can you really control prices in the Internet age? It hardly matters. Politicians don’t really care about controlling prices after all; they merely want to appear as if they’re on the side of the voters. Bashing suppliers is one easy way to do that. I don’t think it will be long now. Keep the torches and pitchforks at the ready.
Money Illusion and Boiling Frogs
“Twice a day we are all forced to await the quotation of the Zurich bourse. Every fresh drop in its value [of Austrian kronen to Swiss franc) is followed by a wave of rising prices … The confidence of Austrian citizens in the currency administration of the State is shaken to its foundation. The State which is perpetually printing new banknotes deceives us with the face value … A housewife who has had no experience of the horrors of currency depreciation has no idea what a blessing stable money is, and how glorious it is to be able to buy with the note in one’s purse the article one had intended to buy at the price one had intended to pay.” – account of Frau Eisenmenger, recounted in When Money Dies (Adam Fergusson).
“Speculation on the stock exchange has spread to all ranks of the population and shares rise like air balloons to limitless heights … My banker congratulates me on every new rise, but he does not dispel the secret uneasiness which my growing wealth arouses in me … it already amounts to millions.” – Ibid.
These two passages come from the contemporaneous observations of an Austrian living through the early stages of the hyperinflation that followed WWI in that country. I don’t for a minute mean to suggest that the global economies are on the verge of hyperinflation, but I present these as an apt illustration of a concept called money illusion. In the first passage, the writer makes plain that the kronen is buying less and less, in terms of real goods, every day. Similarly, it buys less and less in terms of equity shares. The former, we tend to regard as a negative, and the latter as a positive, even though they are both related in this case to the same phenomenon: the unit of measurement is losing its value, so that it buys less real stuff as time passes. Isn’t that interesting? For someone who is continually investing in the equity market – I’m looking at you, millennials – higher prices should strike us as a bad thing just as higher car prices strike us as a bad thing.
I don’t mention that, though, to suggest that equities are a great place to hide out from inflation. In fact, they’re a pretty lousy place: as inflation rises the multiple paid on earnings declines so that even if nominal earnings are rising with inflation equity market prices can’t keep up. That’s not as bad as holding paper money and watching it go to zero, but it ends up being about the same when the inflation gets serious enough that the market itself collapses – as it did in each example of monetary hyperinflation (Germany, Austria, Zimbabwe, etc) that we have seen to date. But again, it isn’t my purpose today to warn about the dangers of treating equities like real assets when multiples are at nosebleed highs.
The interesting part is the money illusion. The writer in the passages above is uneasy, because while she is making millions she understands that those millions are losing value almost as fast (and ultimately, faster) than she can make them. But for a while the higher and higher prints of the market, the rising value of one’s home, and the accelerating increase in wages makes people feel wealthier. And wealthier people are happier and tend to spend more of the marginal wealth, when that wealth is real. But in this case the wealth is an illusion, because that additional wealth buys (at best) the same amount it did previously.
In classical economics, we would call spending more in this circumstance – despite having a similar claim to wealth in real terms – irrational. Although we use dollars to translate our labor into the things we want to buy, we all understand that we are really trading our labor for those things – it’s just that we need a medium of exchange because no one wants to directly exchange groceries for inflation-focused asset management services. More’s the pity. So homo economicus would regard his increasing millions in the market and not feel any wealthier as he knows the units of account are growing weaker. The money dropped into his bank account through a universal direct stimulus also wouldn’t be treated as actual wealth, since if we handed everyone a trillion dollars then obviously we all wouldn’t be living like trillionaires because the people who sell goods and services would adjust their prices (if they did not, then those vendors are voluntarily decreasing their own claim to the real wealth, by accepting smaller real payments in return for the same amount of goods). Wealth is just a claim on the national product. If everybody’s nominal wealth rises, but the nation is not able to produce more units of real output, then in aggregate we clearly are not wealthier because the pie is the same size. (Now, if you hand everyone a trillion dollars except for one guy, then that guy is poorer and everyone else slightly richer. Ergo, direct cash payments to the poor are clearly a way to distribute actual wealth, especially if those who don’t receive those payments also face higher taxes. So fiscal policy here definitely shuffles the deck of the wealthy. It just doesn’t make us wealthier in aggregate.)
The question of how people behave when they see additional income that comes from a greater money supply, rather than from additional productivity/output, is crucially important in monetarism. In the quantity equation of exchange, MV≡PQ, an increase in the quantity of money and in the velocity of money (MV), which is the total nominal amount of expenditures, necessarily equals the real output times the price level of that output (PQ). The amount that is spent equals the amount that is bought. But how the right side divides between P and Q is very, very important. If there is no money illusion, then an increase in the quantity of money will primarily increase prices while output will remain stable. Shopkeepers are unwilling to part with their wares for a smaller piece of the pie in real terms. On the other hand, if money illusion is rife then producers respond to consumers flush with cash by providing as many goods and services as they can; they view the masses as having more actual wealth to spend and so output increases and prices don’t rise as much.
Unfortunately, it seems that money illusion operates primarily when the quantities involved are small, or narrowly distributed. When incremental money creation is widely distributed and significant in size, then (as the second quote at the start of this article suggests) consumers, suppliers, and investors eventually figure it out. When that happens, a change in M is almost fully reflected in a change in P, as over time it usually is anyway. So the secret of recovering from a negative economic shock by expansionary monetary policy is to boil the frog slowly.
No one involved in current policy circles is interested in boiling the frog slowly. And that means it’s not going to end well.
In this context, the current bubbly stock market looks decidedly better. The chart below shows the S&P 500 divided by M2 (and multiplied by 100 because sometimes I don’t like looking at decimals on my y-axis). Now, the S&P 500 level isn’t the purest look at the total value of the equity market, but you get the general idea here – stocks have outrun the growth rate in the money supply, even over the last year, but the new records we are hitting are mostly on money vapor.

Summary of My Post-CPI Tweets (January 2021)
Below is a summary of my post-CPI tweets. You can (and should!) follow me @inflation_guy. Or, sign up for email updates to my occasional articles here. Investors, issuers and risk managers with interests in this area be sure to stop by Enduring Investments!
- Welcome to #CPI Day 2021! We get the last of 2020’s CPI figures today.
- There’s always volatility in year-end figures, and this one is no exception. Last month, in fact, was pretty weird. In the Nov CPI we had soft housing, very strong Apparel. Broad softness sprinkled with some large moves in small categories. My write-up: Summary of My Post-CPI Tweets (December 2020)
- As a result, while core CPI was higher-than-expected, Median inflation (which is a steadier measure) was soft. However, skewness on the upside is DIFFERENT from the way we’ve seen it for a while and I’ll be interested to see if that remains.
- Economists’ consensus is that Core is gonna soften – the m/m core CPI consensus is around 0.12%. I think that’s mostly a call on rents, which have been softening.
- But here’s the thing – rents haven’t really been softening much outside of big cities. What has been changing is that landlords have been expecting less rent due to financially-stressed tenants. This shows up in CPI as softening average rent growth.
- And that could change, although probably not until next month. Payments looked soft in December. But rent tracker indices have payments a bit better this month, and they should be: there was just another Federal money drop.
- Next month or two, we should see a rebound in rents. And in the long run, we definitely will because home prices are jumping and these two can’t diverge forever.
- Away from Shelter, dislocations in the supply chain remain and part of the trick over the next 6 months is going to be teasing out the COVID effects from the long-term effects. Freight costs have risen steeply and there are goods shortages in places b/c of container shortages!
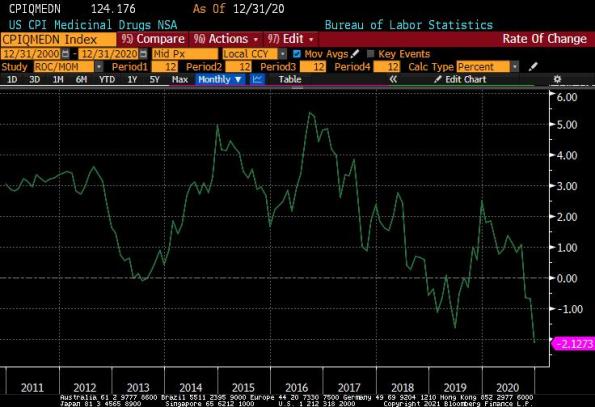
- Another category I’m watching that has been weak for a while: Medicinal Drugs. Interestingly, this month (again, probably starts to hit Jan CPI when it is released next month) some major pharma manufacturers announced price increases.
- Not a huge surprise: pharma prices had been suppressed when President Trump was threatening to introduce Most Favored Nation rules (saying companies can’t charge Americans more than other countries). Pharma played nice. CPI-Medicinal Drugs is negative y/y!
- I wrote about that here: Drug Prices and Most-Favored-Nation Clauses: Considerations back in August. But the Biden Administration won’t be doing that. Ergo, it’s safe to raise prices again. And they have. We’ll see how much – starting next month.
- That’s all for the walk-up. Expect volatility! I will probably focus on the ex-shelter number. BTW, be aware that monthly comps get super easy after this month, for a few months. Core CPI will be over 2.5% y/y, probably, by April & push 3% in May. Then the comps get much harder.
- Do remember, as I constantly remind: the #Fed doesn’t care one bit about inflation. But if YOU do, and have interests in how to hedge/invest in the inflationary period approaching, visit https://enduringinvestments.com
- And one more note: I will be on Bloomberg TV with @adsteel and @GuyJohnsonTV at 10:10ET this morning. And my interview with @MetreSteven on @RealVision just dropped this morning. A lot happening in inflation today!! Good luck…
- Core CPI was +0.09%, a touch softer than expected. Y/Y at 1.62%.

- Seems like Dec is always weak…even accounting for the seasonals! Let’s see. Primary rents rose 0.10%, y/y declined further to 2.28% from 2.45%. As I said, that will start changing soon. OER was +0.14%, y/y down to 2.17% from 2.28%.
- Apparel took another big jump, +1.36% m/m. That’s part of the general strength in core goods. Core goods at 1.7% y/y, up from 1% just three months ago!
- Check THIS out. Core goods inflation above core services inflation for the first time in years. Since the GFC, actually. A lot of that is supply chain folks. But a lot of it is people buying products with government money drops.

- That rise in core goods happened even with CPI-Used Cars and Trucks -1.15% on the month, second weak month in a row. Looks like the used car prices in the CPI aren’t going to catch up with the private surveys on the upside, as they didn’t on the downside.

- Airfares slipped -2.29% after +3.49% last month. Lodging Away from Home flat vs +3.93% last month. Motor Vehicle Insurance though continued to rebound, +1.42% after +1.23% last month. Those are my main “covid categories.”
- In Medical Care, which was down for the second month in a row: Medicinal Drugs -0.24% (y/y down to -2.13%!), Doctors’ Services -0.02% (y/y to 1.74%), Hospital Services +0.30% (y/y 2.99%).
- I’ve said it before and I’ll say it again. It’s hard to measure medical care, but these are just silly numbers. I doubt doctors are charging less when their costs have gone up enormously. But perhaps they’re charging CONSUMERS less, and we’re measuring consumer prices? Hmm.
- CPI for Medicinal Drugs, y/y. Come on, man.
- Core inflation ex-shelter was roughly unchanged this month, +1.45% y/y. Was +1.46% last month. It hasn’t been much higher than 1.7% since 2012.
- So only two categories had large negative changes: Car and Truck Rental, -49.9% annualized, and Used Cars and Trucks, -12.96%. The latter coming down from a high level. But long list of >10% gainers again:
- >10% annualized: Jewelry and Watches (39.5%), Men’s/Boys Apparel (+31.8%), Women’s/Girls Apparel (+18.3%), Car Insurance (+17.9%), Misc Personal Goods (+15.5%), Personal Care Goods (+12.9%), Tobacco/smoking (+12.9%), Misc Personal Svcs (+10.8%).
- Those are just non-food and energy. Also >10% annualized increases in Dairy, Nonalcoholic Beverages, Fuel Oil, and Motor Fuel. But we know those are volatile. I include them in case anyone says “the government ignores milk.”
- Anyway, Median should be soft again but not as soft as core this month. Median category will be a housing regional so it’s just a guess but I’m saying +0.13% m/m, 2.23% y/y. Core will actually pass over Median in a few months, I think, due to base effects.
- College Tuition and Fees: +0.74% y/y vs +0.58%. I’ve talked elsewhere about how there’s a quality change here that the BLS knows about but is ignoring for now b/c should reverse: online college ain’t same as in-person college.
- University costs themselves are up a lot. Talked at length to a university CFO consultant yesterday and they believe many of these costs will remain BUT there are some really interesting applications of virtual education that I can’t fit in here. 🙂
- Circling back, just want to put the Apparel jump into context. Here is the Apparel price level index. So acceleration in 2011 (after years of nothing), slow deflation, crash into COVID, and just recovering some pricing power. Will be interesting to see how far it extends.

- Update to our OER model. And honestly, everyone’s model looks something like this – lagged effect of home price rises is a big contributor, as are incomes, to where rents should go. But we’re looking at measured rents ADJUSTED for non-collection. That’s the key.

- Here’s a fun one. 10-year inflation swaps are about to cross above current median inflation. That hasn’t happened in a long time. You would think the forward should be above, at least because tails tend to be to the upside, but they almost never are. At least, recently.

- Distribution of y/y price changes by bottom-level category. Big spike is OER of course. But a really wide dispersion otherwise. Chaos.

- Four-Pieces charts and then I’ll wrap up. Piece 1: Food & Energy.

- Piece 2: Core Goods. Wheee! Honestly this overshoots our models so I think at least some of it are dislocations. But some of it is real, too much money pushing too few goods. And some is the recently-weak USD, so if you get a much stronger dollar (@MetreSteven) it could change.

- Piece 3: Core Services less Rent of Shelter. This is the conundrum. I can’t imagine doctors services and hospital services stay depressed in this world. Other services may (office cleaning if there are no offices), but that’s also a consumption basket change. Stay tuned here.

- Piece 4, Rent of Shelter. I think this will start to reverse as early as next month when the next gov’t checks go out. And the Biden Administration promises more. So delinquencies should decline, raising measured rents.

- And that’s all for today. I’ll post a summary of these tweets in a bit. Remember to look up my interview on @RealVision, tune in to @BloombergTV at 10:10 to see me there, and visit http://EnduringInvestments.com if you need an inflation nerd!
Recent inflation prints have been held down by soft rents, and that continued this month. A lot of this is artificial: when landlords expect to collect less rent…which is not unreasonable during a recession…then this shows up as a decline in collected rents. But when/if those renters get more current, it shows up as a reacceleration in rents. That’s what I expect will happen, and it could happen soon since more Federal largesse is on its way. It’s an upside risk for the next few months. Although, in another sense, it isn’t really a risk: it’s what we should be expecting to see, given what is happening in home prices.
Rents are the main part of core services inflation. Because of the softness in rents and the softness in medical care services – which is a real head-scratcher – core services inflation fell below core goods inflation this month for the first time in a very long time. Now, normally you don’t see goods inflation in the middle of a recession, but then again normally Washington DC isn’t throwing thousands of dollars into the account of every family. Too much money: check. And supply chains are stressed. Too few goods: check. No surprise we’re seeing goods inflation.
So really, the wiggles in inflation we have seen over the last year are not particularly surprising in themselves, and it’s easy to explain them by falling back on the excuse du jour: “COVID.” Certainly, a lot of the chaotic pricing environment is due to Covid and the related disruption in our economic system. But the question is, what will happen on the other side? We have had massive money growth, with declining velocity until last quarter. Will velocity continue to decline? I am skeptical of that. Precautionary cash balances are higher than they ought to be, given where rates are, because people are nervous and when you are nervous you keep more in reserve. But this won’t be true forever. And we know that, behaviorally, the velocity of “found money”/windfalls is higher than the velocity of earned money, and moreover people are less price-sensitive when they spend a windfall. So I expect that as things go back to normal, inflation will rise – and probably a lot.
This is the test! Modern Monetary Theory holds you can print all you want, with no consequences, subject to certain not-really-binding constraints. The last person who offered me free wealth with no risk was a Nigerian prince, and I didn’t believe him either. I will say though that if MMT works, then we’ve been doing monetary policy wrong for a hundred years (but then, we also leached people to cure them, for hundreds of years) and all of our historical explanations are wrong – and someone will have to explain why in the past, the price level always followed the GDP-adjusted money supply.
Now, over the next four or five months it will be much easier to believe the inflation story. While core inflation was +0.24% last January and +0.22% last February, it was -0.10% in March, -0.45% in April, and -0.06% in May. By mid-year, that is, we will be around 2.8% core CPI y/y (if we just get 0.2% per month) before the comps turn much more difficult. Even though this is fully known, and even though it will therefore be a violation of the Efficient Markets Hypothesis, it will not stop people from becoming alarmed and for the markets to respond accordingly! So buckle in – at the very least, the first half of 2021 will be extraordinarily interesting.
The Flip Side of Financialization of Commodities
Recently, a paper by Ilia Bouchouev (“From risk bearing to propheteering”) was published that had some very thought-provoking analysis. The paper traced the development of the use of futures and concluded that while futures markets in the past (specifically, he was considering energy markets but notes the idea started with agricultural commodities) tended towards backwardation – in which contracts for distant delivery dates trade at lower prices than those for nearer delivery dates – this is no longer as true. While others have noticed that futures markets do not seem to provide as much ‘roll return’ as in the past, Mr. Bouchouev suggested that this is not a random occurrence but rather a consequence of financialization. (My discussion of his fairly brief paper will not really do it justice – so go and read the original from the Journal of Quantitative Finance here).
Let me first take a step backward and explain why commodities markets tend towards backwardation, at least in theory. The idea is that a producer of a commodity, such as a farmer growing corn, has an affirmative need to hedge his future production to ensure that his realized product price adequately compensates him for producing the commodity in the first place. If it costs a farmer $3 per bushel to grow corn, and he expects to sell it for $5 per bushel, then he will plant a crop. But if prices subsequently fall to $2 per bushel, he has lost money. Accordingly, it behooves him when planting to hedge against a decline in corn prices by selling futures, locking in his margin. The farmer is willing to do this at a price that is lower than his true expectation, and possibly lower than the current spot price (although, technical note: Keynes’ ‘Theory of Normal Backwardation’ refers to the difference between his expected forward price and the price at which he is willing to sell futures, so that futures prices are expected to be downwardly biased forecasts of prices in the future, and not that they are expected to be actually lower than spot ‘normally’). He is willing to do this in order to induce speculators to take the other side of the trade; they will do so because they expect, on average, to realize a gain by buying futures and selling in the future spot market at a higher price.
Unfortunately, no one has ever been able to convincingly prove normal backwardation for individual commodities, because there is no way to get into the collective mind of market participants to know what they really expect the spot price to be in the future. Some evidence has been found (Till 2000) that a risk premium may exist for difficult-to-store commodities (agricultural commodities, for example), where we may expect producers to be the most interested in locking in an appropriate profit, but on the whole the evidence has been somewhat weak that futures are biased estimators of forward prices. In my view, that’s at least partly because the consumer of the product (say, Nabisco) also has a reason to hedge their future purchases of the good, so it isn’t a one-sided affair. That being said, owners of long futures positions have several other sources of return that are significant and persistent,[1] and so commodity futures indices over a long period of time have had returns and risks that are similar to those found in equity indices but deriving from very different sources. As a consequence, since the mid-2000s institutional investment into commodity indices has been significant compared to the prior level of interest, even as actual commodity returns have disappointed over the last 5-10 years. Which brings us back to Mr. Bouchouev’s story again.
He makes the provocative point that part of the reason commodity returns have been poorer in recent years is because markets have tended more toward contango (higher prices for distant contracts than for those nearer to expiry) than backwardation, and moreover that that is a consequence of the arrival of these institutional investors – the ‘financialization’ of commodities futures markets, in other words. After all, if Keynes was right and the tendency of anxious producers to be more aggressive than patient speculators caused futures to be downwardly biased, then it stands to reason that introducing more price-insensitive, institutional long-only buyers into the equation might tilt that scale in the other direction. His argument is appealing, and I think he may be right although as I said, commodities are still an important asset class – it’s just that the sources of returns has changed over time. (Right now, for what it’s worth, I think the potential return to spot commodities themselves, which are ordinarily a negative, are presently a strong positive given how badly beaten-down they have become over time).
All of that prelude, though, is to point out a wonderful corollary. If it is the case that futures prices are no longer biased lower by as much as they once were, then it means that hedgers are now getting the benefit of markets where they don’t have to surrender as much expectation to hedge. That is, where an oil producer might in the past have had to commit to selling next year’s oil $1 lower than where he expected to be able to sell it if he took the risk and waited, he may now be able to sell it $1 higher thanks to those institutions who are buying long-only indices.
And that, in turn, will likely lead to futures curves being extended further into the future (or, equivalently, the effective liquidity for existing markets will be extended further out). For example, over the last decade there have been several new commodities indices that systematically buy further out the curve to reduce the cost of contango. In doing so, they’re pushing the contango further out, and also providing bids for hedgers to be able to better sell against. So Mr. Bouchouev’s story is a good one, and for those of us who care about the financial markets liquidity ecosystem it’s a beautiful one. Because it isn’t the end of the story. Chapter 1 was producers, putting curves into backwardation to provide an inducement to draw out speculators to be the other side of the hedge. Chapter 2 is Bouchouev’s tale, in which financial buyers push futures markets towards contango, which in turn provides an inducement to draw out speculators on the other side, or for hedgers to hedge more of their production. In Chapter 3, also according to Bouchouev, the market balances with hedgers reacting to economic uncertainty, and speculators fill in the gaps. Of course, in Chapter 4 the Fed comes in and wrecks the market altogether… but let’s enjoy this while we can.
[1] …and beyond the scope of this article. Interested parties may refer to History of Commodities as the Original Real Return Asset Class, by Michael Ashton and Bob Greer, which is Chapter 4 in Inflation Risks and Products, 2008, by Incisive Media. You can contact me for a copy if you are unable to find it.
Half-Mast Isn’t Half Bad
As I watch the stock market, implausibly, rise to levels no one expected so soon after the crash, I am also sickened by the cheerleading from those whose fortunes – not to mention egos – are wrapped up in the level at which the Dow trades. Stock market fetishism always fascinates me as much as it repels me. Although my experience as a trader (and a short-term options trader, at that) would seem to suggest otherwise, my makeup is as a long-term investor. I want to buy value, and the mathematics of investing for me is that I want (a) high intrinsic value at (b) a low price. While people who are buy-and-hold investors of a certain age clearly benefit from higher prices, young investors clearly benefit from lower prices since they’re going to be net buyers for a long time. And the price at which you acquire intrinsic value matters. So does the price at which you sell, but not until you sell.
So to me, there’s nothing great about a price that’s high relative to intrinsic value, unless I am preparing to sell. In a broader sense, the idea that we should cheer for higher prices (as opposed to higher intrinsic values) is not only unseemly, but destructive and I’ll explain why in a minute. I will note that the fascination with watching prices ticking every second goes back a long ways: you can read in Reminiscences of a Stock Operator about the bucket shops of the early 1900s where speculators would watch and trade the stock market tape. The general increase in investor twitchiness and short-termism that has accompanied the growth of financial news TV, online investing, and the development of ETFs to trade broad market exposures intraday certainly adds numbers to the cheerleading crowd. But it isn’t new. Depressing, but not new.
The most fascinating example of this belief in the (non-intuitive, to me) connection between the value of the stock market and the value of ‘Merica was presented to me in the aftermath of 9/11. When we first trudged back to lower Manhattan, there were people handing out these cards:


Fight Osama! Buy Cisco! I never did see the connection, and it seemed to me at the time either delusional (the terrorists win if my investment in Lucent goes down) or nakedly self-serving. Certainly the way I feel about my country has nothing to do with where I’m able to buy or sell eBay today. And actually, they really weren’t coming for our 401(k)s, they were coming for our lives. But I digress.
The point I actually want to make is that when the Fed works to stabilize market prices, they’re having a negative effect by destabilizing economic variables. An analogy from manufacturing might be an entry point to this explanation: a truism in manufacturing is that you can stabilize inventory, or you can stabilize production, but you can’t stabilize both (unless your customers are accommodating and provide very smooth demand). If you want to stabilize inventory levels, then you need to produce more when business is high and less when business is low, so you’re on the production roller-coaster. If you want to keep production level, then inventory will be low when business is high and high when business is low, so you’re on the inventory roller-coaster. Only if business itself is stable – which is rare – can you do both.
A similar thing happens in capital markets. You can stabilize the cost of capital, but then you destabilize growth rates. Or you can stabilize growth rates, and the cost of capital (stock and bond prices) will fluctuate. This is true unless you can do away with the business cycle. If you choose, as the Fed has in recent years, to try and stabilize market prices at very high levels (stabilizing the cost of capital at very low levels), then when underlying activity is strong you’ll get a ton of speculative investment in capacity, new ventures that depend on the availability of cheap capital, and strong growth. And then when economic activity heads lower, you’ll find that lots of businesses go bust and the recession is deeper. In fact, it’s not just the speculative businesses that go bust, but the overbuilding in the expansion can cause even prudent enterprises to have more difficulties in the downturn.
The Fed’s historical response to this has been to let the speculative activity happen when the cost of capital is held too low, but not let companies go bust when economic activity wanes…so they lower the cost of capital even further.
I’m obviously not the first person to point out that the Fed’s constant intervention has deleterious effects and tends to increase the amplitude of boom and bust. And, for what it’s worth, I’m not blaming the current recession on the Fed. Clearly, the proximate cause of this recession was COVID-19 and the global economic shutdown. What made it worse was that the Fed, by holding down the cost of capital, had previously precipitated the development and preserved the success of many more speculative enterprises. And the fetishism about stock prices, and about how important it is to have lots of money “working for you” in the stock market, is also one of the reason that people don’t save enough.
Of course, right now is probably not the time for the Fed and Congress to pull back and let huge numbers of people and companies go bankrupt. There’s a case to be made for the sort of government response we are having in this episode, in which personal income is being replaced by money creation while workers are ordered to stay home. There will be a piper to pay for that policy – a loss of price stability which is a consequence of trying to preserve output stability, but a consequence that it’s arguably acceptable to pay. Afterwards, though, I hope that central banks can start to let natural rhythms replace the autocratic ones. I am not hugely optimistic on that score, but one place to start is this: stop lowering the bar for central banks to intervene in markets. Stop targeting equity prices and interest rates. It’s okay to let the Dow trade at half-mast, and the bull will come back without the Fed’s help.
In fact, if we don’t keep trying to artificially increase the length of the mast, the Dow might never need to trade down to half-mast in the first place. Certainly, intrinsic values don’t retrace 50% in a recession!
A Generous Fed Isn’t Really the Good News it Sounds Like
I understand why people are delighted about Powell’s remarks yesterday, about how the Fed would need to see a significant and sustained increase in inflation before hiking rates again. This generation, and the last, does not see inflation as a significant threat, nor a significant cost should it get going, and believes firmly that the Fed can easily squelch it if it gets going. (They believe this because, after all, the Fed told them so).
Older investors might be more reticent to believe that there’s a pony in there somewhere, since the evidence suggests that not only does inflation erode purchasing power (thereby demanding even more nominal return be provided by portfolios that are already overstretched valuation-wise) but it also ruins the diversification effect of bonds relative to stocks. The main reason that 60:40 is a dramatically lower risk portfolio (and more efficient in an investing sense) than 100% stocks is that stock and bond returns have tended to be inversely correlated for a long time. When stocks go up, bonds go down, in general (and vice-versa). But that’s because they have inverse sensitivities to the economic growth factor. In recent years, that has been the only factor that matters, but stocks and bonds have the same sensitivity to the inflation factor: when inflation goes up, both stocks and bonds tend to decline (and vice-versa). Consequently, when inflation becomes an important element in investors’ calculations the correlation of stocks and bonds tends to be positive and in the immortal words of Billy Joel in “Goodnight Saigon,” “We would all go down together.” Along these lines I recently prepared this chart for Real Asset Strategies,[1] illustrating that when inflation is over about 2.5%, correlations tend to flip. This is a 3-year average of y/y inflation (and shown on the chart as inflation minus 2.5% so the zero line is what matters, not the line at 2.5%) versus 3-year correlations; the point is that you don’t need 4% inflation to drastically change the value of the 60:40 portfolio.

I also think that people give the Fed much more credit for their ability to squelch inflation – which after all they haven’t had to do for more than 30 years after spending 15 years squelching the last round – than they deserve. But that’s a ‘show me’ situation and it’s hard to prove my suspicion that they won’t be so successful when push comes to shove.
So, I understand why people are partying about a Fed that is even looser than it had been. I don’t think that’s the correct response, but I understand it.
I also understand why people are somewhat morose about trade frictions. It isn’t for the right reason, that in the long run it will hurt real growth a smidge and increase inflation a smidge-and-a-half, but because they think it will have a drastic effect on near-term growth. That’s why everyone gets so excited about any inkling the US and China are nearing a trade détente and so depressed when it looks like they aren’t. We are told that the current global slowdown is being caused largely by the trade war.
In my view that’s nonsense. The global economy has been expanding for a decade on exceptionally loose liquidity but no tree grows to the sky. The global economy was slowing well before the trade frictions could possibly have had any impact. But it is hard to convince people of that, because everyone knows that:
GDP = C + I + G + (X-M),
or consumption plus investment plus government spending plus trade. And we learned in school about Ricardian comparative advantage and how trade enriches (or anyway, can enrich) both parties at the same time. So if China doesn’t import anything from the US and doesn’t export anything to the US, growth is going to be crushed, right?
But that’s not how trade works. Frankly, that’s not how anything in the GDP equation works. If you remove the final term, you don’t reduce GDP by (X-M). Sure, if this was an algebra problem you would, but it’s not. In the real world, what you lose from trade gets partially replaced by an increase in consumption, investment, or government. Just as I pointed out last year with soybeans, if China buys zero from us it means they have to buy them from someone else, which means that supplier doesn’t have them to sell to one of their traditional customers…who then buys them from us. Incidentally, neither beans nor corn went to zero after mid-2018 (see chart, source Bloomberg, normalized to December 2017=100).

The rest of trade works the same way if the two parties are “internal customers” and “external customers.” Though there will always be winners and losers, if we don’t have international trade then we won’t have a destination for our merchandise overseas…but we will also have consumers who don’t have Chinese goods to buy and so need to buy something from a domestic producer instead. This is not a zero sum game; it clearly results in a loss for all players. But the order of magnitude of this loss in the short run is not very big at all, especially for a country with a large fraction of its domestic production going to domestic consumption, as in the US but not even for the world at large. The world economy has lots of reasons to slow and go into recession, and trade frictions are one of those reasons, but certainly not the only one and not even the largest reason.
An overreaction by markets to anything in a stream of economic news is not unique or new, of course; those overreactions won Robert Shiller a Nobel Prize after all for his work pointing out the “excess volatility puzzle” as an early highlight of the nascent field of behavioral economics. But there’s a good reason to ignore most of these wiggles and focus on the long-term effect of these developments. Which, in the case of both the general climate of trade and the Fed’s reaction function to inflation, are negatives for both stocks and bonds.
[1] As part of Enduring Intellectual Properties’ investment in Real Asset Strategies, I serve as Director of Research for the firm. Real Asset Strategies LLC offers liquid real asset strategies focused on diversification benefits and inflation protection at reasonable fees.
Spinning Economic Stories
As economists[1] we do two sorts of things. We do quantitative work, and we tell stories.
One of the problems with economics is that we aren’t particularly regimented about how we convert data into stories and about how we look at stories to decide how to interrogate the data. So what tends to happen is that we have a phenomenon and then we look at what story we like and decide if that’s a reasonable way to explain the data…without asking if there isn’t a more reasonable way to explain the data, or at least another way that’s equally consistent with the data. I’m not saying that everyone does this, just that it’s disturbingly common especially among people being paid to be storytellers and for whom a good story is really important.
So for example, there is a well -known phenomenon that inflation tends to accelerate after the Fed begins raising interest rates.[2] Purporting to explain this phenomenon, here is a popular story that the Fed is just really smart, so they’re ahead of inflation, and when they seeing it moving up just a little bit they can jump on it real quick and get ahead of it and so inflation goes up…but the apparent causality is there because we just knew it was going to go up and acted before the observation of the higher inflation happened. This is basically Keynesian theory combined with “brilliant person” theory.
There is another theory that is consistent with this, of course: monetarism, which explains that increasing interest rates actually causes inflation to move higher, by causing velocity to increase. But, because this isn’t the popular story, this doesn’t get matched up to the data very frequently. In my mind it’s a better theory, because it doesn’t require us to believe that the Fed is super brilliant to make it work. (And, not to get snarky, but the countervailing evidence versus Fed staff economist genius is pretty mountainous). Of course, economists – and the Fed economists in particular – like theories that make them look like geniuses, so they prefer the prior explanation.
But again, as economists we don’t have a good and rigorous way to say that one way is the ‘preferred’ story or to look at other stories that are consistent with our data. We tend to look at what part of the data supports our story – in other words, confirmation bias.
Why this is relevant now is that the Fed is in fact tightening and inflation is in fact heading higher, and the story being pushed by the Fed and some economists is “good thing the Fed is tightening, because it looks like inflation was going up!” The story on the other hand that I have been telling for quite some time (and which I write about in my book) is that it’s partly because the Fed is tightening and interest rates are going up that that inflation is rising, in a feedback loop that is missed in our popular stories. The important part is the next chapter in the story. In the “Fed is getting ahead of it” story, inflation comes down and the Fed is able to stop tightening, achieving a soft landing. In the “rate increase is causing velocity to rise and inflation to rise” story, the Fed keeps chasing the dog which is only running because the Fed is chasing it.
There is another alternative, which really excites the stock market as evidenced by today’s massive – although disturbingly low-volume – rally. That story is that the Fed is going to become more “data dependent” (Chairman Powell suggested something along these lines today), which is great because the Fed has already won on inflation and growth is still okay. So the Fed can stop the autopilot rate hikes. This story unfortunately does require a little suspension of disbelief. For one thing, today’s strong Employment report (Payrolls 370k, including revisions, compared to 184k expectations) is unfortunately a December figure which means it has huge error bars. Moreover, the Unemployment Rate rose to 3.9% from 3.7%, and while a higher Unemployment Rate doesn’t mean the economy is definitely slowing (it could just be that more people are looking for jobs because the job market is so robust – another fun story), it is certainly more consistent with the notion that the economy is slowing at the margin. The fact that the Unemployment Rate went up, while Hourly Earnings rose more than expected and Jobs rose more than expected, should make you suspect that year-end quirkiness might have something to do with the figures. For the decades I’ve watched economic data, I always advise ignoring the January and February Employment Reports since the December/January changes in payroll are so large that the noise swamps the signal. But professional storytellers aren’t really content to say “this doesn’t really mean anything,” even if that’s the quantitative reality. They get paid to spin yarns, so spin yarns they do.
Yeah, about those wages: I’m not really sure why economists were expecting hourly earnings to decelerate this month. All of the anecdotal data, along with other wage measures, are suggesting that wages are rising apace (see chart, source Bloomberg, showing the Atlanta Fed Wage Tracker vs AHE). Not really a surprise, even given its compositional challenges, that AHE is also rising.

The thing about all of these stories is that while they can’t change the actual reality, they can change how reality is priced. This is one of the reasons that we get bubbles. The stories are so powerful that trading against them, with a ‘value’ mindset for example, is quixotic. Ultimately, in the long run, the value of the equity market is limited by fundamentals. But in the short run, it is virtually unlimited because of valuation multiples (price as a speculative multiple of fundamental earnings, e.g.) and those valuation multiples are driven by stories. And that’s a big reason that bullish stories are so popular.
But consider this bearish footnote on today’s 3.4% S&P rally: volume in the S&P constituents today was lower than the volume was on December 26! To be fair, the volume yesterday, when the S&P declined 2.5%, was even a bit lower than today’s volume. It’s typical thin and whippy first-week-of-the-year trading. Let’s see what next week brings.
[1] People occasionally ask me why I didn’t go on for my MA or PhD in Economics. I reply that it’s because I learned my Intermediate Microeconomics very well: I stopped going for a higher degree when the marginal costs outweighed the marginal benefits. When you look at it that way, it makes you wonder whether the PhD economists aren’t just the bad students who didn’t absorb that lesson.
[2] It’s referred to as the “price puzzle”; see Martin Eichenbaum, “Interpreting Macroeconomic Time Series Facts: The Effects of Monetary Policy: Comments.” European Economic Review, June 1992. And Michael Hanson, “The ‘Price Puzzle’ Reconsidered,” Journal of Monetary Economics, October 2004.