Archive
Why the M2 Slowdown Doesn’t Blunt My Inflation Concern
We are now all good and focused on the fact that inflation is headed higher. As I’ve pointed out before, part of this is an illusion of motion caused by base effects: not just cell phones, but various other effects that caused measured inflation in the US to appear lower than the underlying trend because large moves in small components moved the average lower even while almost half of the consumption basket continues to inflate by around 3% (see chart, source BLS, Enduring Investments calculations).

But part of it is real – better central-tendency measures such as Median CPI are near post-crisis highs and will almost certainly reach new highs in the next few months. And as I have also pointed out recently, inflation is moving higher around the world. This should not be surprising – if central banks can create unlimited amounts of money and push securities prices arbitrarily higher without any adverse consequence, why would we ever want them to do anything else? But just as the surplus of sand relative to diamonds makes the former relatively less valuable, adding to the float of money should make money less valuable. There is a consequence to this alchemy, although we won’t know the exact toll until the system has gone back to its original state.
(I think this last point is underappreciated. You can’t measure an engine’s efficiency by just looking at the positive stroke. It’s what happens over a full cycle that tells you how efficient the engine is.)
I expect inflation to continue to rise. But because I want to be fair to those who disagree, let me address a potential fly in the inflationary ointment: the deceleration in the money supply over the last year or so (see chart, source Federal Reserve).

Part of my thesis for some time has been that when the Fed decided to raise interest rates without restricting reserves, they played a very dangerous game. That’s because raising interest rates causes money velocity to rise, which enhances inflation. Historically, when the Fed began tightening they restrained reserves, which caused interest rates to rise; the latter effect caused inflation to rise as velocity adjusted but over time the restraint of reserves would cause money supply growth (and then inflation) to fall, and the latter effect predominated in the medium-term. Ergo, decreasing the growth rate of reserves tended to cause inflation to decline – not because interest rates went up, which actually worked against the policy, but because the slow rate of growth of money eventually compounded into a larger effect.
And so my concern was that if the Fed moved rates higher but didn’t do it by restraining the growth rate of reserves, inflation might just get the bad half of the traditional policy result. The reason the Fed is targeting interest rates, rather than reserves, is that they have no power over reserves right now (or, at best, only a very coarse power). The Fed can only drain the inert excess reserves, which don’t affect money supply growth directly. The central bank is not operating on the margin and so has lost control of the margin.
But sometimes they get lucky, and they may just be getting lucky. Commercial bank credit growth (see chart, source Federal Reserve) has been declining for a while, pointing to the reason that money supply growth is slowing. It isn’t the supply of credit, which is unconstrained by reserves and (at least for now) unconstrained by balance sheet strength. It’s the demand for credit, evidently.

Now that I’ve properly laid out that M2 is slowing, and that declining M2 growth is typically associated with declining inflation (and I haven’t even yet pointed out that Japanese and EU M2 growth are both also at the lowest levels since 2014), let me say that this could be good news for inflation if it is sustained. But the problem is that since the slowing of M2 is not the result of a conscious policy, it’s hard to predict that money growth will stay slow.
The reason it needs to be sustained is that we care about percentage changes in the stock of money plus the percentage change in money velocity. For years, the latter term has been a negative number as money velocity declined with interest rates. But M2 velocity rose in the fourth quarter, and my back-of-the-envelope calculation suggests it probably rose in Q1 as well and will rise again in Q2 (we won’t know Q1’s velocity until the advance GDP figures are reported later this month). If interest rates normalize, then it implies a movement higher in velocity to ‘normal’ levels represents a rise of about 12-14% from here (see chart, source Bloomberg.[1])

If money velocity kicks in 12-14% over some period to the “MVºPQ” relationship, then you need to have a lot of growth, or a pretty sustained decline in money growth, to offset it. The following table is taken from the calculator on our website and you can play with your own assumptions. Here I have assumed the economy grows at 2.5% per year for the next four years (no mean feat at the end of a long expansion).

The way to read this chart is to say “what if velocity over the next four years returns to X. Then what money growth is associated with what level of inflation?” So, if you go down the “1.63” column, indicating that at the end of four years velocity has returned to the lower end of its long-term historical range, and read across the M2 growth rate row labeled “4%”, you come to “4.8%,” which means that if velocity rises to 1.63 over the next four years, and growth is reasonably strong, and money growth remains as slow as 4%, inflation will average 4.8% per year over those four years.
So, even if money growth stays at 4% for four years, it’s pretty easy to get inflation unless money velocity also stays low. And how likely is 4% money growth for four years? The chart below shows 4-year compounded M2 growth rates back thirty or so years. Four percent hasn’t happened in a very long time.

Okay, so what if velocity doesn’t bounce? If we enter another bad recession, then it’s conceivable that interest rates could go back down and keep M2 velocity near this level. This implies flooding a lot more liquidity into the economy, but let’s suppose that money growth is still only 4% because of tepid credit demand growth and velocity stays low because interest rates don’t return to normal. Then what happens? Well, in this scenario presumably we’re no longer looking at 2.5% annual growth. Here’s rolling-four-year GDP going back a ways (source: BEA).

Well, let’s say that it isn’t as bad as the Great Recession, and that real growth only slows a bit in fact. If we get GDP growth of 1.5% over four years, velocity stays at 1.43, and M2 grows only at 4%, then:
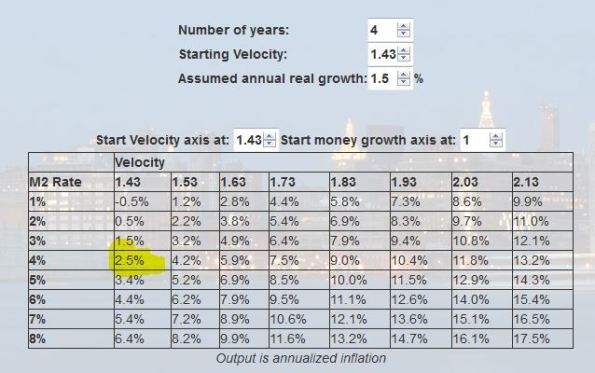
…you are still looking at 2.5% inflation in that case.
I’m going through these motions because it’s useful to understand how remarkable the period we’ve recently been through actually is in terms of the growth/inflation tradeoff, and how unlikely to be repeated. The only reason we have been able to have reasonable growth with low inflation in the context of money growth where it has been is because of the inexorable decline in money velocity which is very unlikely to be repeated. If velocity just stops going down, you might not have high inflation numbers but you’re unlikely to get very low inflation outcomes. And if velocity rises even a little bit, it’s very hard to come up with happy outcomes that don’t involve higher inflation.
I admit that I am somewhat surprised that money growth has slowed the way it has. It may be just a coin flip, or maybe credit demand is displaying some ‘money illusion’ and responding to higher nominal rates even though real rates have not changed much. But even then…in the last tightening cycle, the Fed hiked rates from 1% to 5.25% over two years in 2004-2006, and money growth still averaged 5% over the four years ended in 2006. While I’m surprised at the slowdown in money growth, it needs to stay very slow for quite a while in order to make a difference at this point. It’s not the way I’d choose to bet.
[1] N.b. Bloomberg’s calculation for M2 velocity does not quite match the calculation of the St. Louis Fed, which is presumably the correct one. They’re ‘close enough,’ however, for this purpose, and this most recent print is almost exactly the same.
Summary of My Post-CPI Tweets
Below is a summary of my post-CPI tweets. ou can (and should!) follow me @inflation_guy or sign up for email updates to my occasional articles here. Investors with interests in this area be sure to stop by Enduring Investments.
- Core CPI prints +0.145…just misses printing +0.2, which will make it seem weak. We will see the breakdown.
- y/y core goes to 1.73% from 1.81%. A downtick there was very likely because we were dropping off +0.23%
- This decreases odds of Sept Fed hike (I didn’t think likely anyway) but remember we have a couple more cpi prints so don’t exaggerate.
- Core goods (-0.3% from -0.2%) and core services (2.4% from 2.5%) both declined. Again, some of that is base effects.
- fwiw, next few months we drop off from core CPI: +0.137%, +0.098%, +0.052%, and +0.145%. So y/y core will be higher in a few months.
- INteresting was housing declined to 1.9% from 2.2% y/y. But it was all Lodging away from home: 0.96% from 5.1% y/y!
- Gotta tell you I am traveling now and that reminds you the difference between rate and level. Hotels are EXPENSIVE!
- Owners’ Equiv Rent +2.79% from 2.77%. Primary Rents 3.47% unch. So the main housing action is still up. And should continue.
- Remember the number we care about is actually Median CPI, a couple hours from now. That should stay 0.2 and around 2.2% y/y.
- At root, this isn’t a very exciting CPI figure. It helps the doves, but that help will be short-lived. Internals didn’t move much tho.
The last remark sums it up. While the movement in Lodging Away from Home made it briefly look like there was some weakness in housing, I probably would have dismissed that anyway. There’s simply too much momentum in housing prices for there to be anything other than accelerating inflation in that sector. We have a long way to go, I think, before we have any topping in housing inflation.
But overall, this was a fairly boring figure. While the year-on-year core CPI print declined, that was due as I mentioned to base effects: dropping off a curiously strong number from last year. (That said, this month’s core CPI definitely calms things a bit after last month’s upward surprise). However, the next few base effect changes will push y/y core CPI higher. While today’s data will be welcomed by the doves, by the time of the September meeting the momentum in core inflation will be evident and median inflation is likely to be heading higher as well.
Note that I don’t think the Fed tightens in September even with a core CPI at 2% or above, but the bond market will get very scared about that between now and then. Could be some rough sledding for fixed income later in the summer. But not for now!
Summary of My Post-CPI Tweets
Below is a summary of my post-CPI tweets. You can follow me @inflation_guy :
- 1y inflation swaps and gasoline futures imply a 1-year core inflation rate of 0.83%. Wonder how much of that we will get today.
- Very weak CPI on first blush: headline -0.3%, near expectations, but core 0.07%, pushing y/y core down to 1.71% from 1.81%.
- Ignore the “BIGGEST DROP SINCE DECEMBER 2008” headlines. That’s only headline CPI, which doesn’t matter. Core still +1.7% and median ~2.3%
- Amazing how core simply refuses to converge with median. Whopping fall in used cars and trucks and apparel – which is dollar related.
- Core services +2.5%, unch; core goods -0.5%, lowest since 2008. But this time, we’re in a recovery.
- Medical Care Commodities, which had been what was dragging down core, back up to 3.1% y/y. So we’re taking turns keeping core below median.
- Core ex-housing declines to +0.800%, a new low.
- That’s a new post-2004 low on core ex-shelter.
- Accel major groups: Food, Med Care (22.5%) Decel: Housing, Apparel, Transp, Recreation, Educ/Comm, Other (77.5%). BUT…
- But in housing, Primary Rents 3.482% from 3.343%, big jump. Owners’ Equiv to 2.707% from 2.723%, but will follow primaries.
- Less-persistent stuff in housing responsible for decline: Lodging away from home, Household insurance, household energy, furnishings.
- Real story today is probably Apparel, which is clearly a dollar story. Y/y goes to -0.4% from +0.6%. Small weight, but outlier.
- Similarly used cars and trucks, -3.1% from -1.7% y/y (new vehicles was unch at 0.6% y/y).
- On the other hand, every part of Medical Care increased. That drag on core is over.
- Curious is that airfares dropped: -3.9% from -2.8%. SHOULD happen due to energy price declines, but in my own shopping I haven’t seen it.
- I don’t see persistence in the drags on core CPI. There’s a rotation in tail-event drags, which is why median is still well above 2%.
- We continue to focus on median as a better and more stable measure of inflation.
- Back of the envelope calc for median CPI is +0.23% m/m, increasing y/y to 2.34%. Let’s see how close I get. Number around noon. [Ed. note: figure actually came in around 0.15%, 2.25% y/y. Not sure where I am going wrong methodologically but the general point remains: Median continues to run hotter than core, and around 2.3%.]
Quite a few tweets this morning! The number was clearly roughly in-line on a headline basis: gasoline prices have dropped sharply, in line with crude oil prices. How much? Motor Fuel dropped from -5.0% y/y to -10.5% y/y. The monthly decline was over 6%, and so a decline in headline inflation on a month/month basis was all but certain. Had core inflation been as low now as it was in 2010, we would have seen a year-on-year headline price decline (as it is, headline CPI is +1.3% y/y).
However, core inflation is not as low as it was in 2010. It continues to surprise us by failing to converge upwards to median CPI. Last year, the reason core CPI was inordinately low compared to the better measure of central tendency (median) was that Medical Care inflation was weak thanks to the effects of the sequester. But that effect is now gone. Medical Care inflation is back to 2.5% on a year-on-year basis; this month’s print was the highest in over a year. The chart below (Source: Bloomberg) shows the y/y change in Medical Care Commodities (e.g. pharmaceuticals) – back to normal.

The 2013 dip is very clear there, and the return to form is what we expected, and the reason we expected core inflation to return to median CPI. But it hasn’t yet; indeed, core is below median by around 0.6%, the biggest spread since 2009. Now, it may be that core is simply going to stay below median for an extended period of time as one category after another takes turns dragging core lower. From 1994-2009, core was almost always lower than median. That was a period of disinflationary tendencies, and the fact that different categories kept trading off to drag core CPI lower was one sign of these tendencies.
I do not think we are in the same circumstances today. Although private debt levels remain very high (weren’t we supposed to have had deleveraging over the past six years? Hasn’t happened!), public debt levels have risen dramatically and the latter tends to be associated with inflation, not deflation. Money supply, especially here in the US, has also been growing at a pace that is unsustainable in the long run and it seems unlikely that the Fed can really restrain it until they drain all of the excess reserves from the system. These are inflationary tendencies. The risk, though, is that the feeble money growth in Europe could suck much of this liquidity away and move global inflation lower. This is an especially acute risk if Japan’s monetary authorities lose their nerve or if other central banks rein in money growth. In such a case, global inflation would decline so that, while US inflation rises relatively, it falls absolutely. I don’t consider this a major risk, but it is a risk which is growing in significance.
Of course, all of that and more is priced into inflation-linked bond and derivative markets, as well as in commodities. Only a massive and inexplicable plunge in core inflation could render the market-based forecasts correct – and there is no sign of that. Housing inflation continues to rise, and the soonest we can see that peaking is late next year. Getting core inflation to decline appreciably while housing inflation is 2.6% and rising is very unlikely! Accordingly, we see inflation-linked assets as extremely cheap currently.
Summary of My Post-CPI Tweets
Below is a summary of my post-CPI tweets. You can follow me @inflation_guy.
- CPI +0.0%, +0.2% on core. Above expectations.
- Core 0.203% before the rounding to 1 decimal place. So this didn’t “round up” to 0.2%. Y/y core at 1.82%, versus 1.7% expectations.
- Today’s winners include Treasury, who is auctioning a mess of TIPS later.
- Today’s losers include everyone shorting infl expectations last few months. Keep in mind median CPI > 2.2% so this is not THAT shocking.
- Core services +2.5%, core goods -0.2%. Both higher (y/y basis) than last month.
- Fed will be considered a “winner” here since y/y core moves back toward tgt. But in fact losers b/c median already near tgt & rising.
- Accel major groups: Housing, Apparel, Medical, Recreation, Other. Decel: Transp, Educ/Communication. Unch: Food/Bev.
- ex motor fuel, Transportation went from 0.6% y/y to 0.7% y/y.
- Housing: primary rents 3.34% from 3.29%. OER 2.72% from 2.71%. Lodging away from home was big mover at 8.4% from 5.0% (but small weight).
- Within medical care, medicinal drugs decelerated from 3.08% to 2.77%; but hospital & related svcs rose to 3.91% from 3.47%.
- Core CPI ex-housing still rose, from 0.88% (a ten-year low) to 0.95%.
- Primary rents to us look like they should still be accelerating, and are behind pace a bit.
- Really, nothing soothing at all about this CPI print, unless you were hoping to get inflation “back to target.”
- Pretty feeble response in inflation markets to upside CPI surprise, but that’s likely because of the looming auction.
After several months of below-trend and below-expectations prints in core inflation, core inflation got back on track today. I must admit that I was beginning to get a big concerned given the multiple months of downside surprise (especially in September, when August’s core inflation figure printed 0.0%), but the solidity of Median CPI has always suggested that we should be getting close to 0.2% prints every month and so a catch-up was due.
It is also possible that median inflation could converge downward to core inflation, but quantitatively we would only expect that if the reasons for core inflation’s decline were that categories which tend to lead were heading lower. In this case, that wasn’t what was happening: most of what was happening to core inflation was self-inflicted, caused by sequester effects that pushed down medical care. So it was always more likely that core inflation would begin to converge higher than the other way around.
Some Fed speakers have recently been voicing concern about the possibility of an unwelcome decline in inflation from these levels. I am flummoxed about those remarks – surely, Federal Reserve economists are aware of median inflation and understand that there is absolutely no evidence that prices broadly are increasing more slowly than they were last year. No evidence whatsoever. But perhaps I should not malign Fed economists when the speakers may have other agendas – for example, the desire to keep interest rates as low as possible lest asset markets correct and cause a messy situation, and therefore to find reasons to ignore any signs that inflation is already at or near their target with upwards momentum.
Our forecast for median inflation has been slowly declining since the beginning of the year, when we expected something from 2.8%-3.4%. As of September, our forecast was 2.5%-2.8%. Median CPI today rose 0.21%, pushing the y/y figure to 2.29%. That’s the highest level since the crisis, just beating out the high from earlier this year and probably signaling a further increase. Our September forecast will not be far wrong.
Summary of My Post-CPI Tweets
The following is a summary of my post-CPI tweets. You can follow me @inflation_guy (or follow the tweets on the main page at http://mikeashton.wordpress.com)
- Core CPI +0.14%, close to rounding to +0.2%. An 0.2% would have caused a panic in TIPS, where there have been far more sellers recently.
- y/y core to 1.73%, again almost rounding to 1.8% versus 1.7% expected. This just barely qualifies as being “as expected”, in other words.
- Core services fell to 2.4%, but core goods rose to -0.3% y/y.
- OER re-accelerated to 2.71% from 2.68% y/y. It will go higher.
- really interesting that core goods did not weaken MORE given dollar strength. $ strength is overplayed by inflation bears.
- Apparel went to 0.5% y/y from 0.0%. That’s the category probably most sensitive directly to dollar movements b/c apparel is all overseas.
- Accel major groups: Food/Bev, Apparel, Recreation (24.1% of basket). Decel: Housing, Transp, Med Care, Educ/Comm (72.5%).
- Though note that in housing, Primary rents rose from 3.18% to 3.29%, and OER from 2.68% to 2.71%, so weakness is mostly household energy.
- That’s a new high for primary rental inflation. Lodging away from home also went to new high, 5.04% y/y. But it’s choppier.
- Airfares continued to decelerate, -3.01% from -2.71%. Ebola scares can’t have helped that category, which most expected to rebound.
- But these days, airfares are very highly correlated to fuel prices (wasn’t always the case). [ed note: see chart below]
- In Medical Care, pharmaceuticals rose to 3.08% from 2.72%. But the medical services pieces decelerated.
- Decel in med services is the surprise these days as the passage of the sequester cause positive base effects.
- The weakness in med services holds down core PCE, too. Median CPI continues to be a better measure as a result.
- College tuition and fees 3.36% from 3.32%. Still low compared to where it’s been. Strong markets help colleges hold down tuitions.
- Core CPI ex-housing partly as a result of continued medical care weakness is down to a new low 0.877% from 0.911%.
- That continues to be the horse race: housing versus a wide variety of other things not inflating. Yet.
We may hear about how this CPI report shows that there is “still no inflation,” but the simple fact is that the report was a little stronger-than-expected, that shelter inflation continues to accelerate with no end in sight, and that there was no large effect seen in core inflation from the strength of the dollar. The dollar has an evident effect on energy commodities, and a lesser effect on other commodities, but once you get to finished goods it takes a larger FX move or one longer in duration than the modest dollar rally we have had so far to cause meaningful movements in inflation.
The dollar’s strength, reflecting in energy weakness, also shows up in some categories where we don’t fully appreciate the link to energy. The airfares connection is always one of my favorites to show. Prior to 2004, there was basically no correlation between airfares and jet fuel prices (vertical part of the chart below). After 2004, the correlation went to basically 1.0 (see chart, source Enduring Investments).

The real conundrum in the CPI right now is the medical care piece. We always knew there would be difficulties in extracting what is really going on in medical care once Obamacare kicked in, because many of the costs of that program don’t show up immediately as consumer costs. But the main effect in the data all last year was the effect of the sequester on Medicare payments, which pushed down Medical Care inflation from over 4% in mid-2012 to 2% in 2013. But as the sequester passed out of the data, Medical Care CPI rose to nearly 3% earlier this year…and then slipped, abruptly, back to the lows (see chart, source Bloomberg).

Is it possible that Obamacare is really restraining consumer inflation for medical care? Sure, it is possible. But there is far too much noise at this point to know what is happening in that component. And it really matters, because the overweighting of medical care and underweighting of housing in core PCE is the main reason that the Fed-favored price index shows 1.5% while median CPI is at 2.2%, within a snick of the highs since the crisis (see chart, source Bloomberg – note median CPI isn’t out yet for September).

From a markets perspective, the TIPS market (and the commodities market, for that matter) have been pricing in a pernicious disinflation and/or deflationary pressure. It is simply not there. And so, even with a print that couldn’t reach 0.2% on core, and even heading into a big auction tomorrow, inflation breakevens are rallying nicely, up 3.5-4.5bps across the board. Imagine what they would have done with a print that was a bona fide strong print!
Summary of My Post-CPI Tweets
Below is a summary of my post-CPI tweets today. You can follow me @inflation_guy.
- Weak cpi: 0.1%, core +0.1%. Unrounded core was +0.096, so it rounded UP to 0.1%. Y/y core stayed at 1.9% but just barely: 1.85%.
- That’s a real surprise since virtually all signs had been for higher core going forward. Breakdown will be interesting.
- Core svcs y/y slipped to 2.6%; core goods fell further to -0.3%. Leading indicators on both still point higher though.
- Accel major groups: Food/Bev, Housing (56.3%). Decel: Apparel, Transp, Recreation, Other (29%). Unch: Med Care, Educ/Comm (14.7%)
- Primary Rents 3.28% from 3.15%. OER 2.72% from 2.64%. No danger of inflation declining while these are rising strongly.
- Dramatic fall in airline fares: from 5.34% y/y to -0.25%.
- Airline fares are only 0.74% of the basket but that took 0.04% from headline and 0.05% from core.
- Big move in one item suggests median CPI won’t fall, though I haven’t yet done the math. In any event, number not as weak as I thought.
- Medicinal drugs 3.12% from 3.00%. Med equip/supplies 0.2% from -1.08%. Much of this is unwind of sequester effect last yr.
- Easy comparison next month means core will be back to 1.9% in August, chance of 2.0%. It needs to converge with median!
- I think Median CPI might actually accelerate today from 2.3%, based on my rough calculations.
The initial headline was a bit of a shock, as it looked very weak. But as I looked deeper into the numbers, it didn’t seem nearly as weak as I had first thought. To be sure, this is not a strong report, but the seeming weakness came largely from one component. The most-important components (and the ones with the most inertia) are the housing pieces, and those are moving strongly ahead.
When I did my calculations of the median CPI (I don’t do it the same way as the Cleveland Fed does it), I came up with a decent rise over last month’s figure. That is to say that most categories continue to see accelerating inflation. We will see if the Cleveland Fed agrees, but an uptick in the median CPI (which was 2.3%, unchanged, last month) would go a long way towards removing any sense that this was actually a weak figure.
Summary of My Post-CPI Tweets
Following is a summary of my post-CPI tweets. You can follow me @inflation_guy!
- Well, I hate to say I told you so, but…increase in core CPI biggest since Aug 2011. +0.3%, y/y up to 2.0% from 1.8%.
- Let the economist ***-covering begin.
- Core services +2.7%, core goods still -0.2%. In other words, plenty of room for core to continue to rise as core goods mean-reverts.
- (RT from Bloomberg Markets): Consumer Price Inflation By Category http://read.bi/U60bLJ pic.twitter.com/R2ufMjVRRM
- Major groups accel: Food/Bev, Housing, Apparel, Transp, Med Care, Other (87.1%) Decel: Recreation (5.8%) Unch: Educ/Comm (7.1%)
- w/i housing, OER only ticked up slightly, same with primary rents. But lodging away from home soared.
- y/y core was 1.956% to 3 decimals, so it only just barely rounded higher. m/m was 0.258%, also just rounding up.
- OER at 2.64% y/y is lagging behind my model again. Should be at 3% by year-end.
- Fully 70% of lower-level categories in the CPI accelerated last month. That’s actually UP from April’s very broad acceleration.
- That acceleration breadth is one of the things that told you this month we wouldn’t retrace. This looks more like an inflation process.
- 63% of categories are seeing price increases more than 2%. Half are rising faster than 2.5%.
- Back of the envelope says Median CPI ought to accelerate again from 2.2%. But the Cleveland Fed doesn’t do it the same way I do.
- All 5 major subcomponents of Medical Care accelerated. Drugs 2.7% from 1.7%, equip -0.6% from -1.4%, prof svs 1.9% from 1.5%>>>
- >>>Hospital & related svcs 5.8% from 5.5%, and Health insurance to -0.1% from -0.2%. Of course this is expected base effects.
- Always funny that Educ & Communication are together as they have nothing in common. Educ 3.4% from 3.3%; Comm -0.24% from -0.18%.
This was potentially a watershed CPI report. There are several things that will tend to reduce the sense of alarm in official (and unofficial) circles, however. The overall level of core CPI, only just reaching 2%, will mean that this report generates less alarm than if the same report had happened with core at 2.5% or 3%. But that’s a mistake, since core CPI is only as low as 2% because of one-off effects – the same one-off effects I have been talking about for a year, and which virtually guaranteed that core CPI would rise this year toward Median CPI. Median CPI is at 2.2% (for April; it will likely be at least 2.3% y/y from this month but the report isn’t out until mid-day-ish). I continue to think that core and median CPI are making a run at 3% this calendar year.
The fact that OER and Primary Rents didn’t accelerate, combined with the fact that the housing market appears to be softening, will also reduce policymaker palpitations. But this too is wrong – although housing activity is softening, housing prices are only softening at the margin so far. Central bankers will make the error, as they so often do, of thinking about the microeconomic fact that diminishing demand should lower market-clearing prices. That is only true, sadly, if the value of the pricing unit is not changing. Relative prices in housing can ebb, but as long as there is too much money, housing prices will continue to rise. Remember, the spike in housing prices began with a huge overhang of supply…something else that the simple microeconomic model says shouldn’t happen!
Policymakers will be pleased that inflation expectations remain “contained,” meaning that breakevens and inflation swaps are not rising rapidly (although they are up somewhat today, as one would expect). Even this, though, is somewhat of an illusion. Inflation swaps and breakevens measure headline inflation expectations, but under the surface expectations for core inflation are rising. The chart below shows a time-series of 1-year (black) and 5-year (green) expectations for core inflation, extracted from inflation markets. Year-ahead core CPI expectations have risen from 1.7% to 2.2% in just the last two and a half months, while 5-year core inflation expectations are back to 2.4% (and will be above it today). This is not panic territory, and in any event I don’t believe inflation expectations really anchor inflation, but it is moving in the “wrong” direction.

But the biggest red flag in all of this is not the size of the increase, and not even the fact that the monthly acceleration has increased for three months in a row while economists keep looking for mean-reversion (which we are getting, but they just have the wrong mean). The biggest red flag is the diffusion of inflation accelerations across big swaths of products and services. Always before there have been a few categories leading the way. When those categories were very large, like Housing, it helped to forecast inflation – well, it helped some of us – but it wasn’t as alarming. Inflation is a process by which the general price level increases, though, and that means that in an inflationary episode we should see most prices rising, and we should see those increases accelerating across many categories. That is exactly what we are seeing now.
In my mind, this is the worst inflation report in years, largely because there aren’t just one or two things to pin it on. Many prices are going up.
Summary of My Post-Employment Tweets
Here are my post-Employment tweets. You can follow me @inflation_guy.
- Pretty weak NFP number since the payrolls figure (169k) plus revisions (-74k) is way worse than forecast. Decline in rate irrelevant.
- Actually think Fed spent so much time talking about starting taper that they may do it anyway, but have an excuse now to delay.
- Nothing like a weak NFP number to help the beleaguered bond market. Bounce may temporary but in Sep you don’t wanna fade rallies.
- I don’t watch it much, but avg hrly earns at 2.2% is highest since brief pop to 2.3% in mid-2011. Y do people hate TIPS here?
So 10-year note yields broke above 3% overnight, the highest level since 2011. More importantly, 10-year real yields had been approaching 1% (reaching 0.93% overnight) as fear-of-taper has investors quite reasonably fleeing fixed-income.
I said above that I don’t look much at average hourly earnings. This is because the evidence is that wages follow prices, rather than prices following wages in a mythical “wage-push” inflation. Moreover, we can intuit that this is the case because if wages led inflation, we would really like inflation since we would tend to see our wages increase before inflation did…we would be doing better all the time, rather than worse. In fact, we know intuitively that is wrong.
With that giant caveat, it is worth pointing out that average hourly earnings are above median CPI (which right now is a better measure of the central tendency of inflation because of the large one-off effects in medical care) by the most they have been since 2011 (see chart below, source Bloomberg).

The unemployment rate declined, but only because the Participation Rate plumbed a new post-Carter low at 63.2%. You have to go back to July 1978 to find participation rates this low, and back then there were a lot fewer women in the workforce.
All in all, this is a pretty ugly employment report, but the FOMC has carefully lined up its doves and even gotten a few hawks to say that tapering ought to begin this month. I suspect it is still likely that they start down that path, but probably the first steps are fairly small. Still, given how far rates have risen and the possibility that this will lead to some “taper: off” talk, and given the strong seasonal tendency for rates to decline in September and early October, I would not want to fade a bond market rally.
Honest, Abe?
Today was CPI day, which after Christmas and Thanksgiving is one of my most favorite of days. Here is what I tweeted earlier today (and there’s lots more commentary below):
- unrounded core CPI at +0.18%, a bit higher than what dropped off. Not exactly alarming, but higher than Street expectations.
- y/y core to almost exactly +2.000%. Apparel rose again after the recent rise had slowed in the last couple of months.
- Subindices: ACCEL: Housing, Apparel, Transp, Food/Bev (75.2% of basket). DECEL: Med Care (6.9% of basket). UNCH: Recreation, Comm/Ed, Other
- OER was unch…rise in Housing came from primary rents (that is, you actually pay rent) and lodging away from home.
- Core goods inflation stayed stable at +0.7% y/y; core services stable at +2.5%. I think the former number is going to rise.
This was actually something less than the most exciting CPI report in history. It was better than the Street expected, and although the year/year figure barely nudged higher the components of the number were strong. The rise came from Housing, which ought to continue to accelerate for a while given rental tightness and other forward-looking indicators, and Apparel resumed its rise as well. See the chart below (source: Bloomberg) for the update to what is rapidly becoming one of my favorite inflation-related charts.

The Cleveland Fed’s Median CPI dropped just enough to round down to +2.2% on a y/y basis, and the Atlanta Fed’s “Sticky” CPI is also at 2.2%. These measures are other ways to look at the central tendency of the inflation figures, and suggest that the current 2.0% from the traditional Core CPI is likely to converge higher rather than vice-versa.
But today didn’t change any inflation paradigms.
There was other news, however, that struck me as inflation-related and worth commenting on.
One was a story in the UK Daily Mail citing the case of a Denny’s franchisee (he owns a few dozen Denny’s restaurants) who is planning to add a 5% “Obamacare surcharge” to customer dining checks.
Now, the sum of all of the sales of this man’s Denny’s restaurants is a tiny part of the CPI category “Food away from home,” which is itself a small part of CPI, so it won’t have any impact on the numbers. Even if lots of restaurants followed suit, it wouldn’t have much of an impact since “Food away from home” is only 5.6% of the consumption basket (so a 5% surcharge on all checks would cause a rise in CPI of 0.28%), but it serves as a good reminder of one important point.
The higher taxes and other costs of doing business that are going to be targeted at business is going to show itself to individuals one way or the other. The higher cost of Obamacare compliance, and any other increased business taxes, will not be paid by businesses for the simple reason that businesses are pass-through entities. That is, businesses don’t make money; people who own businesses (partners or shareholders) make money. So whether the higher costs show up as higher prices to the consumer (in which case the government’s attempt to raise revenue from business will result in higher inflation prints, as the transition takes place) or as lower profits to the businesses themselves, the cost will end up being borne by real humans.
At the end of the day, how much of these costs is absorbed by the owners and how much is paid by the consumers is determined by the elasticity of supply and demand for the product. For example, if the elasticity of demand is infinite, then the owners will bear the entire cost; if the elasticity is zero, then consumers will pay it all. My personal guess is that given the current level of gross margins, more of these taxes and higher costs will be paid by owners – implying lower equity earnings – than by consumers, but we will see. But notice that either way, you get lower real earnings. Either nominal earnings fall, or prices rise. Not good for stocks in either case; bad for bonds in the latter case, too.
Then there are the actions of several central banks in the other hemisphere. A story in the Wall Street Journal, and echoed elsewhere such as in this Australian news outlet, suggests that the Reserve Bank of Australia has adopted a form of QE by allowing its foreign currency reserves to rise in order to push down the currency. The RBA has been one of the bastions, at least relatively, of ‘hard money’ in a world of central banks that have gone wild, so this isn’t a positive development unless you’re long inflation-related assets.
And also hard to miss were the comments by the leader of Japan’s main opposition party, Shinzo Abe, who may become the next prime minister quite soon. Abe suggested that the Bank of Japan should target 3% inflation, rather than 1% inflation, and threatened to revise the law that (supposedly) insulates the BOJ from politics. Note that 5-year Japanese inflation swaps are near all-time highs, but still only at 0.77%, and 10-year inflation swaps are at only 0.48%. Under Abe’s pressure, we would likely see a substantial acceleration in QE by the BOJ, which has already succeeded in pushing core inflation in Japan from -1.6% to -0.6% over the last two years (see chart, source Bloomberg).

We are increasingly moving into a one-way street for central bank policy. Central bankers are essentially engaging in a sophisticated version of competitive devaluations. The Fed does QE, the BOE does QE, the ECB does QE (but claims it doesn’t), the SNB and BOJ and now the RBA does QE. It is a one-way street because whoever stops printing first will see his currency shoot higher as investors flock to the harder currency. The chart below shows what has happened to the Aussie dollar over the last decade versus the USD. While the strengthening trend was interrupted by the 2008 flight-to-quality, it quickly resumed. Since that time, it has risen roughly 50% (and 100% overall since 2001).

Now, a strong currency is good. It makes foreign goods cheaper and raises the standard of living overall. However, it also hurts exports, which slows the economy and results in visible layoffs while the economy adjusts. There’s only so much of this a country’s politicians are willing to take, and it seems Australia may have reached its limit.
If everyone is printing, exchange rates may not move at all. It has frustrated many dollar bears that the greenback hasn’t declined under the profligate printer Bernanke; printing money is supposed to destroy a currency. It has done so repeatedly over the course of history, and it happens for obvious reasons: when you get a bumper crop of something, its price tends to fall. More supply induces lower prices. In this case, it induces a lower price of a currency unit in terms of other currency units.
But that only happens if the relative supply of a currency is changing. If everyone is printing at roughly the same pace, there is no reason that currencies should move at all relative to each other. They should all fall relative to non-printers, or to hard assets. And that’s why it’s even more incredible that commodities are not shooting higher. Yet.
Those effects, in my view, absolutely swamp in importance the weak growth news we’re getting these days. Today, the Philly Fed report and Initial Claims were both quite weak, but the data is going to be polluted by hurricane Sandy for a while and hard to interpret. I don’t think the hurricane had anything to do with this story, or its timing for that matter:
FHA Needs Bailout From Treasury to Plug Budget, Bachus Says
“Nov. 15 (Bloomberg) — The Federal Housing Administration will need billions of dollars in aid from the U.S. Treasury before the end of the year to fill a financial hole caused by defaults on mortgages it insures, House Financial Services Committee Chairman Spencer Bachus said today.
“… The agency is “burning through” its last $600 million and FHA officials have briefed him that they will need a financial backstop within a month, the Alabama Republican said during a press conference in Washington.”
So, we are trying to figure out how to raise a trillion dollars over ten years to start closing the budget gap, but it helps to remember that there are other groups who are going to be bellying up to the bar for a hit of government help. The FHA, the postal service (-$15.9bln this year, although they expect to lose only $7bln next year), probably California before long. We’d better get our act together quickly…but as yet, there is no sign of it. Nice of Bachus to wait until less than a month before the FHA runs out of money to mention this, by the way.
And I haven’t even mentioned the sudden explosion of violence in Israel, which doesn’t give the impression of a fire that will quickly burn out. It may not spin out of control, either, but it bears watching very closely since our influence in the region has significantly ebbed since the change of control in Egypt, our exit from Iraq, and our distancing from Israel.
I don’t think 2013 is shaping up to be a very fun year. But we’re not there yet!
A Summary Of My Post-CPI Tweets
This is a summary of my Post-CPI tweets today. You can follow me @inflation_guy.
- Core CPI +0.146%, just barely missing the soft +0.2% people were looking for. But y/y still rose to 2.0%.
- that dip in core is over – next several months have easy year-ago comps.
- Services inflation +0.3%, as is Housing. It’s only core commodities that’s a drag now (+0.0% after -0.1% last month).
- Rents (both primary and OER) rose +0.2% and the y/y rise matches core inflation at 2.1%. The inflation-sapping bust is over.
- unrounded y/y core CPI: 1.988%.
- Y/Y core services inflation is 2.5%. Y/Y core goods is +0.7%. It was services that dragged core down in 2009-10. That’s over. [Note: see Chart, source BLS, below]
- accelerating subgroups: Housing, Apparel, Transport, Recreation (66.2%). Decelerating: Food&Bev, Other (20.2%). Med Care & Educ/Comm unch.
- Both primary rents (+2.7% y/y) and OER (+2.1% y/y) are accelerating – by which I mean they are inflating at a faster y/y pace.
- Median CPI from the Cleveland Fed was +0.2%, and the y/y rate steady at 2.3%. The recent disinflation is an illusion.
The first supplementary chart is for core goods and core services. The sum of these two (weighted, of course) is core CPI. As you can see, it was the decline in the core services component (notably housing) that drove the decline in core CPI in the late ‘Aughts; the overall core number was temporarily kept afloat by the rise in core goods, but the crisis caused that to collapse as well.

Over the last couple of years, core services have returned to 2.5%, and core inflation is only as low as 2% now because core goods prices have begun to decline again. However, taking a broader view, it appears to me that the disinflation in goods from the early 90s to the early 00s is over and that goods prices are gradually taking a higher track. I’ve written previously about the possibility that the “globalization dividend” in terms of disinflationary pressures has shown some signs of ebbing. Obviously, should core goods inflation return to the levels it achieved a year ago (2.2% in November and December), overall core inflation would be comfortably above 2% even if core services inflation did not continue to accelerate.
In a non-CPI related note, New York Fed President Bill Dudley said today that the Fed won’t be “hasty” to pull back easy money: “If we were to see some good news on growth I would not expect us to respond in a hasty manner.” This confirms what we already knew – the Fed is willing to risk letting the inflation genie out of the bottle. Now, faster growth is not actually causal of inflation, as I frequently point out, so not responding to growth is ironically the right strategy, but it’s important to consider the reasons he gives for this policy. He is not saying that the Fed will not respond to growth because growth is not something they can affect; what he’s actually saying is that (since the Fed believes they can affect growth meaningfully) there is a very high hurdle to tightening even if prices accelerate somewhat further as long as growth remains slow.
So in what I think is the most likely case, continued slow growth with rising inflation, the Fed wouldn’t likely start to tighten the screws until core inflation was near 3% (and more importantly, until the economists who are modeling inflation as a function of growth decide they’re wrong, and stop forecasting a decline from whatever level we are at today). Since there is a significant delay of at least 6 months from Fed action to any effect on prices, this means that core inflation could easily get comfortably above 3% before any Fed action took effect – and, with the amount of money they’d need to withdraw, and the likelihood that they would start timidly, I have no idea how long it would take for them to stop an inflationary process which, at that point, would have considerable momentum.
So, in summary, this will not be the last uptick we see in core inflation.