Archive
Which Rates Are Converging?
In early 2020, global nominal interest rates converged around zero, with the US (at the 10-year maturity point) under 1% and the EU slightly negative. The monetary spigots were on, and central banks coordinated to squirt liquidity everywhere they could. Since that time, as monetary policy has diverged somewhat, nominal interest rates have diverged. Notably, Japanese rates remained lower than other developed country rates, but in general the picture spread out a bit.

What is interesting, though, is that this behavior of nominal rates obscures what is really happening ‘under the hood’ so to speak. Recall that nominal rates are (approximately) the sum of real rates – the cost of money – and compensation for expected inflation. Thanks to the CPI swaps market and/or the inflation-indexed bond market, we can break nominal rates into these two components. The evolution of those two components tells very different stories depending on the country or region. For the purposes of this article, I’m considering the US, EU, Japan, and the UK. Obviously the UK is the smallest economic unit there but they have the oldest inflation-linked bond market so they’re a crowd favorite.
In 2020, the UK had the highest implied inflation of this set, and the lowest real rates. In the UK, long-term real rates have been persistently very much lower than in the rest of the developed world, mainly because pension fund demand caused long-term linkers to be outrageously expensive.[1] On the other end of the curve, investors in Japanese inflation have persistently priced near-deflation so that in 2020 Japan had the lowest implied inflation and the highest real rates. So, even though Japan and the UK had very similar 10-year nominal rates, the composition of those real rates was wildly different. Note that in the second chart below, I am representing real rates as the spread between LIBOR/SOFR rates and the CPI swap rates, rather than looking at the inflation bond yields.[2]


Collectively, what these charts say is that inflation expectations across many disparate economies are converging, and right now that convergence looks like it’s headed to roughly where the US is at 2.5% (adjusting for differences in index composition). On the other hand, the cost of money is not noticeably converging, although real rates are gradually rising across many economies. Real interest rates are supposed to roughly reflect equilibrium economic growth, so the picture seems to be of gradually strengthening long-term equilibrium growth expectations across the US, EU, Japan, and UK, with the US having the strongest expected growth and Japan the weakest. Notably, the UK real rate has moved above the EU’s rate, which seems to make sense to me given the hot mess Europe is right now.
I don’t think this has any hot money trading implications. But I do think it’s useful to understand that while nominal rates remain different across economies, that’s becoming more and more due to differences in real rates and less and less due to differences in expected inflation rates. Of course, you can also see that the average cost of money globally is rising. Eventually, that could cause issues for other asset classes.
[1] Naturally, there are also some differences in the inflation definitions from one country to the next, and differences in what index is used for inflation swaps, which can account for some of these differences and explain why they never will, nor should, fully converge. I am abstracting from these differences; just look at the overall trend rather than try to read too much into the absolute differences, which may have good economic reasons.
[2] One reason I am doing so is that the JGBi bonds, unlike the inflation bonds in the US, UK, and Europe, do not have a deflation floor so that when inflation is very low, the real yields on those bonds naturally diverge because of the value of the embedded deflation floor. Which isn’t what we’re trying to look at. [ADDENDUM – A reader pointed out that I am very old. What I call the “new JGBis” do in fact have the deflation floor. The “new ones” have been issued since…2013. So this turns out to not be a very good reason supporting the way I’m doing this. Man, time flies.]
Where Inflation Stands in the Cycle
It’s important, I think, that I occasionally remind readers of a fact that is supported by overwhelming quantitative evidence, and yet virtually ignored by a wide majority of economists (and central bankers): inflation is a consequence of the stock of money growing faster than real economic growth. Period.
MV=PQ
That doesn’t mean that forecasting inflation is easy if we remember that fact, but at least we can make good directional predictions when, say, the stock of money rises 25% in a year, instead of mouthing some nonsense about inflation in such a case being “transitory.”
However, I realize that when someone mentions that equation a lot of people tune out, thinking this has become a religious argument between monetarists and Keynesians. So let me toss out some data. Keep in mind, there is measurement error in statistics for the money supply, real GDP (especially), and prices. And, as I’ve written before, sharp changes in M can cause a short-term impact on velocity until Q and P can catch up – my ‘trailer attached by a spring’ analogy. But over time, a shock move in velocity becomes less important (and reverses, which is what we are in the middle of), and so we would expect by simple algebra to see that a good prediction of the change in the price level is given by M/Q. Is it?
First let me share one of my favorite charts from a Federal Reserve Economic Review.[1] I’ve been using this for years.

This is over 5-year periods, and you can see that there’s a pretty good correlation – especially for large changes – in the change in the ratio of money/income and the change in prices. (By the way, the original article is still worth reading).
Here is another chart from that note, updated by me through the end of 2022.
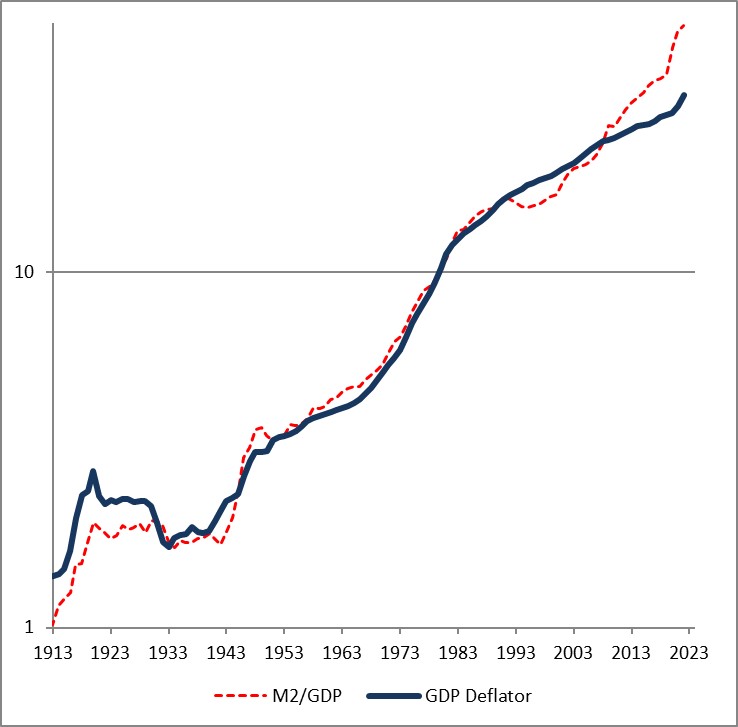
The fact that the price level has gone up a little bit less than the ratio of money to GDP over time is a reflection of the fact that money velocity has gone down slightly, and then more quickly, over the last 110 years. If you think velocity will fully revert, then the blue line will eventually converge with the red line – but in my mind there’s no reason to believe that velocity is stable or entirely mean-reverting over time…only that it doesn’t permanently trend higher or lower like money, prices, and GDP do.
Obviously, this leads us to the question of where we are now. Here is a chart of the change in headline prices (CPI) as a function of the change in M/Q for five countries/regions.
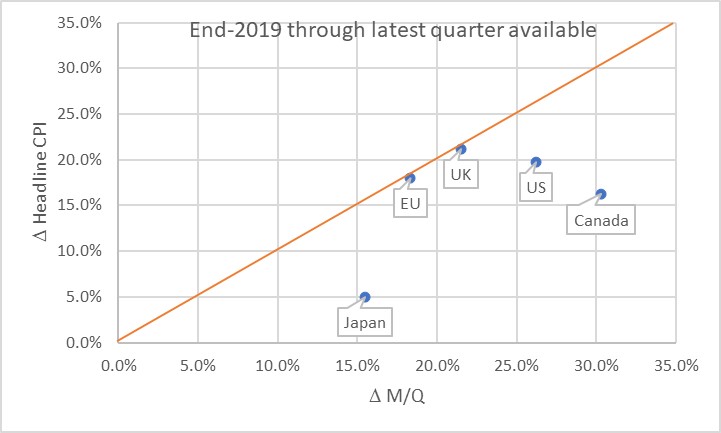
The chart basically says that the UK and EU have seen prices move almost exactly what you would have predicted, if you could have known in advance what M and Q were going to do. Naturally, none of us knew that. Japan, the US, and Canada haven’t seen prices rise as much as you would have expected, yet. Some of the reason why not is the effect I mentioned earlier: the dump of money into accounts during COVID was so fast that there was no time for prices to adjust. Actually, it’s only this close because food and energy adjust more rapidly…if you look at the picture with just core inflation, it appears there’s still some lifting to do to get back to the 45-degree line. As energy prices and food prices mean-revert some, core inflation should stay a little bubbly for a while.
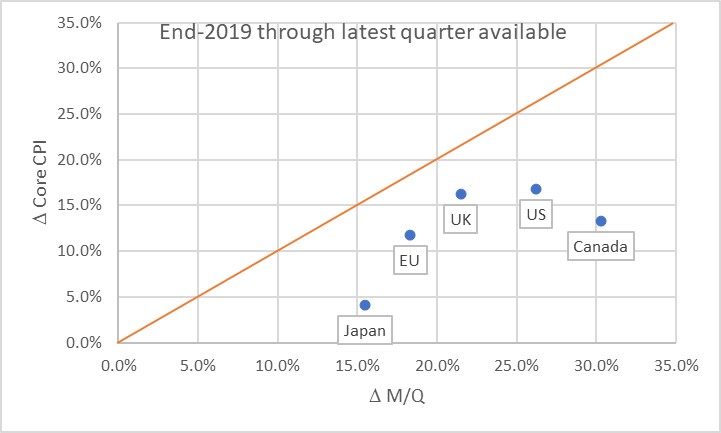
Now, there’s three ways to get back to the line. We can see prices rise. We can see GDP rise. Or we can see the money supply fall. The latter two effects are better for consumers. The “GDP rises” is the best for everyone, although that’s the slowest-moving of the pieces. The “money supply fall” option is the best for consumers, but the worst for investors. Presently, we’re seeing a little bit of all three. But here is where I should take a moment to highlight how important the Fed’s balance sheet reduction has been in this process. Here is a chart from 2019Q4 to the present, just for the US, showing how this relationship developed over time.
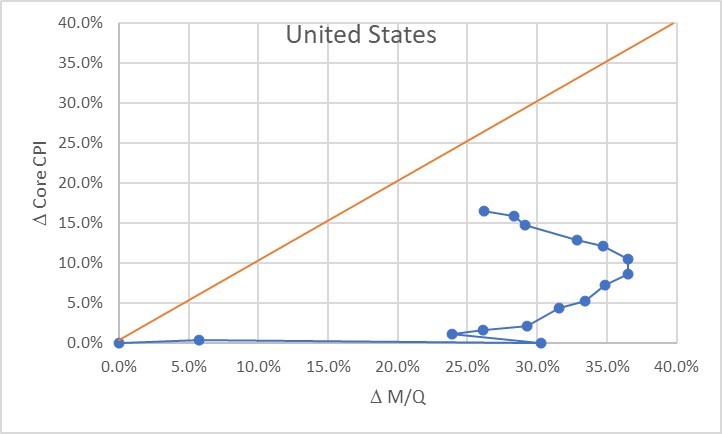
Initially, of course, there was a massive increase in money with no change in prices, as COVID hit in 2020. The point at (30%, 0%) is what the Fed had to work with as the lockdowns began to be lifted in late summer 2020. The sharp single-quarter reversal there was the result of the massive GDP spike in 2020Q3.
At that point, we would have anticipated that if nothing else happened, we would see a gradual 23% or so increase in the price level. If the Fed had immediately pulled back on the money printing, probably a lot less. Instead, the money printing continued for quite a while until by the middle of 2022 we were looking at a change in M/Q of about 37% since the end of 2019. Right about that time, the Fed got alarmed and began to shrink the balance sheet (and hike rates, although you will notice that the price of money does not show up on this chart but only its quantity!) That, combined with some decent growth, has decreased the pent-up pressure on prices. As of the end of 2023Q3, the aggregate M/Q change was 26.2%, while core prices had risen 16.4% (headline prices, including a 33% increase in energy and a 25% increase in food prices, are up 19.5% since the end of 2019).
If the money supply grows only at the rate of GDP from here, then this line will turn vertical and we have about a 10% increase in core inflation to ‘make up’ before we are back on the line. The good news is that the Fed currently is still reducing its balance sheet; the bad news is that M2 since April has stopped declining. More bad news is that GDP is likely to be soft or even negative here over the next few quarters, judging from payrolls, delinquencies, and other data. We could also hold out hope that velocity won’t fully rebound to pre-COVID levels, but there’s no reason other than “it sure would be nice if that happened” to expect that. Ergo, I think we’re still looking at higher-for-longer not just in the interest rate structure, but in the trajectory of inflation.
The most astonishing point on the charts above, in my mind, is the Japan point especially on the first chart. The amazing part isn’t that Japan’s inflation rate is lower than that of other countries here. They’ve added less money, so as a first pass you’d expect less inflation. But what’s amazing is that the Yen is also an absolute basket case, which means that imports – like, say, oil or gasoline – have gone up a lot more in price than for other countries. Crude oil in USD has risen about 22% in USD terms since the end of 2019. It’s up 66% in Yen terms! And yet, even with that Japanese inflation has stayed relatively low. So far. These charts tell me that I’d want to buy Japanese inflation and sell EU and UK inflation, where prices are closer to already reflecting the effect of the money geyser than they are in Japan.
[1] “Are Money Growth and Inflation Still Related?”, Economic Review, Federal Reserve Board of Atlanta, 2nd Quarter, 1999. https://www.atlantafed.org/-/media/documents/research/publications/economic-review/1999/q2/vol84no2_dwyer-hafer.pdf
Inflation-Related Impressions from Recent Events
It has been a long time since I’ve posted, and in the meantime the topics to cover have been stacking up. My lack of writing has certainly not been for lack of topics but rather for a lack of time. So: heartfelt apologies that this article will feel a lot like a brain dump.
A lot of what I want to write about today was provoked/involves last week. But one item I wanted to quickly point out is more stale than that and yet worth pointing out. It seems astounding, but in early August Japan’s Ministry of Health, Labour, and Welfare reported the largest nominal wage increase in 1997. (See chart, source Bloomberg). This month there was a correction, but the trend does appear firmly upward. This is a good point for me to add the reminder that wages tend to follow inflation rather than lead it. But I believe Japanese JGBis are a tremendous long-tail opportunity, priced with almost no inflation implied in the price…but if there is any developed country with a potential long-tail inflation outcome that’s possible, it is Japan. I think, in fact, that if you asked me to pick one developed country that would be the first to have “uncomfortable” levels of inflation, it would be Japan. So dramatically out-of-consensus numbers like these wage figures ought to be filed away mentally.

While readers are still reeling from the fact that I just said that Japan is going to be the first country that has uncomfortable inflation, let me talk about last week. I had four inflation-related appearances on the holiday-shortened week (! is that an indicator? A contrary indicator?), but two that I want to take special note of. The first of these was a segment on Bloomberg in which we talked about how to hedge college tuition inflation and about the S&P Target Tuition Inflation Index (which my company Enduring Investments designed). I think the opportunity to hedge this specific risk, and to create products that help people hedge their exposure to higher tuition costs, is hugely important and my company continues to work to figure out the best way and the best partner with whom to deploy such an investment product. The Bloomberg piece is a very good segment.
I spent most of Wednesday at the Real Return XII conference organized by Euromoney Conferences (who also published one of my articles about real assets, in a nice glossy form). I think this is the longest continually-running inflation conference in the US and it’s always nice to see old friends from the inflation world. Here are a couple of quick impressions from the conference:
- There were a couple of large hedge funds in attendance. But they seem to be looking at the inflation markets as a place they can make macro bets, not one where they can take advantage of the massive mispricings. That’s good news for the rest of us.
- St. Louis Fed President James Bullard gave a speech about the outlook for inflation. What really stood out for me is that he, and the Fed in general, put enormous faith in market signals. The fact that inflation breakevens haven’t broken to new highs recently carried a lot of weight with Dr. Bullard, for example. I find it incredible that the Fed is actually looking to fixed-income markets for information – the same fixed-income markets that have been completely polluted by the Fed’s dominating of the float. In what way are breakevens being established in a free market when the Treasury owns trillions of the bonds??
- Bullard is much more concerned about recession than inflation. The fact that they can both occur simultaneously is not something that carries any weight at the Fed – their models simply can’t produce such an outcome. Oddly, on the same day Neel Kashkari said in an interview “We say that we have a symmetric view of inflation. We don’t mind if it’s 2.1 or 1.9, but in our practice, in what we actually do, we are much more worried about high inflation than we are low inflation. And I think that that is the scar from the 1970s.” That’s ludicrous, by the way – there is no way in the world that the Fed would have done the second and third QEs, with the recession far in the rear view mirror, if the Fed was more concerned with high inflation. Certainly, Bullard showed no signs of even the slightest concern that inflation would poke much above 2%, much less 3%.
- In general, the economists at the conference – remember, this is a conference for people involved in inflation markets – were uniform in their expectation that inflation is going nowhere fast. I heard demographics blamed (although current demographics, indicating a leftward shift of the supply curve, are actually inflationary it is a point of faith among some economists that inflation drops when the number of workers declines. It’s actually a Marxist view of the economic cycle but I don’t think they see it that way). I heard technology blamed, even though there’s nothing particularly modern about technological advance. Economists speaking at the conference were of the opinion that the current trade war would cause a one-time increase in inflation of between 0.2%-0.4% (depending on who was speaking), which would then pass out of the data, and thought the bigger effect was recessionary and would push inflation lower. Where did these people learn economics? “Comparative advantage” and the gain from trade is, I suppose, somewhat new…some guy named David Ricardo more than two centuries ago developed the idea, if I recall correctly…so perhaps they don’t understand that the loss from trade is a real thing, and not just a growth thing. Finally, a phrase I heard several times was “the Fed will not let inflation get out of hand.” This platitude was uttered without any apparent irony deriving from the fact that the Fed has been trying to push inflation up for a decade and has been unable to do so, but the speakers are assuming the same Fed can make inflation stick at the target like an arrow quivering in the bullseye once it reaches the target as if fired by some dead-eye monetary Robin Hood. Um, maybe.
- I marveled at the apparent unanimity of this conclusion despite the fact that these economists were surely employing different models. But then I think I hit on the reason why. If you built any economic model in the last two decades, a key characteristic of the model had to be that it predicted inflation would be very low and very stable no matter what other characteristics it had. If it had that prediction as an output, then it perfectly predicted the last quarter-century. It’s like designing a technical trading model: if you design one that had you ‘out’ of the 1987 stock market crash, even if it was because of the phase of the moon or the number of times the word “chocolate” appeared in the New York Times, then your trading model looks better than one that doesn’t include that “factor.” I think all mainstream economists today are using models that have essentially been trained on dimensionless inflation data. That doesn’t make them good – it means they have almost no predictive power when it comes to inflation.
This article is already getting long, so I am going to leave out for now the idea I mentioned to someone who works for the Fed’s Open Market Desk. But it’s really cool and I’ll write about it at some point soon. It’s an idea that would simultaneously be really helpful for investors and help the Fed reduce a balance sheet that they claim to be happy with but we all really know they wish they could reduce.
So I’ll move past last week and close with one final off-the-wall observation. I was poking around in Chinese commodity futures markets today because someone asked me to design a trading strategy for them (don’t ask). I didn’t even know there was such a thing as PVC futures! And Hot Rolled Coils! But one chart really struck me:

This is a chart of PTA, or Purified Terephthalic Acid. What the heck is that? PTA is an organic commodity chemical, mainly used to make polyester PET, which is in turn used to make clothing and plastic bottles. Yeah, I didn’t know that either. Here’s what else I don’t know: I don’t know why the price of PTA rose 50% in less than two months. And I don’t know whether it is used in large enough quantities to affect the end price of apparel or plastic bottles. But it’s a pretty interesting chart, and something to file away just in case we start to see something odd in apparel prices.
Let me conclude by apologizing again for the disjointed nature of this article. But I feel better for having burped some of these thoughts out there and I hope you enjoyed the burp as well.
Central Banking Tragedy: The Case of Japan
Today I want to talk about one of the real tragedies of monetary policy and inflation: Japan.
The tragedy is that the mystery of the deflation in Japan is no mystery at all. The cure also was no mystery. So the tragedy is that these were both treated as mysteries by the central bank, which stumbled on the right response and then stumbled right back out of it again.
The chart below shows the money supply and core inflation history of Japan going back into the 1990s. Core inflation is in red (I’ve interpolated through the sales-tax-induced spike) and M2 growth is in blue. The cause of the disinflation is pretty plain: between 1998 and 2013, year/year money growth in Japan never exceeded 4%. From 1999 to 2013, Japanese M2 rose 38% in aggregate; in the US it rose 138% over the same period. It is very hard to get inflation, especially in an environment of declining interest rates, if the money supply is increasing at or somewhat less than the rate of potential GDP growth.

However, in the middle of 2013 Japanese Prime Minister Shinzo Abe persuaded Bank of Japan governor Haruhiko Kuroda to promise to double the money supply in two years, by pursuing massive QE. Although that turned out to be an exaggeration, M2 growth did peek out from behind 4%, and inflation started to perk up as well. It wasn’t a lot, but inflation in 2013 reached new 14-year highs and the economy was officially out of deflation. While QE made very little sense, at least the QE2 and later versions, in the US where inflation was positive and money growth was adequate, it made a ton of sense in Japan. In fact, if Japan had been the only country pursuing QE, I can make the argument that the yen would have likely depreciated substantially and caused inflation in that country.
In the US, the central bank pursued QE and risked inflation to hopefully spur GDP growth. But in Japan, both of those were desirable outcome. There was no reason not to pursue QE in Japan.
But the Bank of Japan lost faith in the power of money growth to cause inflation. While the BoJ continued asset purchases, those purchases diminished and the rate of increase in the central bank’s balance sheet declined from roughly 50% y/y in 2014 to around 8% today (see Chart, source Bloomberg).

Instead, the Bank decided to deploy negative interest rates, dropping the policy rate to -0.10% from +0.10% in early 2016. They did this partly because it was a central bank fad in 2015 and 2016 to experiment with negative interest rates, despite the fact that we have no idea (and no guidance from theory) about what happens to monetary velocity at negative interest rates. I wrote the following in our quarterly piece on February 20, 2016 (and I think it’s been long enough that it’s fair to put it in the public domain as our customers have had plenty of time to read it in private!). I quote at length because, frankly, it was pretty good:
“…the question of what happens to monetary velocity at negative interest rates is one worth considering since several central banks (the latest one being the Bank of Japan) are now implementing monetary policy with a negative policy rate.
“Why the Bank of Japan is doing so is beyond us. Abstracting from the sales-tax related hike, it has successfully eliminated deflation, driving core inflation from -1.5% to near +1.0% since mid-2010. It has done so, very simply, by working to accelerate money supply growth from the 1.5%-2.0% growth that was the standard in the late pre-crisis period to over 4% by 2014 and 2015.
“This isn’t rocket science; it’s monetary science.
“Now, recently money supply growth has begun to fall off, so the BoJ likely was concerned by that development and wanted to find a way to ensure that inflation doesn’t slip back. If that was their intention, then cutting rates was probably the wrong thing to do. As Friedman explained decades ago, and we have illustrated here repeatedly, money velocity is strongly tied to the level of interest rates. Lower interest rates imply less reason to not hold cash; ergo real cash balances rise and the inverse of the demand for real cash balances is velocity.
“But we said “probably” the wrong thing to do for one reason: we don’t really know whether this relationship holds when interest rates cross the negative bound. It may be the case that this relationship ceases to apply at negative rates even though Friedman’s idea is based on the relative difference between cash yielding zero and longer-term investments or consumption alternatives. The reason that velocity might behave differently at sub-zero rates is that people respond asymmetrically to losses and gains. That is, the pleasure of a gain is dominated by the pain of the same-sized loss, in most people. This cognitive bias may cause savers/investors to behave strikingly different if they are charged for deposits than if they are merely paid zero on those deposits (even if zero is lower than other available rates). In that case, we might see a spike in money velocity once rates go through zero as cash balances become hot-potatoes, just as they would if investment opportunities suddenly appeared. Now, we need to make several observations.
“First, there is no data to suggest this effect exists. What we have posited in the preceding paragraph is rank speculation. (But, unlike the various central banks, we’re not betting our entire monetary policy on that speculation).
“Second, while we don’t really think this effect exists, if it does exist then we would expect it to be a spot discontinuity in the relationship between rates and velocity. That is, the behavior should change between 0% and some negative rate, but then be somewhat linear thereafter. Cognitively, the reaction is both a general loss aversion, which is linear but no different at negative rates from zero, and a behavioral “endowment” reaction that is to the “taking” of money from a person and not necessarily related to the size of the theft.
“Third, if this effect does exist it still doesn’t mean that cutting rates to a negative rate was wise for the Bank of Japan. After all, quantitative easing has done a fine job of pushing up inflation, and so there is no reason to take a speculative gamble like this to keep inflation moving higher. Just do more of the same.
“Fourth: more likely, the BoJ is doing this because it believes that negative rates will stimulate growth. This is much more speculative than you might think, and we may be overgenerous in phrasing the point that way. In any case, any growth benefit would stem either from weakening the currency (which QE would also do, with less risk) or from provoking investment in more marginal ventures that become acceptable at lower financing rates. We call that malinvestment, and it isn’t a good thing.
“Inflation was moving higher in Japan. As long as QE continues (with, or without negative rates), then inflation should continue to move higher. But if the BoJ abandons its successful anti-deflation policy because it was not effective at increasing growth, then it is likely to end up with neither inflation nor growth.”
So, this is the tragedy. As the first chart above illustrates, increasing asset purchases seemed to increase the money supply and inflation; however, cutting interest rates had the evident effect of decreasing monetary velocity enough to push the Japanese economy back to near-deflation. It’s tragic, because they had the right policy and essentially for the right reasons, but changed it to the wrong policy for reasons that are tied to economic dogma which happens to be incorrect (that the act of lowering interest rates causes inflation).
It isn’t the only tragedy to be visited on global economies by too-smart-by-half central bankers, but it is one of the most tragic because they were on the right track before their buddies in the central bankers’ club persuaded them to change tack. It’s like the alcoholic who, having suffered into sobriety, is tempted by friends to have a ‘social drink’ and ends up back in the bottle. At this stage, there is no longer any way for this to end well.
Japan Is Doomed. Again.
Japan is doomed. Again.
A couple of years ago, the Bank of Japan began to pursue QE, with the intention of doubling its money supply. While this is a bad plan for almost every country, it was exactly the right plan for Japan, whose economy had been mired in deflation from 1999 until this policy began (see chart, source Bloomberg).

To a monetarist, it was no surprise that Japan was experiencing deflation. Since the early 1990s, annual money supply growth in Japan has been below 4% (see chart, source Bloomberg). It averaged 2.4% from 1992-2012. (The new policy pushed M2 growth above 4% for the first time since the 1990s, albeit briefly as it turned out).

Remember, the monetarist equation says MV≡PQ. With unchanged money velocity and an economy with, say, a 3% potential growth rate in GDP, a 2.4% growth in M2 should result in deflation. And, in fact, just as in the US lower interest rates in Japan produced lower monetary velocity.
Quantitative easing does nothing to help economic growth, and so QE was the wrong prescription for most of the world after 2010. But if deflation is your disease, QE is your cure and that is Japan’s situation. When the BOJ decided to start QE, money supply growth moved above 4% for the first time in years, and “miraculously” core inflation moved above zero as the first chart above illustrates. (Abstract from the spike over 2%, which was due to a one-time consumption tax effect; but core inflation in Japan was over 1% even excluding that spike). When that happened, I wrote in our Quarterly Inflation Outlook that Japan was no longer the poster child for inept central banking; that award had been moved to the European Central Bank.
Unfortunately, even though QE did exactly what it was supposed to do, to Japanese policymakers it seemed to have failed because their intention had been to raise real growth. So, since the hammer they were using did not function very well as a saw, they discarded the tool.
Japan’s problems with growth are structural. There’s not a lot that can be done, and nothing that can be done in the short run and with monetary policy, about the demographic train wreck they are experiencing. But the problem with inflation was, and is, fixable. But only if the Bank of Japan does QE, and a lot of it, and keeps doing it. As they shifted from straight QE to targeting negative interest rates, money supply growth began to ebb (now back to 3.3% y/y) and inflation began to roll over (now 0.3% ex-food-and-energy). Indeed, with lower rates the BOJ is making it worse by helping to push money velocity even lower.
There had been hope that the BOJ might abandon the NIRP experiment, which was clearly not working by every metric you can use to measure it, and go back to the policy that had been working at least with respect to the fixable problem. But instead, last night the Bank of Japan “shifted the policy framework” to targeting the yield curve. According to the Bloomberg story, the Bank is moving away from a “rigid target for expanding the money supply, while seeking to control bond yields across different maturities.”
So money? The heck with that. We just want to make sure that prices are at the “right” levels. Clearly, the BOJ thinks the market is totally failing when it comes to setting the interest rate correctly (to be fair, all central banks seem to now view interest rates as a tool rather than an indicator, as they used to), and so it is assuming control of that job. Clearly, only the wise policymakers at the BOJ can divine the right level for interest rates: the one which leads to great growth and moderate inflation for the country. Sure.
Japan had a chance. Whether by design or pure chance, they had stumbled on the policy that was able to banish the deflation that had plagued them, and perverted decision-making, for two decades. But because they are pursuing a pot of gold at the end of the rainbow – growth springing from monetary policy in the same way that you can plant olive trees and harvest carrots – they abandoned the working policy to pursue one that has no chance of success.
Japan is back in its comfort zone: the developed world’s basket case. Congratulations to the Bank of Japan.
The IMF Tries to Cause Japanese Unemployment
It is rare that I write early on a Monday morning, but today there is this. A story on Bloomberg highlighted the pressure that the IMF is putting on Japan to institute an “incomes policy” designed to nudge (and force, if necessary) companies to increase wages. IMF mission chief for Japan told reporters a couple of weeks ago that “we need policies to support wage increases in Japan;” the Bloomberg article also names a former IMF chief economist and the current president of the Peterson Institute for International Economics as proposing an immediate boost of salaries of 5-10% for unionized workers.
It is truly appalling that global economic policymakers are essentially illiterate when it comes to economic history. The IMF suggestion to institute wage hikes as part of triggering inflation is not a question of misunderstanding macroeconomic models (although it manages to do this as well, since wages follow prices and thus increasing wages won’t cause inflation unless other conditions obtain). At some level, it is a question of ignorance of history. After the stock market crash in 1929, President Hoover persuaded major industrial firms (such as GM, U.S. Steel, and the like) to hold wages constant or raise them. Since prices were falling generally, this had the effect of raising the real cost of production, which of course worsened the subsequent Depression. According to one analysis, this single decision caused GDP loss in the Great Depression to be triple what it otherwise would have been if wages were allowed to adjust (because, again, wages follow prices and are the main mechanism by which a surplus or shortage of labor is cleared). It wasn’t just Hoover, of course: later, FDR established the National Recovery Administration to administer codes of “fair competition” for every industry that established minimum wages and prices. The NRA was struck down in large part by the Supreme Court, but the notion of arresting deflation by adjusting wages was quickly reintroduced in the National Labor Relations Act of 1935.
There is wide agreement, although I am sure it is not universal, that preventing markets from adjusting is a big part of what made the Great Depression so Great. And this isn’t theory…it’s history. There is no excuse, other than ignorance, for policymakers to whiff on this one.
Deflation can be bad, but it doesn’t need to come with massive unemployment. In Japan, it has not: the unemployment rate is 3.1%, the lowest it has been since 1995. But push wages higher artificially, and Japan can have the massive unemployment as well. Thanks, IMF.
Why So Negative?
The news on Friday that the Bank of Japan had joined the ECB in pushing policy rates negative was absorbed with brilliant enthusiasm on Wall Street. At least, much of the attribution for the exceptional rally was given to the BoJ’s move. I find it implausible, arguably silly, to think that a marginal change in monetary policy by a desperate central bank on the other side of the world – however unexpected – would have a massive effect on US stocks. Subsequent trading, which has reversed almost all of that ebullience in two days, suggests that other investors also may agree that just maybe the sorry state of earnings growth rates in this country, combined with a poor economic outlook and still-lofty valuations, should matter more than Kuroda’s gambit.
To be sure, this is a refrain that Ben Bernanke (remember him? Of helicopter infamy?) was singing last month, before the Federal Reserve hiked rates impotently, and clearly the Fed is investigating whether negative rates is a “tool” they should add to their oh-so-expansive toolbox for fighting deflation.
Scratch that. The Fed no longer needs to fight deflation; inflation is at 2.4% and rising. The toolbox the Fed is interested in adding to is the one that contains the tools for goosing growth. That toolbox, judging from historical success rates, is virtually empty. And always has been.
Back to Japan: let me point out that if the BOJ goal has been to extinguish deflation, it has already done so. The chart below (source: Bloomberg) shows core inflation in Japan for the last 20 years or so. Abstracting from the sales-tax-related spike, core inflation has risen fairly steadily from -1.5% to near 1.0% since mid-2010.

They did this, very simply, by working to accelerate money supply growth from the 1.5%-2.0% growth that was the standard in the late pre-crisis period to over 4% by 2014 and 2015 (see chart, source: Bloomberg).

Not rocket science, folks. Monetary science.
Now, recently money supply growth has begun to fall off, so the BoJ likely was concerned by that and wants to find a way to ensure that inflation doesn’t slip back. If that was their intention, then cutting rates was exactly the wrong thing to do. The regression below (source: Bloomberg) illustrates in a different way what I have shown here before: interest rates and money velocity are closely tied (as Friedman explained decades ago). The r-squared of this relationship – assuming that functionally a linear fit is appropriate, which I am not sure of – is a heady 0.822.

You may notice the data is from the US; that’s because Bloomberg doesn’t have a good velocity series for Japan’s M2 but the causal relationship is the same: lower term interest rates imply less reason not to hold cash.
Now, it may be the case that this relationship ceases to apply at negative rates even though the idea is based on the relative difference between cash yielding zero and longer-term investments or consumption alternatives. The reason that velocity might behave differently at sub-zero rates is that people respond asymmetrically to losses and gains. That is, the pleasure of a gain is dominated by the pain of the same-sized loss, in most people. This cognitive bias may cause savers/investors to behave strikingly different if they are charged for deposits than if they are merely paid zero on those deposits (even if zero is lower than other available rates). In that case, we might see a spike in money velocity once rates go through zero as cash balances become hot-potatoes, just as if investment opportunities suddenly appeared. And rates, not just overnight but term rates, just went negative in Japan. The chart below (source: Bloomberg) shows the 5y JGB rate.

Several observations:
- The speculation that sub-zero rates might cause a rise in velocity is just that: speculation. There’s no data to suggest that this effect exists.
- Frankly, I suspect it doesn’t, but it’s possible. However, if it does I would expect it to be a spot discontinuity in the relationship between rates and velocity. That is, the behavior should change between 0% and some negative rate, but then be somewhat linear thereafter. Cognitively, the reaction is both a general loss aversion, which is linear but no different at negative rates from zero, and a behavioral “endowment” reaction that is to the “taking” of money from a person and not necessarily related to the size of the theft.
- If it does exist, it still doesn’t mean that cutting rates to a negative rate was wise. After all, quantitative easing has done a fine job of pushing up inflation, and so there is no reason to take a speculative gamble like this to keep inflation moving higher. Just do more of the same. Lots more.
- More likely, the BoJ is doing this because they believe that negative rates will stimulate growth. This is much more speculative than you might think, and I may be overgenerous in phrasing the point that way. In any case, any growth benefit would stem either from weakening the currency (which QE would also do, with less risk) or from provoking investment in more marginal ventures that become acceptable at lower financing rates. We call that malinvestment, and it isn’t a good thing.
- Whatever the point of the BoJ’s move, the size of any growth effect from currency reactions is utterly dependent on the reaction function of trading counterparties. If other countries seek to devalue their currencies as well, then the whole operation will be inert.
So, will the BoJ’s move save US stocks? Heck, it won’t even save the Japanese economy.
Median Inflation vs Mediocre Growth
A reader pointed out to me today a piece by Amy Higgins and Randal Verbrugge on the Cleveland Fed’s website entitled “Is a Nonseasonally Adjusted Median CPI a Useful Signal of Trend Inflation?” I will let readers draw their own conclusions about the new measure that Higgins and Verbrugge are proposing, but I wanted to point out the research because I often cite Median CPI as the best way to look at the central tendency of inflation (what the researchers call “trend inflation”) and this article confirms and reinforces that point of view.
And it is worth looking, therefore, at the recent movements in Median CPI. Yes, I know you’ve seen this over and over from me, but take a look anyway (chart is sourced from Bloomberg).

I don’t believe for a second that the FOMC is unaware of this picture; nor, however, do I believe they really care equally about inflation and growth. The talk right now is moderately hawkish, and with growth fair and inflation heading higher it is time to withdraw reserves. Indeed, it is long past time. As I have said for a while, the time to withdraw reserves was roughly when the Fed was busy implementing their last QE. Also note that I am not saying “raise rates,” since raising rates is an effect of withdrawing reserves and it is the withdrawal of reserves, not the raising of rates, that matters.
Practically speaking, since growth is slowing, the Fed is now back in a pickle of its own making. Inflation is clearly heading higher; growth is probably heading lower. If the FOMC had a balanced mandate (inflation and employment equal) then they would probably be at a neutral rate right now, so that would argue for tightening. But the FOMC has nothing remotely close to a balanced mandate. Against all evidence that monetary policy can affect inflation but not growth, the Fed is totally biased to act to support growth. The bankers believe that slow growth solves the inflation problem, so they should fight recession and just worry about inflation when growth gets “too hot.” Therefore, I currently do not expect the Fed to tighten in December.
Moreover, this increase in core or median inflation is happening in most major economies (with the notable exception of the UK, where it was nearing 4% in 2011 but has gradually come back to around 1%). This is in contrast to the conventional wisdom being propagated that inflation is falling everywhere. Consider the chart below, which is of core Japanese CPI (with the effect of the one-off tax increase in 2014 smoothed out).

Core inflation in Japan is the highest it has been in more than 17 years. Seventeen years. Tell me again how the BOJ’s money printing is having no effect? It is having no effect on growth, but it is doing what we would expect it to do on inflation.
Eurozone inflation is rising less impressively (see chart), but still rising. But then, the ECB has been less aggressive on monetary policy than either the US or Japan. Still, Europe is not, as the popular press would have you believe, flirting with deflation.

All of these economies are only flirting with deflation if you include energy quotes (these pictures may be worse if we had median CPI rather than core CPI for these economies). Now, energy quotes matter, just as much when they are going down as when they are going up, but it is a separate question whether including energy is at all helpful for predicting future inflation. And the answer is, as the Higgins and Verbrugge point out: no, it really isn’t. We are entering a period with weakening growth and strengthening inflation.
This should be “fun.”
Dollar Rally Does Not Demand Deflation – Duh
There are many funny stories out about disinflation these days. The meme has gotten amazing momentum, even more than it usually does at this time of year (see my post last month, “Seasonal Allergies“). One of the most amusing has been the idea that the decision by the Bank of Japan to greatly increase its quantitative easing would be disinflationary in the U.S., because the yen would decline so sharply against the dollar, and dollar strength is generally assumed to be disinflationary.
The misunderstanding of the dollar effect is amazing, considering how easy it is to disprove. Sure, I understand the alarm at the dollar’s recent robust strength. Of course, such a large and rapid move must be disinflationary, right? Because who could forget the inflationary spiral of 2002-2008 in this country, when the value of the dollar fell 25%?

For the record, when the dollar hit its high in February 2002, core inflation was at 2.6%. It declined to 1.1% in 2003, before rebounding to 2.9% in 2006 and was at 2.3% in April 2008, when the dollar reached its pre-crisis low. That is, the dollar’s protracted and large decline caused essentially no meaningful change in core inflation. Indeed, without the housing bubble, core inflation would have declined markedly over this period.
Now, headline inflation rose during that period, because energy prices rose. This may or may not be the result of the dollar, or the causality may run at least partly the other way (because the dollar was cheaper, and oil is priced in dollars, oil got comparatively cheaper in foreign currencies, leading to greater demand). But what is very clear is that the underlying rate of inflation was not impacted by the dollar.
The bifurcation of inflation into core inflation and energy inflation (or food and energy inflation, if you like, but most of the volatility comes from energy inflation) is a critical point for both investors and policymakers. Much ink has recently been spilled about how the Saudi decision to lower the price of oil to better compete with U.S. shale supply, and the burgeoning shale supply itself, is disinflationary. But it isn’t, and it is important to understand why. Inflation is a rate of change measure, and more to the point a change in prices is not inflation per se unless it is persistent. Policymakers don’t focus on core inflation because they don’t care about food or energy or think that we don’t buy them; they focus on core inflation because it is more persistent than food or energy inflation.
So if gasoline prices aren’t merely in their usual seasonal dip, but actually continue lower for another year, it will result in headline inflation that is lower than core inflation over that period. But once it reaches a new equilibrium level, that downward pressure on headline inflation will abate, and it will re-converge with core.
Oil prices, in fact, are almost always a growth story rather than an inflation story, and some of the big monetary policy crack-ups of the past have occurred when the Fed addressed oil price spikes (plunges) with tighter (looser) monetary policy. In fact, if any policy response is warranted it would probably be the opposite of this, since higher oil prices cause slower broad economic growth and lower oil prices cause faster broad economic growth. (However, long time readers will know that I don’t believe monetary policy can affect growth significantly anyway.)
Back, briefly, to the BOJ balance sheet expansion story. This was a very significant event for global inflation, assuming as always that the body follows through with their stated intention. Money printing anywhere causes the equilibrium level of nominal prices globally to rise. To the extent that this inflation is to be felt idiosyncratically only in Japan, then the decline of the currency will offset the effect of this global increase in prices so that ex-Japan prices are steady while prices in Japan rise…which is the BOJ’s stated intent. Movements in foreign exchange are best understood as allocating global inflation between trading partners. However, for money-printing in Japan to lead to disinflation ex-Japan, the movement in the currency would have to over-react to the money printing. If markets are perfectly efficient, in other words, the movement in currency should cause the BOJ’s idiosyncratic actions to be felt only within Japan. There are arbitrage opportunities otherwise (although it is very slow and risky arbitrage – better thought of as arbitrage in an economic sense than in a trading sense).
Of course, if the BOJ money-printing is not idiosyncratic – if other central banks are also printing – then prices should rise around the world and currencies shouldn’t move. This is why the Fed was able to get away with increasing M2 significantly without cratering the dollar: everyone was doing it. What is interesting is that the global price level has not yet fully reflected the rise in the global money supply, because of the decline in global money velocity (which is due in turn to the decline in global interest rates). This is the story that is currently being written, and will be the big story of the next few years.
As They Do, Not As They Say
Over the past week or two we have seen and heard from the Fed (in the minutes released on Wednesday), the ECB (after their April 3rd meeting), the BOJ (after their April 7th meeting), and the Bank of England (today). Having heard from the “big four,” I think it’s very interesting to compare what they seem to be indicating they will do to what they probably ought to do. (I am actually going to neglect the BOE, since their situation is quite complex at the moment and probably too much for a reasonable-length article).
In the US, the latest surprise – for some people – was the dovish tenor of the FOMC minutes when they were released yesterday. I shake my head in wonder at anyone who has managed to convince themselves that Chairman Yellen is a closet hawk even after years of evidence to the contrary (not least being the fact that she was nominated at all – not since Volcker has any Fed chief with remotely hawkish credentials been nominated to the Chairman’s position). After the FOMC meeting itself, a few weeks ago, TIPS had been clobbered and some (although not me) attributed that to the hawkish tone of the statement and the fact that Yellen had mentioned offhand that a lengthy period of low rates after QE has ended might be something like six months. The Fed is not hawkish at this point in its history; this is not to say that it does not have hawkish members but on the whole it is a dovish institution and I maintain that the Fed will likely tighten too late, and too little. For now, the Fed seems to be trying to make clear that they are concerned about low inflation and not likely to step on the brakes any more than they have.
What ought the Fed to be doing right now? The Fed ought to be tightening. Though growth is not robust, “robust” growth cannot be the standard demanded before starting a tightening of monetary policy, especially when there are tremendous excess reserves. The monetary policy car has no traction with such huge reserves, and the Fed needs to start trying to get control so that when it is time to steer, it can do so. Moreover, with disinflation fears waxing – incredibly – at the FOMC, inflation is in fact heading higher. Median inflation should approach or exceed 3% this year, despite the Fed’s belief that it will be well below 2% for a very long time. In a few months, the fear of disinflation and deflation will seem quaint.
No increase in policy rates is going to be coming any time soon. The Fed will continue to tighten very slowly, by winding down QE and then possibly starting to mop up some of the trillions in extra liquidity. That’s a sine qua non to rates going up, unless the Fed decides to establish a floor with the interest rate on excess reserves and to ship big boxes of money to Wall Street. But the interesting part will be when the Fed starts to mop up that liquidity either by outright bond sales (unlikely) or by some sort of massive reverse repo operation. It will get interesting because this classic tightening maneuver won’t be met with rising short rates – making it clear even to non-Fed-watchers that the Fed has no control over short rates at the moment. Again, I seriously doubt that the Fed will move with alacrity towards a tighter policy, and as it is they are at least a couple of years behind. But even if they do continue to tighten it will take years, not months, for the system to approach a normal state of liquidity.
The ECB talks like it is ready to ease further. ECB President Draghi was perceived as extremely bullish at his post-meeting presser last week, and recently there has been more chatter about negative deposit rates or other ways to increase the money supply.
And they need to do it. Disinflation, and possibly even deflation, actually probably is the threat in Europe, because the ECB has allowed money growth to slow back to the too-slow range that characterized the post-credit-crisis period (see chart, source ECB).

This obvious failure to keep money growth up is one reason for the strength of the Euro since 2012 – while the Fed talks about tightening, but does so in a way that only a dove could love, the ECB talks about easing, but does so in a way that can only appeal to hawks. Currency traders can smell it – European monetary policy may be as poorly managed as US monetary policy is, but holders of a currency prefer when the central bank is printing 2% more every year, rather than 6-8% as in the US. (Which would you prefer, a 2% dilution of your equity ownership, or an 8% dilution?)
The problem for the ECB is that their legal structures have been set up so that, at least officially, they don’t have the same tools for QE that other central banks have. Theoretically, they are prohibited from purchasing government bonds without sterilizing the intervention since that would mean effectively financing member governments. What ought the ECB to do? Well, I suppose it ought to follow its charter, but in a perfect world it is the ECB, and not the BOE or Fed, which would be doing QE. I suppose it will not surprise any reader to discover that I am a cynic, and I suspect that the ECB will at some point conclude that ceasing to sterilize the OMT bond portfolio is somehow allowed, even though practically speaking that would be the same as buying new government bonds without sterilization. We have already found out that in a pinch, the Federal Reserve is willing to be moderately “flexible” when it comes to its legal mandates. It would not surprise me a bit to see the ECB take a similar step. I suspect this will not happen in the next few months, since core European inflation for the year ended February has risen to 1.0% after being as low at 0.7% at year-end, but if that figure doesn’t continue to rise – and there’s no reason I can see that it should – then the ECB may test its flexibility later this year.
In Japan, the Bank of Japan has lifted core inflation to 0.8%, and it will continue to rise. Money supply growth is over 4% y/y, but only just barely. I believe that in Japan, what they profess to want and what they actually will act to secure are one and the same: increased QE, in increasing amounts, until everyone realizes that they are serious, the Yen declines markedly, and deflation is finally banished from the nation.
So in the race for weaker currencies, I suspect Japan will eventually win, with the US placing second and Europe having – annoyingly for its central bank, who would like a weaker currency to spur growth – the strongest unit.