Summary of My Post-CPI Tweets (June 2018)
Below is a summary of my post-CPI tweets. You can (and should!) follow me @inflation_guyPV and get this in real time, by going to PremoSocial. Until the end of June, you can get $9.99 off (one month free, or a discount off the already-discounted annual plan) by using code “tryme”. Or, sign up for email updates to my occasional articles here. Investors with interests in this area be sure to stop by Enduring Investments or Enduring Intellectual Properties. Plus…buy my book about money and inflation. The title of the book is What’s Wrong with Money? The Biggest Bubble of All; order from Amazon here.
- 27 minutes to CPI! Here are my pre-figure thoughts:
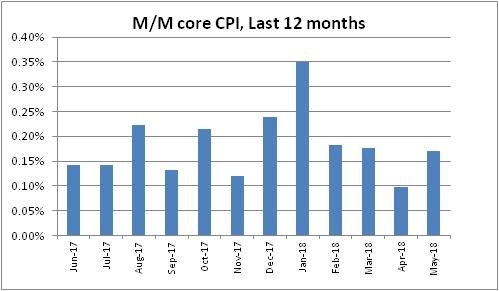
- Last month (April CPI) was a big surprise. The 0.098% rise in core was the lowest in almost a year, rewarding those economists who see this recent rise as transitory. (I don’t.)
- But underneath the headlines, April CPI was nowhere near as weak as it seemed. The sticky prices like housing were stronger and much of the weakness came from a huge drop in Used Cars and Trucks, which defied the surveys.
- Medical Care and Apparel were also both strong last month.
- Now, BECAUSE the weakness was concentrated in a small number of categories that had large moves, median inflation was still +0.24% last month, which drives home the fact that the underlying trend is much stronger than 0.10% per month.
- The question this month is: do we go back to what we were printing, 0.18%-0.21% per month (that’s the 2 month and 6 month avg prior to last month, respectively), or do we have a payback for the weak figure last month?
- To reiterate – there were not really any HIGH SIDE upliers to potentially reverse. Maybe housing a touch, but not much. To me, this suggests upside risk to the consensus [which is around 0.17% or so and a bump up (due to base effects) to 2.2% y/y].
- I don’t make monthly point forecasts, but I would say there’s a decent chance of an 0.21% or better…which number matters only since it would accelerate the y/y from 2.1% to 2.3% after rounding. So I agree with @petermcteague here, which is a good place to be.
- Note there’s also the ongoing risk each month of seeing tariffs trickle through or trucking pressures start to diffuse through to other goods prices. Watch core goods.
- So those are my thoughts. Put it this way though – I don’t see much that would cause the Fed to SLOW the rate hike plans, at least on the inflation side. Maybe EM or something not US economy-related, but we’d have to have a shockingly broadly weak number to give the FOMC pause.
- Starting to wonder why we even both with an actual release. Economists nailed it, 0.17% m/m on core, 2.21% y/y.
- That’s a 2.05% annualized increase. Which would be amazing if the Fed could nail that every month.
- Core goods accelerated to -0.3% from -0.4%, so the jump there hasn’t happened. Core services moved up to 3.0% from 2.9%. That is the highest core services since Feb 2017, but not absurd.
- still waiting on core goods acceleration…

- Used cars and trucks again dropped sharply. -0.89% after -1.59% last month. That’s m/m. The y/y is -1.68%. Again, that’s at odds with all of the private surveys and is a big disconnect. I can’t explain it.
- Owners’ Equiv Rent put in another solid month +0.25% m/m, up to 3.41% y/y. Starting to get a bit ahead of our model again.

- Large jump in lodging away from home, 2.93% m/m. That takes the y/y to 4.29%. LAFH is only 0.9% of CPI, but that’s an outlier that will probably come back next month.
- Medical Care scored a solid 0.2%, accelerating to 2.38% y/y.

- Pharma (3.73% vs 2.65%), Doctor’s Services (0.55% vs 0.31%), and Hospital Services (4.74% vs 4.49%) all accelerated.
- Apparel was flat on the month, but that moved y/y up to 1.4% vs 0.8%.
- Neither stocks nor breakevens care about this figure. Summer has set in. It used to be that the summer lull was a couple of weeks in August. Then it went to all of August as the US mirrored Europe. Now it pretty much starts in June and lasts until Labor Day.
- I forgot to mention Primary Rents, by the way. They actually decelerated to 3.63% y/y from 3.70%, which takes some the sting out of a potential OER reversal. The Primary Rents move was countertrend so it should also retrace next month. But only 1/3 of the weight of OER.
- The Primary Rents move does tend to reinforce the message of our model, that OER is a tiny bit out over its skis. However as that chart illustrated, it can diverge a bunch from our model.
- Biggest m/m declines were in Car and Truck Rental and Public Transportation (what’s up with vehicles??), followed by Mens and Boys’ Apparel. I’ve mentioned Used Cars and Trucks. Household Furnishings also weak.
- Biggest m/m increases are the aforementioned Lodging Away from Home, Infants and Toddlers’ Apparel, Motor Fuel, and Medical Care Commodities (mostly Pharma).
- All of the median categories are Rent and OER subcategories which are hard to get a read on, but median should again be mid-0.2s, probably 0.26-0.27% m/m pushing y/y to nearly 2.7% on Median CPI! Last mo was highest since 1/09; this would be highest since 2008.
- This is median BEFORE today’s figure, which will come later. And I could be wrong about it.

- Core ex-housing, something worth watching especially since housing seems back in an uptrend, rose to 1.29% from 1.21%. That’s the highest since Jan 2017, but it hasn’t been higher than 1.61% since early 2013. Right now can still claim it’s a housing story.
- Putting together the four-pieces charts.
- Still not much action in inflation markets. From the swap curve: US #Inflation mkt pricing: 2018 2.2%;2019 2.2%;then 2.3%, 2.4%, 2.4%, 2.4%, 2.5%, 2.5%, 2.4%, 2.5%, & 2028:2.5%.
- Four Pieces: Food & Energy first. Roughly 21% of CPI.

- Core Goods, about 19% or so of CPI. Rising very slowly. If core inflation is to reach ‘escape velocity’ this needs to rise a fair amount. Tariffs will help that, eventually.

- Core services, less rent of shelter. About 27% of overall CPI. Lot of medical care here, which as we expected has been pulling this higher. Again, for CPI to reach escape velocity you’d want to see this above 3%.

- And the big kahuna, housing, about 1/3 of overall CPI. Had a steady run-up, got ahead of itself and came back to model, and now is accelerating again. Housing indeed looks tight, and this should continue especially if wages continue to accelerate.

- Diffusion look at inflation is still pretty dull. Slightly less than half of all categories of CPI are accelerating faster than 3%. But that’s been very consistent between 40% and 50% (obviously at ~50%, median CPI would be at 3%).

- OK, last overall point. May was an easy hurdle to get an acceleration in y/y, as May 2017 was only +0.08. June and July of last year were both +0.143%, so again we should see more acceleration. Y/y core CPI should be at 2.3% next mo & hit 2.4% in Sept just on base effects.
- …that’s merely assuming 0.2% per month from core CPI, which is between what TTM core says it is and what median stays it is. If we print just a smidge above 0.2% per month we could hit 2.5% in November. Again, that’s assuming no big acceleration in underlying pressures.
- I happen to believe there ARE some underlying pressures so I think we’ll hit 2.5% sooner than that and median will press 3%. Nothing super alarming for the Fed, but somewhat discomfiting. The real test will be once we hit Dec and Jan and those hard comps.
- That’s all for today. Thanks for tuning in, and thanks for subscribing to the modestly-priced premium channel. I really appreciate your voting with your dollars in this way!
Breakevens eventually did care a little bit, rising a tick or so. Market-wise, today’s number continues to do two things. First, it doesn’t really give any reason for the Fed to arrest or delay its current plans to gradually hike overnight rates. There was no surprise here – this is still all very much in the realm of base effects as we drop off the strange deceleration from last year. Second, there’s really no reason for interest rates in the US to stay below 3%. In an expanding economy with accelerating inflation which is already at 2.2%, or 2.7% on median, a 3% nominal yield makes little sense. Real yields, and nominal yields, are too low. So, honestly, are breakevens…inflation swaps are showing forward expected inflation rates of no more than 2.5% out for many years, even though median inflation (and headline inflation!) is already above that level. You have to have a great deal of faith in an untested hypothesis – the idea that inflation expectations will be ‘anchored’ and overwhelm any effects from tariffs, actual production bottlenecks, and monetary largesse, to keep inflation low and steady – to be actively shorting inflation at these levels, and if you’re buying Treasuries at yields below 3% you are actively betting on inflation declining.
If it seems a strange time to be making that bet, I agree with you. But market sentiment is clearly biased in favor of a belief that the weather will always be sunny and warm and that neither inflation nor commodities will go higher, or equities or bonds lower, from these levels. The contrary evidence about inflation, anyway, continues to build and to my mind it requires an increasing effort of will to ignore that evidence.