When to Own Breakeven Inflation
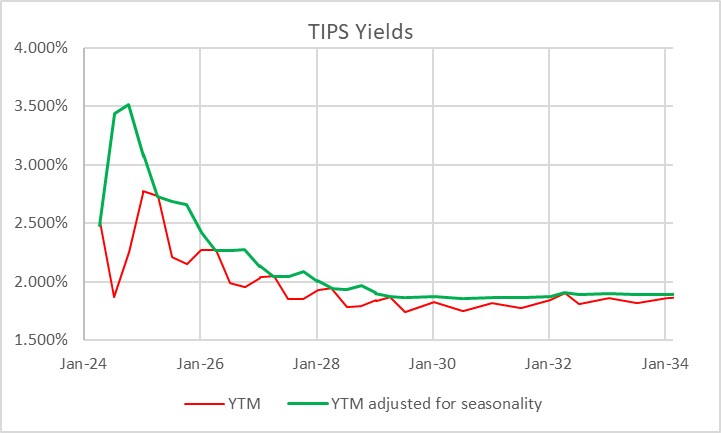
It is interesting to me that, with as important and liquid as the inflation-linked bond market is, tactical allocation between TIPS and nominal bonds is at best an afterthought for most investors. Perhaps this is because TIPS – if you think in nominal space, like most investors do – can be quirky and complex to analyze on a bond-by-bond basis. Here’s a picture of the TIPS yield curve. The red line is the way that TIPS real yields are calculated, and therefore the curve as perceived in the market. The green line is the true yield curve, adjusting for the way the seasonality of inflation prints affects each particular bond.
That’s understandable, but I don’t think it’s sufficient. Most investors do not invest in individual bonds, especially in TIPS space. They invest via mutual funds or ETFs, although the ‘laddering’ of TIPS to form a crude inflation-linked annuity is a popular approach amongst do-it-yourselfers. So why do so many investors own nominal bonds, instead of inflation-linked bonds, as an immutable strategic allocation? Even those who make occasional tactical shifts into TIPS seem to do so when they are expecting inflation to rise, and so are making a macro call instead of a quantitative call. But there are lots of times when owning TIPS instead of nominal bonds is just a good bet, regardless of your immediate inflation view. The most obvious one I wrote about back in March 2020 in “The Big Bet of 10-year Breakevens at 0.94%,” and I’ve also written generally about why you might want to be long inflation-linked bonds even if the current level of implied inflation (aka ‘breakevens’) is near to fair on the basis of your own view about the trajectory of inflation (see “A Guess at the Value of Long Inflation Tails” as an example).
But the times when just being long TIPS instead of nominals…or being long breakevens or inflation swaps if you do it as a leveraged play…is advantageous are not limited to unusual circumstances. TIPS also have tended to be systematically cheap over long periods of time, which I’ve also documented. Another way to consider the same question is to ask, “if I bought 10-year breakevens when they were at a particular level, how would I have done historically?” Or, equivalently, “if I had switched into 10y TIPS, instead of 10y Treasuries, when the spread was at a particular level, how much would I have out- or under-performed historically?” The chart below answers that question.

I went back to February 1998. For each of 6,453 days (ending in June 2023 since I had to look forward 6 months) I considered the starting 10-year breakeven rate and calculated the return to being long that breakeven over the next 6 months.[1] That return is dependent on the relative yields of the different securities, how those yields (and hence the breakeven) changed over time, and how actual inflation developed. It’s worth pointing out that this time period, core inflation was below 3% for 90% of the time. Ergo, you wouldn’t expect to have lots of big wins because of inflation surprise, although of course toward the end of the historical period you did.
The chart shows for each bin (I threw all 58 days with 10-year breakevens lower than 0.75% into the same bucket, which turned out to be equal to the number of days in the 2.75%-3.00% bucket) what the average 6-month return was to being long 10-year breakevens along with the 10th percentile and 90th percentile. So you can see that on average, you didn’t lose money being long breakevens anywhere under 2.50%, despite the fact that inflation throughout this period was very low. That’s a function of what I said before, that TIPS in general were cheap throughout this period. And if you bought breakevens (or switched into TIPS) any time that the breakeven was below 1.5%, you had a 90% or better chance of winning.
Naturally, it shouldn’t be a surprise that if you buy breakevens at a cheap level – as with any asset – you stand a better chance of winning than if you bought it at a dear level. What is a little more of a surprise is that there hasn’t historically been very much pain, on average, to being long breakevens even when they are high. In fact, unless you bought breakevens above 2.75% – basically, one event in 2022 – you had at least a 40% chance of winning your bet (10y TIPS outperforming).

This isn’t to say that there aren’t a lot of ways to lose, trading or investing in TIPS. Like any other investment, they can lose money and in 2022-2023 being naked long TIPS was almost as painful as being naked long any other fixed-income instrument. Almost. You did lots better than if you’d owned nominal Treasuries through the same episode!
[1] I used the Bloomberg US 10 year Breakeven Inflation Index, which is a total return index (BXIIUB10 Index on Bloomberg), from its inception in 2006; prior to that I used Enduring Investments calculations which utilized roughly the same methodology.
Hi Mike –
Can you explain the first graph – red and green lines – in more detail?
David Enna has a page on his site that shows a comparison of 5- and 10-year returns for TIPS and nominals. Nominals generally won up until a couple years ago and TIPS have been coming out on top recently…and probably for the foreseeable future.
https://tipswatch.com/tips-vs-nominal-treasurys/
Sure. The red line in the first chart is just the real yield to maturity of each of the current TIPS bonds. So, if you just run the traditional calculation for yield to maturity, or take the number off of Bloomberg, that’s what you get. So the Jan-25s and the April-25s both have about a 2.72% yield, meaning that they will return you approximately 2.72%+inflation between now and when the final index is established, about 2 months before maturity.
But we know that the April 25s have a distinct disadvantage in that the inflation we calculate for them will include December ’24 CPI, and December is always a weak inflation number before seasonal adjustment. So, all else equal, the 2.72% you earn on the April ’25s isn’t as attractive as the 2.72% you earn on the Jan ’25s.
We can do the same exercise for every bond, adjusting its yield by the expected benefit or drag from the normal seasonal pattern of inflation between now and maturity. That’s the green line. You can see that the green line is smoother – the market DOES recognize this effect, although it’s not super-efficient at pricing it in.
Make sense?
Makes sense. Thanks!
Instead of focusing on ‘break evens’, is there an argument to focus just on ‘real yield’? Or is there a sweet spot that includes both(e.g. good value if both real is above 2% and breakeven blow 2.5% ?
Well, it’s really two different questions. 1) do you want to own fixed income at all, a normal amount, or a lot (the real yield question), and 2) given the amount of FI you are holding, do you prefer to hold inflation or nominal bonds?
As a general benchmark, 10y TIPS yields at 2% with breakevens at 2.5% or so would be fair all around. Equal weight everything. Real yields of 3 or 4 (they basically don’t get above 4 no matter what the inflation) means overweight bonds. Real yields below 1 and bonds re starting to be expensive.
Of course all of that depends on other asset classes. But one of our mechanical ETF strategies explicitly tilts based on real yields (along with 2 or 3 other things).