Archive
Inflation Guy’s CPI Summary (July 2026)
The Bloomberg survey’s consensus numbers headed into CPI today were for +0.11% on headline inflation and +0.20% on Core. Considering the downside surprises last month, that’s a pretty tame forecast that says ‘no givebacks’ for the surprises.
Last month’s downside outlier on CPI, which cemented market consensus that the Fed wouldn’t hike rates in July, was mainly the result of surprises in rents, cell phones, and car insurance. The latter effect (as noted by a commenter on the inflationguy.blog, was due to a very large one-time State Farm special dividend to policyholders – obviously not repeatable.
What matters to the Fed, not to mention consumers, is the core number and changes in the trend. But it takes a few numbers to see a change in trend. So far, we haven’t seen a change in trend!
And…that evidently isn’t happening this month either. Headline CPI was +0.074%, a smidge below expectations, while Core CPI was +0.215%, just a pip or so high. As expected, that makes last month a pretty obvious outlier.

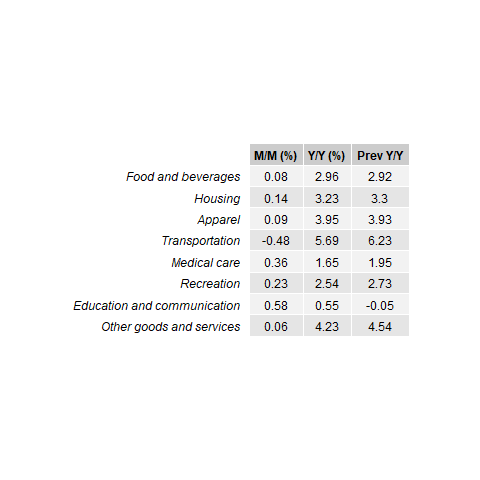
All of the groups rose on the month with the exception of Transportation, which was obviously mostly gasoline. Note that seasonal adjustment this month adds a bit to the NSA print, as we “expect” gasoline to be a drag in July. NSA CPI was actually -0.01%.
Also interesting to note are the y/y numbers for the 8 major subgroups. Of them, only Medical Care and Education/Communication are below what we have traditionally called the Fed’s target of 2%! This is one reason why the Enduring Investments Inflation Diffusion Index remains elevated even though Core and Median numbers are gradually coming down…so far.

(I usually put the EIIDI at the end, but it made sense to put it here for exposition reasons.)
Core Goods is down to 0.81% y/y; Core Services to 3.01% y/y.
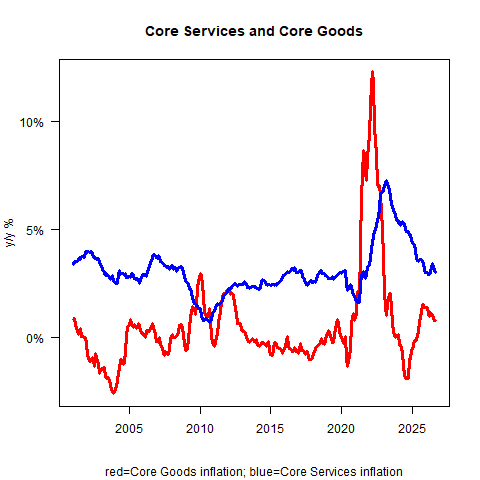
Core commodities continues to moderate. But this is not what people thought we were going to be getting once the tariff effect had finished washing through – and it has. This post-tariff residual is more important. I had expected core commodities to remain very slightly positive rather than going back to the perennial deflation of the globalization era, but this changes things if it instead settles around 0.5-1.0%. As I’ve noted, it becomes hard to get core to 2.0% in that case. By the way, that run rate of 0.8% is with Medical Care Commodities in outright deflation. Medicinal Drugs declined again. TrumpRX baby!

Okay, so some of the buoyancy in core goods overall is probably a pass-through of the energy spike…via packaging, much of which derives from petroleum products, and other trucking rates which pass through into other goods. But still – this is the part I thought would be easy, and it would be core services that would be slow and sticky. More on that in a bit.

Primary rents were +0.26% m/m, stabilizing y/y at +2.86%; Owners’ Equivalent Rent was also +0.26% m/m, and 3.23% y/y. I said in last month’s CPI summary that “Rents will probably recover to get back to a more-normal run rate of +0.25%/month,” and that’s just what happened. That had been one of last month’s outliers, and it went away. There was no payback rebound, but since housing inflation is right on the model I didn’t expect one.
Lodging Away from Home was -2.8% m/m. Now last month Lodging Away from Home was also a decline, and that was a surprise because people thought the World Cup would elevate the hospitality price pressures. Some people had suspected a calendar quirk leading to that decline, but this month’s further drop means it probably wasn’t a calendar quirk. Honestly, I think maybe the Cup effect was overblown. Compared to the number of hotel rooms could it really have been that big an effect? In France, sure. In the US/Mexico/Canada? Regardless, SA Lodging Away from Home is back to where it was in November of last year. It has really gone nowhere for 3.5 years. Airfares rose 2.22% on the month – a pass-through of the energy spike again.
Used cars and trucks were +0.4% after -0.23% m/m last month. New Cars were +0.08% versus -0.02%. Those were also ‘drag’ categories last month, back to normal this month.
My guess at Median based on today’s numbers (actual numbers come out in about an hour) is +0.256% m/m.

How much of a downtrend this is depends on how nearsighted you are. Over the last 4 months? Downtrend. Over the last 9? Uptrend (although that includes the shutdown aberration). Most honest read is probably flat to very slightly down over the last year. But 0.25% monthly is still a 3% run rate of Median. That’s not where I think it is going to settle, but it’s higher than Warsh wants it.

Core Services less Rent of Shelter declined to 2.81% y/y. This is the most encouraging piece, because it’s more wages-based and so the wages/prices feedback adds stability and persistence. I don’t know that I’m confident this is going to keep sliding, but the trend is your friend and if core commodities is not going to go negative, then we need this to decelerate below the pre-COVID levels. Like I said, I thought this was the part that would be slow and sticky. I suppose it is – certainly improvement has been slow – but it is the best trend in the data I think. Is it enough? Hmmm…I suppose it depends on Warsh.

Motor Vehicle Insurance (seasonally-adjusted index shown above), which was one of the outliers last month thanks to that State Farm dividend, fell again…but just slightly. This may be a residual of that dividend, or it may be real. I doubt it’s real. Declining used car prices helps some but there are too many other upward pressures. Flat is the best we can really hope for I think and flat is what we were getting in Q1 2025 through Q1 2026.
Core categories declining faster than 10% annualized this month included Car and Truck Rental (-30%), Lodging Away from Home (-28%), Infants’ and Toddlers’ Apparel (-16%), and Motor Vehicle Fees (-11%). There aren’t a lot of future repeaters there that we can count on. On the other hand, rising faster than 10% annualized we only have Nonalcoholic Beverages and Beverage Materials (+11%), Public Transportation (+22%), and Jewelry and Watches (+29%). So not a lot of repeaters in the upper tail either.
This is the number I thought we would get last month. Boring, right on expectations. The bad news is that it is boring and right on expectations…at 3%.
This doesn’t change anything about the Fed outlook, but not for the reasons people think. My outlook depends a lot on Chairman Warsh. If Powell was still in charge, then the Fed would almost certainly be nudging up rates (even as the balance sheet grows) because inflation is being stubborn. But Warsh has stated a desire to tighten policy – by shrinking the balance sheet. I don’t know why pundits seem to think this isn’t hawkish. I suppose 30 years of being told that policy rates are the only things that matter to monetary policy will produce lots of analysts who think that is the case.
Currently, the balance sheet is still growing, and short rates are stable. I expect that as long as Warsh wins the philosophical argument in the Eccles Building (no sure thing), the balance sheet growth will soon reverse and rates will then start to come down – not go up. Right now, Fed Funds futures have basically become an event contract on “Will Warsh win control of the Fed, or be captured?”
Policy needs to be tighter. The sticky inflation makes that clear. But that’s a balance sheet thing, not a rates thing. But stay tuned for news from Jackson Hole!
Socialism and Inflation Measurement
One of the common complaints about the Consumer Price Index (CPI) is that it doesn’t reflect the way inflation feels to the individual. Much of the reason that is so is the fact that we have built-in cognitive biases; a simple example of this is that we tend to encode price increases as ‘inflation’ while price decreases are recorded as ‘good shopping.’ Accordingly, prices which oscillate get recorded in our brains as ‘inflation’, even if the net movement is not much.
My favorite example of this is gasoline. Ask anyone, any time, if they think gasoline prices are higher or lower than they were (say) four years ago and they will say ‘higher’ about 90% of the time. Right now, for example, we know gasoline is at an incredibly high level – $4.101 was the national average at the end of July. That’s compared to the level four years ago, at the end of July 2022, when it was … $4.212. And wildly higher than it was in 2008, when the July 2008 AAA price was … $3.898. In other words, for the last 14 years gasoline has risen at a compounded average annual rate of 0.36% per year, well below the inflation rate.
Sometimes it’s up, looking back over some fixed period; sometimes down. But over the last decade and a half, gasoline basically hasn’t moved anywhere (and that’s including the fact that gasoline taxes have risen).

But if the Bureau of Labor Statistics were to announce that gasoline was basically unchanged since 2008, some people would lose their minds with screams of conspiracy theory. It’s not, unless the American Automobile Association is in on the conspiracy too.
A more fair critique (but not to the extent that conspiracy theorists would have it) of the CPI is that the index is a creature of a government agency and represents standardized weighting and collection methods that may or may not always fairly represent what a particular consumer faces with respect to price increases. This problem is acute in the United States, where a vast geography and very diverse systems of local rules and regulations can directly affect the national average even if it only directly impacts a constrained region. So, when Mayor Mamdani freezes rents in New York City, it will impact national rent inflation a little even though rents are only frozen for a relatively small number of Americans.[1]
And that leads to the fairest complaint at all: if the government engages in price-fixing, does that magically cause inflation to vanish? Of course not! Although rents may be frozen for some units in New York, costs for landlords continue to rise. You can’t wave a magic wand and make inflation go away, but unfortunately you can wave a magic wand and affect the measurement. I wrote about this last year in “Mamdani’s Effect on the CPI”,[2] which in turn points you to a podcast I did a couple of years ago on price fixing. The bottom line is that fixing prices does not change inflation, but it changes inflation measurement because the inflation gets displaced into poorer quality. Quality is hard to adjust for, and whenever the BLS tried people screech about ‘hedonic adjustment’ even though poorer quality would of course increase inflation by making up for the part that is missed in the price level itself.
Anyway, there aren’t many easy solutions for manipulative mayors.
The salient point in that article on the rent freeze is that landlords’ costs are increasing. Enduring Investments’ methodology for estimating rent inflation is based on estimating landlords’ cost pressures, with the assumption being that the return on investment for a landlord doesn’t drastically change over the years when you average across many markets.

Our model has done an excellent job of not getting sucked into the ‘persistent deflation’ story apparent in various measures of rent changes that focus on apartments that are actually turning over, such as the Apartment List index.

These data aren’t false; they just measure something very particular and that is how much competition there is among landlords to let out vacant units. That doesn’t tell us a lot about what landlords are charging for currently-occupied units – and, more to the point, it can’t be the case that rents fall persistently when landlord costs are rising persistently.
But – it is very important to realize that measurement of inflation is not the same as inflation. This isn’t unique to inflation, of course. The monthly Payrolls number depends on the sample and the response, and it is well known that since it doesn’t capture new businesses or closing businesses it is inherently inaccurate. It’s true of virtually all economic data, in fact: the number is a measurement at a point in time, based on a specific methodology and calculation, and so only suggests the underlying metric being measured. The difference is that a massive notional amount of securities are indexed to the CPI!
The Mamdani effect on rents only amounts to probably 5bps/year on the CPI rate. But if the Socialist wave gains momentum (a hard-left Senate candidate won the Democrat nomination yesterday in Michigan!), we need to be cognizant of two things. First, Socialism has a wonderful record of causing an increase in actual inflation when we include the historically-unblemished record of declining standards of living. (Not only that, but eventually inflation happens anyway. As a reminder of that, note that for the second year in a row Obamacare premiums are going to rise by double digits, surprising absolutely no one who understands economics). But second, Socialist policies would indeed have a tendency to cause measured inflation to decline. You think the Fed is in a pickle now? How about when measured inflation is 1%, but adjusted for quality it’s 6%!
[1] Fortunately, freezing rents in NYC, and so artificially changing the measured inflation in New York, won’t result in freezing Owners’ Equivalent Rent in the same area. Although OER is based off the primary rent survey, the BLS recognizes that rent-controlled units are not market rents and so using those in the sample for OER would be misleading. One does wonder how the BLS will calculate OER for New York if Mamdani freezes all rents.
[2] Note one error in that article is that I assumed OER would also be affected. As noted above, it won’t be.
