Archive
Tragic Comedy
There were two tremors today, but the one that was expected is likely the one which will have bigger long-term effects.
The unexpected tremor was a magnitude 7.1 aftershock in Japan. Initially reported at 7.4 (which is a much bigger difference than it sounds like), the temblor was also located 20 miles underground rather than near the surface. Even so, 7.1 is not a small earthquake, and it knocked out power to the Rokkasho nuclear-fuel reprocessing plant and the Higashidori nuclear power plant, as well as two of the three power lines to the Onagawa nuclear power plant. But this time, the backup systems were not swamped by the much-smaller tsunami that ensued, and more importantly the Fukushima plant sustained no further damage. No doubt the quake put jangled nerves further on edge, but there was no further extension of the disaster.
The “expected” tremor was the ECB rate hike. The central bank raised rates 25bps, as expected. Even as Portugal was preparing its formal request for $100bln or so, the ECB insisted that this was good for the collective (they didn’t use the word “collective,” since that would make it too obvious).
According to the FT, and unsurprisingly,
Germany welcomed the ECB action. Mr Trichet denied paying undue attention to Europe’s largest economy, asking what Ben Bernanke, Fed chairman, would say “if he was asked the question ‘did you do this or that because of California’”.
This is disingenuous, of course, since Germany is fully 20% of EU GDP but furthermore the main source of the central bank’s DNA, whereas California is only 12% of US GDP and not exactly a ‘thought leader’ when it comes to fiscal prudence. But I’ll concede the point. There is actually one piece of evidence supporting his view, and that’s that real-time measures of German inflation seem already to be ebbing, which would make the need for tightening much less (see Chart, source the Billion Prices Project at MIT).

The Billion Prices Project may not be as thorough as Eurostat, but it's faster. This is German CPI.
As far as I know, the BPP isn’t trying to pick up core prices, so the fact that this measure is declining even as Brent Crude futures reached a new high ($122.78; NYMEX Crude finished above $110) and is up 31% over the last three months is suggestive. The persistent strength of the Euro since year-end is helping restrain prices – a following wind that the U.S. doesn’t have. The fact that the ECB is raising rates (to be sure, there is still ample liquidity from other programs and no one will quickly starve for cash) is odd.
I would describe that move as “comical,” but if you want comedy you really can do no better than the U.S. fiscal circus. Incredibly, the U.S. government is 24 hours away from a partial shutdown and furlough of 800,000 “non-essential personnel.” The battle is between the Republicans’ proposal to cut $61bln from the deficit and the Democrats’ $33bln proposal. The Republicans, controlling the House of Representatives, insist on their number; the Democrats say this would destroy the economy, old people, and orphan children with a limp.[1]
Now, I can tell you that the 2012 budget expenditures as proposed by the President are supposed to be $3.7 trillion, and point out that these two numbers are literally rounding error, but the numbers are so big as to be meaningless. So let me try a couple of images.
Let’s suppose that in 2008 your household had an income of $50,000. In 2009, you got a raise to $53,500; in 2010 you got a raise to $62,000; and in 2011 you got a raise to $65,500. Nice job; in three years you’ve gotten a 31% raise. Now the company comes on hard times, and they ask you to take a pay cut to $64,500. So you quit, of course, rather than take the pay cut.
Or, let’s say that ten years ago you weighed in at 190 pounds. Well, you’ve sort of let yourself go and you now weigh 380 pounds. But you can advance to the next round on The Biggest Loser if you can trim six pounds over the next year. “Forget it,” you say. “I love my Haagen-Dazs!”
That’s the scale of what we are talking about here. In the first example, your 31% rise in salary over 3 years matches the 31% rise in federal outlays over the same time period, and the $1,000 pay cut is roughly equivalent to $61bln/$3.8trillion in FY 2011 outlays. In the second example, your doubling in weight echoes the doubling of federal outlays from the 2001 budget ($1.9 trillion) to the 2011 budget and the 6 pounds out of 380 is akin to $61 from $3.8 trillion.
What is amazing to me is how Obama is turning into the anti-Clinton. The President is actually making the Republicans sound like health nuts when they propose the six-pound diet! It isn’t like the Republicans (at least, the main wing of the party) are being particularly fiscally conservative. How can the President make losers look like winners? He’s the anti-Clinton!
Folks, this comedic interlude actually has real-world repercussions. I don’t see any auctions failing any time soon, but the burden of running these deficits compounds because each year you need to raise all the new cash plus roll all of the maturing bonds. In the first year of massive deficits, you’re mostly just funding the deficits plus the “typical” maturities. In the second year, you have to sell bonds to fund the deficit, plus the “typical” maturities, plus all of the stuff you sold the prior year that matures this year. In the third year, you have to sell bonds to fund the deficit, plus the typical maturities, plus all the2-year stuff you sold in the first big-deficit year plus all of the 1-year stuff you sold last year. Right now, the 2-year note is $36bln in size, or $432bln/year. So you can see how pretty rapidly, you are stuck running massive auctions every day, all up and down the yield curve. Heck, we’re almost there now.
Over the last few months, we have had the assistance of the Fed to hoover up about $400bln of those issues (and before that, the knowledge that the Fed would be pursuing QE2 helped backstop buyers). But if you believe what you hear from the hawks, not only is the Fed going to stop buying soon but they’re going to be looking to start selling their stake as well (I don’t believe this, by the way).
Think I’m kidding about the size of the problem? Look at the chart below (Source: Bloomberg). It shows the distribution of the maturing bonds of the U.S. Treasury. Remaining in this year (that needs to be refinanced) we have maturities of $627bln plus about $1.7trillion in T-Bills. Some of those will be rolled into 2012 and roughly $250bln into 2013 (via the remaining 2-year note auctions this year). But in 2012 we will have a further $1.1 trillion deficit to finance (in the President’s proposal it would be $1.1 trillion in 2012, although remember the budget years aren’t calendar years so this isn’t quite right) plus the $1.3 trillion in maturing Treasury obligations to roll (let’s assume that the Treasury keeps rolling the $1.7 trillion or so in bills). That works out to about $9 billion in new coupon-bearing bonds that the Treasury needs to sell every day, or $45bln/week. And again, that’s on top of the bills. And every year that we somehow manage to pull off this trick, we add a bit more to the out-year stacks – the 3yr, 5yr, 7yr, 10yr, and so on.

The debt distribution of US Treasuries and all subsidiaries (except FNM and FRE)
Oh, and do you think the budget is sensitive to short interest rates? About 40% of the debt is maturing by the end of 2012. Now what do you think the odds are that the Fed will aggressively hike rates to a neutral 4% or 5% any time soon?
And does this problem start to sound anything like what Portugal experienced? Greece? Enron? It isn’t the balance sheet that fells most countries and companies – it’s the cash flow statement.
Is there a way out? Not a pretty one. Cutting hard on the deficit might well stimulate the economy after the initial harsh blow, but if our leaders are arguing over $61bln or $33bln I doubt we will soon see $500bln pass.
The market reality is that today, the dollar is already weakening. After rallying through the first part of 2010 due to the sovereign debt problems in Europe, it began to decline despite the fact that those sovereign debt troubles have continued. A declining dollar tends to increase the price of imports, most obviously energy imports, and helps to push inflation higher (albeit with a long lag). And to the extent that investors expect the currency to continue to underperform – perhaps because we have a dovish central bank while Europe has a hawkish one – it makes them less anxious to buy U.S. dollar-denominated issues (like Treasuries).
Some people think that a declining dollar is good for stocks, because it increases the value of exports and makes our products more competitive on world markets. True, but remember the U.S. is a substantial net importer overall, so the balance is clearly negative. It surely can’t be that all of the bad effects accrue to households and all of the good effects accrue to business. Businesses have energy costs too, and a lower currency also diminishes the opportunity to manufacture more cheaply abroad. Higher inflation and higher interest rates overall are surely not good for stocks.
On that cheerful note, I will close for the day and probably for the week although if something dramatic happens with the government shutdown I may write a comment. Obama, Boehner, and Reid suggested tonight that there was a chance a deal could be struck by mid-morning, but as I’ve pointed out it isn’t something that’s likely to be dramatic. Unless, that is, you find six pounds on a 380 pound man dramatic.
[1] Actually, this isn’t true. Under the No Orphan Children With A Limp Left Very Far Behind Act, both parties agree that limping orphans should be protected by the government.[2]
[2] Just kidding. There isn’t a NOCWALLVFB Act, but everyone agrees that ambulatorily-challenged independent minors should get the government’s full support.
Taking A Punch
Many things have happened since I last wrote, on the day of CPI.
- Libya declared a cease-fire. Libya immediately violated its own cease-fire. A number of nations, including but not led by the U.S., imposed a no-fly zone in Libya at probably the last possible moment before the rebels faced defeat, and now may seek to secure the country by attacking Gaddafi’s troops by land. A member of the U.S. President’s own party declared that he should be impeached. Oil, seemingly oblivious of this drama, traded up another $4 over that time period and is near the year’s highs. I paid $72 to fill my Jeep today.
- Existing Home Sales were dismal, and inventories actually rose slightly for the first time in six months. This is a small surprise given the low rates and slowing improving economic situation, but it may also be an insignificant wiggle. Still, economists have been revising lower their projected growth rates for Q1. Growing, but not booming.
- The Treasury announced that it is going to sell “up to” $10bln of its $142bln portfolio of agency MBS per month. This is prudent since they are aware of a $1.25 trillion portfolio that supposedly wants to unwind over the next few years (I seriously doubt it will happen). The timing is good since there is no net Treasury issuance at presence, thanks to the fact that the Fed is buying all of the net paper. It is not a monetary drain the way it will be when the Fed sells securities, because in the Treasury’s case it is replacing other issuance that it would do. The money will be spent either way! When the Fed sells securities for cash, the cash just sits there. When the Treasury sells securities for cash, it is recycled into the economy in the form of spending.
- Portugal’s government looks poised to lose a vote in parliament, and the event would effectively topple the government and push early elections. J.P. Morgan declared that “the likelihood that the Portuguese government will fall this week looks high.” This would, some people believe, force Portugal to seek support from the Stability Facility. If that surprises you, then you haven’t been paying much attention. Portuguese 10y yields are at 7.38%, below Ireland’s 9.66% partly because Irish yields keep rising. And yet, we keep hearing that the ECB is preparing to tighten monetary policy. If I was in Ireland, Greece, or Portugal, such talk would really irritate me. Slowing the economy right now is not exactly what these guys need, especially since the European economy is currently growing at a lusty 2% y/y. If there is a risk to the inflationary outcome being stoked by the Fed and perhaps finally the BOJ, it is that the ECB makes a horrendous policy error and tightens policy into a weak economy. I didn’t think this was very likely, because only fools would be thinking about tightening in Europe right now. It’s like taking someone on life support and deciding to remove their appendix. Without sterile equipment.
- In an unrelated note, probably, Venezuelan strongman Hugo Chavez declared that capitalism may have ended life on Mars. He may have been joking.
- Japan has gotten the nuclear situation seemingly under control, and the world is breathing a sigh of relief. The scale and scope of the catastrophe is still staggering. Some 9,000 people are confirmed dead, and with the number still missing and the number still without heat or food that number could still double. Into this great tragedy, the Bank of Japan and other central banks jointly intervened to weaken the yen several days ago. This is even less explicable than the saber-rattling of the ECB, because at least that could be stopped at saber-rattling. Why in the world would you want to weaken the yen? The fact it is strong is incredible in the first place – ordinarily currencies of countries with weakening economies, huge deficits, and loosening monetary policy will weaken on their own. A lower currency, induced by central banks, means that the people of Japan will have higher prices to deal with in addition to everything else, and since Japan imports most of its food and energy it means higher prices for those things. It helps the export sector, but right now they’re not making much of anything so it’s all downside.
Okay, now I think we are caught up as we head into Wednesday’s New Home Sales (Consensus: 290k from 284k) data. The bottom line is this: the immediate, nuclear crisis of Japan has passed. The Libya/MENA/energy price crisis is upon us. The Portuguese crisis is yet to occur.
The economy is no longer in recession, and is strengthening slowly. But what we don’t know is, can the economy take a punch? A robust, healthy, free-market economy can adjust to the vicissitudes of life on this big blue marble. In 1987, the global equity market crash happened when the economy was otherwise strong, and after some wrenching losses life continued more or less normally. In 2000, the market crash hit an economy that was already overextended and weakening, and the terrorist attacks in 2001 kept the economy on the canvass for another year.
I don’t think there can be much debate that punches are coming. They’re always coming. The biggest problems we have tend to be when the markets price out the possibility of a punch. In this case, we can see some of them coming. The Japanese disaster will have a measurable impact on global GDP and there is a potential for a ripple effect up the supply chain of some products. Oil at $100/bbl is dang inconvenient, but survivable; oil at $125 is a punch we’re probably not ready for. And the European situation seems to me to be destined to devolve into a barroom brawl (albeit one where everyone has interesting accents and is speaking very politely while they brandish the furniture).
How will the economy fare, and by extension the markets? I would feel better about the latter if stocks were not priced at a CAPE of 22.9, and if the bond market wasn’t being asked to absorb (starting in July) not only the $1+ trillion of new Treasury debt but also to brace for the possibility of absorbing the Fed’s balance sheet – at the same time that sovereigns globally are increasingly competing for that capital!
Dreams and Nightmares of Debt
The stock market fell, fairly hard. The S&P ended the day down 1.9%, just a smidge above the lows from late Feb although the actual close was the lowest since the end of January. The similarity of the last couple of weeks of price action to that which we saw in November is probably lost on no one (but just in case, see the two charts below). The only difference of note so far is that in November, right before the next stage of the rocket higher, the market tested the range lows but managed to close well above them while in this case, we’re closing right at the bottom of the range. In any event I wouldn’t take the November experience to be a roadmap of any sort, but the similarities are at once eerie and encouraging given what ensued after November.

The S&P in November.

The S&P, recently.
With our quota of encouraging anecdotes fulfilled for the day, we may continue. 10y note yields also reached the lowest levels seen since January. However, 10y TIPS yields fell to 0.88%, as low as they have been since early December. 10-year inflation swaps, however, are just a bit off their highs for the year. Indeed, over the last month nominal yields are down about 34bps at the 10y point, but TIPS yields are -49bps while 10y breakevens are +15bps.
The combination of these two details – a decline in nominal rates that is almost entirely the product of a decline in real rates rather than of a decline in inflation expectations, plus softening equity markets – would lead the market detective in me to suspect that a change in growth expectations is in the air. On this point we get some confirmation from a general softening in commodities. Crude was down -1.8% and gasoline -0.5% despite news that Saudi police had opened fire on protestors today, one day ahead of the ‘Day of Rage’ scheduled for tomorrow. But Grains were -1.4%, Livestock -0.2%, Softs -4.3% (mostly Coffee and Sugar), and Precious Metals -1.6% (the source for all of these summary numbers is the one-day change in the relevant DJ-UBS Spot commodity subindex).
Some observers saw the decline in nominal yields and in stock prices as indicative of a flight to quality, perhaps because Spain was downgraded one notch by Moody’s today with a continuing negative outlook or on the Saudi police-shooting-of-protestors news. But if that were the case, I would have expected to see a bigger move in bonds of the periphery countries (10y Spanish yields were up a whopping 1bp while Greek bonds rallied) or a rise in oil prices. And yet, neither of those things happened. This might be just a plain old re-assessment of growth dynamics.
Why that reassessment would happen today is a little beyond me. Sure, Initial Claims were worse-than-expected at 397k, but that series still appears to be trending lower overall (the big miss, though, means that volatility is still a big problem for analysts trying to evaluate the series). And yet, that still seems to be the cleanest explanation.
The quarterly Flow-of-Funds (Z.1) report was released by the Fed today, showing – and this is what leads the news – that household net worth rose $2.1 trillion on the quarter due mostly to gains in the equity markets. That sounds like a big number, and would make us feel pretty good if we didn’t all know by now just how ephemeral those stock gains are. And, in fact, other parts of the Z.1 help remind us of that fact. With this report in hand, we can update Tobin’s Q to the end of the year and find that the ratio of market value to replacement cost is about 1.1, which is roughly 45% above the average since 1952.That means we can now officially say that with the exception of the equity bubble, stocks have not been as richly priced on Tobin’s Q as they are now in the entire post-war period (see Chart).

Tobin's Q (shown as a ratio to the average Q)
The Z.1 also allows us to update a couple of other goodies. The first chart below shows the public debt (state, local, and federal, plus Fannie Mae and Freddie Mac as of 2008), private debt, and total debt as a percentage of GDP. It is pretty clear what is going on here. The federal government has essentially stepped in to try and make up for the deleveraging in the private sector.

Uncle Sam is helping us keep levered as a society. Thanks, Sam!
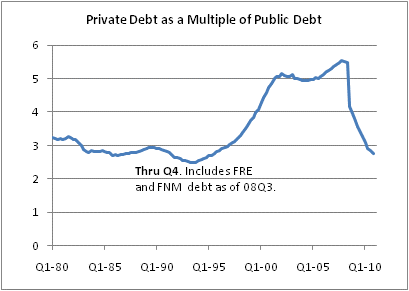
Total public sector debt outstanding as a proportion of GDP rose in Q4 from 88.7% to 90.6%. As recently as 2008Q2, it was 52.4%. Overall debt is 340% of GDP, down from 341% last quarter and 363% in the first quarter of 2009. But before getting too excited about this deleveraging, reflect that as of June 2008, total debt was 340% of GDP. In other words, all the credit crisis has done is to shift the debt from the private side of the ledger to the public side of the ledger. I’ve noted in the past that the division of debt between public and private is important for the inflation dynamic. Societies with heavy burdens of private debt tend to disinflation; societies with heavy burdens of public debt tend to inflation. As the next chart shows, before the crisis the total private debt had reached a level about 5.5x the size of the state and local debt. Since mid-2008, the ratio has fallen back to 2.75x.
Okay, we're back. Now stop the big deficits. Come on, stop. Please?
Can you see any place in this chart where we might expect to see a leverage-induced bubble in asset markets? The good news is that the current level of 2.75x was a fairly normal division prior to 1997 or so. The bad news is that there is no sign that the ratio is going to stop falling any time soon.
Another way to look at the debt dynamic is in the chart below. Abstracting from the absolute level of debt, which sectors have been adding to it and subtracting from it?

It isn't households doing most of the deleveraging. It's financials near-term and businesses long-term.
Can you see any place in this chart where we might be unsurprised to see an increase in overleveraged financial institutions? Another interesting aspect of the chart is the slow decline in the share of debt outstanding that the business sector represents.

Okay, I got a little carried away on charts today.
Yes! Businesses are getting less levered. Is this good, or bad? Well, the good news is that a company with less financial leverage is safer, in a business sense. Credits, overall, have been strengthening in the last couple of years (duh!) and in general businesses are less levered than they were in the 1980s and in the first half of the 1990s (of course, I’m not considering here operating leverage, which has definitely increased with computers and improved mechanization and which also increases the volatility of earnings by increasing the fixed:variable costs ratio). The bad news is that declining leverage implies a decline in ROE if all else is equal, since return on equity is just Profits/Sales * Sales/Assets * Assets/Equity (the DuPont equation) and this last term is leverage.
And you might reflect on another possible implication of the fact that businesses are trimming debt relative to equity. It suggests that, even with the miniscule level of interest rates, businesses perceive equity as being cheaper than debt as a place to raise money. In other words, they are happy to sell you more equity at the prices you’re paying.
Love Is In The Air
Ah, there is nothing quite like the manufactured holiday of Valentine’s Day.
It is a time to reflect on the impact in our lives of all those whom we love: family, friends, commentary subscribers, Twitter followers, et cetera. It is a time to salute Pepe Le Pew as being a tireless suitor rather than an annoying stalker. It is a time to be moved by Elizabeth Barrett Browning’s Sonnet 43 and not to disparage it as a cloying attempt at one-upping her secret love (and future husband) Robert. And it is a time for letting people we love know that we really do love them.
For example, it is clear that I do not often remember to say “I love you” enough to Alan Greenspan. Without the Maestro, how would I ever have been inspired to write Maestro, My Ass? (Note that you can still get a discounted copy here.) And my affection for Ben Bernanke burns even hotter, for he is really trying to help those of us who specialize in inflation markets. God bless his little heart. I adore Obama’s cute little Socialist tendencies; socialism creates such wonderful opportunities for entrepreneurs to offer efficiency as a product. Every dollar of expenditure in the Federal Budget (the President’s proposal was released today with a record deficit projected for the recovery year of 2011 before dropping to “only” 1.1 trillion in 2012) represents an opportunity to do something better than the government. Would FedEx have ever gotten started if the Post Office wasn’t run so well? I hope Fred Smith sends a valentine every year to the Postmaster General.
I don’t really much care for Congress. There’s just not room in my heart for those little dickens. You can’t love everyone.
More seriously: the budget proposal released today is amazing and, if you are think of buying 30-year nominal Treasury bonds you really ought to give it a read. While the bond market managed to eke out a small gain with 10y Treasury notes closing at 3.61%, it is hard to imagine those low rates will be available to the Treasury a year from now. The budget contemplates a $1.1 trillion deficit next year and never less than $600bln over the forecast horizon. By comparison, before 2009 there had never been a full-year deficit of more than $455bln (see Chart below if Valentine’s Day puts you in a charitable mood that makes you feel uncomfortable).
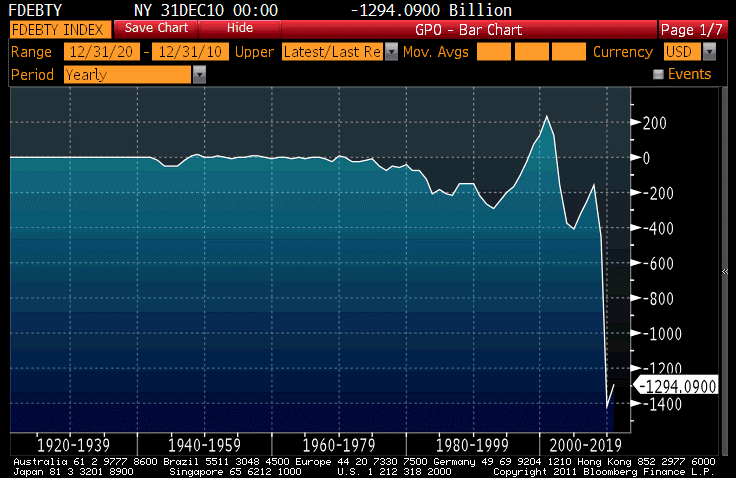
Calendar-year federal deficit (source: Bloomberg)
For another comparison, interest on the national debt is expected to be $474bln in 2012. That’s up 14.5% for fiscal year-on-year and that, my friends, is with record low interest rates! But don’t let your blood boil: it’s Valentine’s Day after all. And another observation: until 2008, the amount of currency in circulation had never exceeded $830bln (it is now not quite $1trln). So if you gathered every U.S. penny, nickel, dime, quarter, half dollar, dollar coin, and every bill in every wallet and piggy bank in the world, you still would be more than $100bln shy of covering next year’s deficit. Not debt, folks: just the single-year shortfall.
What is amazing to me (and I don’t want this to become a political comment, but large deficits have a market effect and an economic effect and so it’s worth discussing) is how many parts of the budget are increasing at the very time when we’re running pan-trillion-dollar deficits. Look at the wonderful color-coded chart that the NY Times has up here. This is true even among discretionary items, but let’s be frank here: if the alternative is that the nation is unable to fund this budget and unable to borrow it, these are all discretionary items.
It is a depressing reminder of the state we are in to look at what is considered a reasonable budget proposal. But again, for an inflation consultant these should be lovely times. For many people, and although I am an optimist I increasingly count myself among them, can’t figure out how we get out of this mess without completely changing the structure of the budget and the scope of the entitlements and then inflating ourselves out of the existing debt. Make no mistake, just doing the latter won’t work because the entitlements are inflation-linked and the average maturity of the debt is right around five years – meaning that in five years, your interest payments will rise to reflect the new inflation reality. We must put the budget into surplus and then inflate.
Except that I don’t think there is anything approximating a plan to do this in a rational way. We are guiding the ship of state through the murkiest, most-dangerous shoals in the world and no one is steering. (And is that perhaps one of the reasons the equity market is rallying? Because the only hope is to spin the roulette wheel and get lucky?)
But this should be a happy occasion. This is no time to bicker and argue over who killed who. (Apologies for the Monty Python and the Holy Grail reference). Let’s focus on the good news, for there is at least some.
The good news is that for whatever reason, the financial markets are not yet punishing us for what is surely an increasingly obvious denouement to the predicament. The Federal Reserve is right, at least presently, that the cleanest read of inflation expectations indicates that no one has caught on yet. The chart below shows 5y inflation swaps and then the 5y inflation swap starting 5 years from now (the 5y, 5y forward inflation swap).

Forward inflation measures are calm and contained.
While the 5y is near multi-year highs around 2.25%, the 5y5y is only just above 3% and seemingly in no danger of breaking out to new highs. While 3% is well above the Fed’s stated target, there is always a little risk premium in the forward since all of the long-tail risks are to higher inflation (there is no chance of -10% inflation, but +10% isn’t even all that difficult). Even back in the halcyon days of 2006 and 2007, the 5y5y ranged between 2.70% and 3.05%. So there certainly seems to be scant alarm in the inflation derivative markets. The chart below shows a scatterplot of the last year’s worth of data with the latest point in red. Arguably, 5y5y is even lower than it should be, given expectations for inflation over the next 5 years and the “usual” relationship between these two measures.

5y CPI swaps (x-axis) vs 5y5y CPI swaps (y-axis) suggests that if anything, forward expectations may be low!
Now, let me be clear. There ought to be some alarm. Given a choice between buying the 5y5y at 3% and selling it there – not as a trade but as a bet to hold for 5 years, mind you – the choice is simple to me. I can tolerate a loss of 1% per year if I am wrong and inflation expectations in 5 years are at 2%. I can tolerate a loss of 2% per year if expectations are for a mere 1% inflation over 2016-2021. But I don’t want to be in the situation, five years hence, of possibly having to buy inflation protection at 10%.
Some of this is due to the fact that the Fed is trying to hold down long-term nominal rates, and while this chart shows inflation swaps rather than inflation breakevens the two measures are kissing cousins. But the Fed is also buying TIPS, and that will tend to drive up the same spread, so while 10y nominal yields are clearly lower than they otherwise would be if there were no $600bln gorilla in the room, it is not quite as clear that forward inflation metrics are as perverted as nominal yields themselves.
.
In contrast to last week’s desert of economic data, this week’s more-interesting slate gets moving tomorrow. The Empire Manufacturing Index for February (Consensus: 15.00 from 11.92) will be released at the same time (8:30ET) as Retail Sales (Consensus: +0.5%, +0.6% ex-auto). I expect bonds to resume the recent trend to higher yields, but at 3.57% on the 10y yield I’d reconsider the immediacy of that stance. Stocks will someday fall, and fall appreciably, but I see no reason to expect that yet. Love is in the air.
Shooting The Messenger
The news was a bit more varied and interesting on Wednesday; bonds were higher and stocks lower but it is hard to attribute that to any one piece of news.
For a change, not all of the interesting news was overseas but much of it was. There were reports that protests in Egypt were “regaining momentum,” which if true is certainly unusual. Protests that flare up and burn out are less risky to a regime – as long as the “flare up” isn’t so high that it leads to a sudden transition of power – than ones that have a steady burn. Maybe we were too quick to push this issue to the back page just yet.
More concrete were two inflation stories. I’m seeing more and more inflation stories globally. This is also a change of tenor; until now it had seemed as if the stories were mostly “one-offs” but if there is one thing the unrest in the Middle East has done it is to draw journalists’ (and policymakers’) attention to the issue of food commodity price increases. In the UK, there was a report from the British Retail Consortium that food prices were +4.6% year-on-year, the fastest pace since the middle of 2009. The official UK price data isn’t due out until next Tuesday, but the inflation market is showing strains. As the chart below (Source: Enduring Investments) shows, 5y inflation swaps are on the verge of performing the rare feat of crossing above the 5y, 5y forward inflation rate.

UK 5y inflation about to cross above 5y, 5y forward inflation
That is, traders are expecting inflation to be lower from 5-10 years from now than they think it will be for the next 5 years. This last happened in the U.S. in the summer of 2008, when high energy prices combined with a slowing economy led investors to expect that the gasoline spike would not be repeated: $70 to $140 oil is one thing, but to expect headline inflation to continue to be as far above core inflation as it was required you to expect a move from $140 to $280 since inflation is a rate of change, not a level. Of course, that didn’t happen.
In this case, however, it is less clear that the arrow of growth is clearly pointed downward, at least for a year or two forward as it was in mid-2008. And recognize (look at the chart) that both of these measures are around 3.5%, well above the BOE’s 2% inflation target. The market is almost urging the BOE to tighten policy, although there seems little chance of that at present.
Even more interesting is the news out of Argentina. Actually, the story was out last Friday in the Financial Times and I missed it. A summary of the story, and a link to the FT if you subscribe, is available here.Today, Bloomberg ran a similar headline, which is why I saw it. To summarize: independent measures of Argentina’s inflation (such as that produced by the Billion Prices Project at MIT, about which I wrote just last week – and pointed out the Argentine discrepancy) show inflation running at about three times the government’s measure. The Argentine government, in an attempt to bully these independent surveys into saying inflation is closer to the 10% they claim, threatened them with a large fine if they did not produce their methods and, more chillingly, their sources within 24 hours. The way inflation is typically measured, such as by the BLS, involves flesh-and-blood human beings walking around and writing down prices in a systematic way. Argentina is making a thinly-veiled threat against the people who are doing this.
An important point, though, is that everyone knows the Argentine numbers are cooked. Arm’s-length calculations from these agencies and the BPP@MIT show much higher inflation. And the inflation-linked bond markets also recognize the lower quality of the index that Argentine bonds are linked to compared to, say, Chile’s or Colombia’s. Argentine real yields are 7.6% while Chile’s are 2.7% and Colombia’s 3.3%. Investors are compensating for the artificially-low inflation compensation that they get in Argentina by insisting on a higher real rate (even so, investors clearly are hoping that there is some chance the government will start reporting the correct figure rather than continuing to prevaricate for the next couple of decades).
All of this is interesting to an inflation guy, and I suppose the point is that these inflation stories are increasingly of interest to non-inflation guys. But I don’t like the idea of shooting the messenger, because in some sense I am one of those messengers.
The fact that there is a percolating global inflation is a surprise to no one except, perhaps, Ben Bernanke. The Chairman appeared before a House Budget Committee hearing today and, despite the increasing alarm about how inflation metrics appear to have bottomed virtually everywhere and commodities-based indices are flying, responded to a question about a future QE3 by saying that if the economy is still stagnant in June when QE2 is done, “we would have to think about additional measures.”
This is wrong on a bunch of levels, but let me mention just two. First, the answer ignores the Fed’s dual mandate and focuses on just the growth mandate. The reason that QE2 could be plausibly enacted wasn’t that growth was slow but also that inflation was low and still declining (although you didn’t need to be a great forecaster to see than in Q4 the year-on-year measures would begin to rise at least from base effects). That latter point is no longer true, and so any consideration of a QE3 should involve the question of growth but also the question of whether inflation and the inflation outlook is acceptable. But the second, and perhaps more grating error is that if the economy is still stagnant after QE1 and QE2, a rational person would say ‘hmmm, this doesn’t seem to be working’ and look for something else to try. The Fed these days is anything but rational, though. The Chairman had the temerity to drag out the Fed’s estimate that monetary policy had ‘saved or created’ 3 million jobs. I still can’t figure out if he is taking credit for the 3 million or so that the President and Congress saved, or if he’s talking about an incremental 3 million jobs.
In my opinion, concern about the stewardship of the fiscal and monetary policies of this country and most others is rational, warranted, and overdue. That creates many risks, but the clearest one I think is in inflation – global as well as local.
I will talk tomorrow about the state of the inflation market in the U.S.. The only interesting data of the week, Initial Claims (Consensus: 410k from 415k) is also due to be released. Claims should be starting to calm down after the crazy seasonal adjustment issues that are normal this time of year but that this year were even more severe. If there are going to be downward economic surprises this week, it comes down to this report because that’s just about all there is!
The Treasury will also seek to sell $16bln long bonds, which is an awful lot of duration. Today’s $24bln 10-year notes, however, drew a strong 3.23 bid:cover ratio on the back of a huge indirect bid (often seen as a proxy for foreign central bank interest) of $17bln. Dealers took only $6.7bln for the lowest percentage I’ve ever seen. This means dealers most likely have powder dry and will be able to bid for the long bond with some comfort.
True, yields are the highest they have been in a little while, but people are lining up for 3 5/8% 10-year notes? And 4 ¾% long bonds maybe? I salute these buyers and wish them the best of luck. Maybe Dr. Bernanke will buy them back.
Do Deficits Matter?
According to Bloomberg, Treasuries on Friday fell and stocks rose “as U.S. Economic Data Top Forecasts.” Stocks added 0.6%, while 10y note yields perked up to 3.32%.
The economic data that beat forecasts was the trade deficit, which was mildly better-than-expected, and the Michigan Confidence figure, which at 74.2 managed to beat the 72.5 expectations, but didn’t even reach a new high for the year. It should be noted that the low for the Michigan number in the last recession was 77.6!
Oh, and by the way the Budget Deficit for November was 150.4bln, more than $12bln worse-than-expected and the biggest November deficit ever. To the extent that these second-tier numbers are better-than-expected, do you think that Federal largesse has anything to do with it? I’d be more impressed if the deficit was improving as well!
Moreover, China overnight increased bank reserve requirements for the third time in the last few months. After the prior two hikes, markets sold off. This time, there was nary a ripple – perhaps because investors figure growth is so robust we no longer need to rely on China as an engine of growth?
Overlooked too, it seemed to me, was the fact that the leaders of Germany (Chancellor Merkel) and France (President Sarkozy) met today and jointly announced that they reject the notion of the European Union issuing bonds – which of course would mainly have value because of the economic power of Germany and France – and are opposed to expanding the €440bln rescue fund that was set up in May – and which costs fall predominantly on Germany and France. To be clear, Merkel and Sarkozy reiterated that they completely support the common currency, but they also made clear with their actions that they are more willing to let periphery nations flounder alone than to let the problems of the PIIGS besmirch the good names of Germany and France.
So stocks rallied, according to the soothsayers, because economic data topped forecasts. Given the actual distribution of news today, though, this seems to me to be a hopeful justification. Stocks look to me like they are rising now because they are at new post-Lehman highs, and some investors are afraid of missing the boat. And bonds are falling because it is December, and they already have fallen quite a ways, and in the bond world you generally don’t want to fade moves made in December no matter what the cause because of the size of the short-gamma hedging need compared to the available liquidity.
If the news is so good, then let’s see how the stock market holds up next week when it gets real data. Retail Sales is on Tuesday along with PPI and a Fed meeting; CPI, Empire Manufacturing, and Industrial Production are on Wednesday; and Housing Starts, Initial Claims, and the Philly Fed report on Thursday. I don’t think that we know anything more today about the economy, with Michigan and Trade in-hand (especially given China and the budget), than we knew yesterday. But by next Friday, we will actually have some real information.
I will leave you this week with one more fun chart. Today’s Deficit figures put the running 12-month total at a mere $1.288 trillion. Assuming we have roughly 2% growth this quarter, this means the deficit is around 8.7% of GDP.
Now, we all know that big deficits should lead to higher real interest rates, right? Well, take a look at the following chart, which shows the 10-year TIPS yield against the rolling 12-month deficit as a proportion of GDP. What we see is rather the opposite – real interest rates have instead declined as the deficit has increased.

Note: last 2 points of Surplus/Deficit line are estimated based on 2% growth rate in current quarter.
Let this be a lesson against the careless use of statistical inference! What is happening here is that both deficits and interest rates respond to a common factor, and that is economic growth. The first period of deficit deterioration, which largely overlaps the first big decline in real yields, is associated with the recession of the early 2000s. Deficits improved and bond yields rose during the tepid expansion of the middle part of the decade, and then the second recession of the decade sent both deficit and yields lower. So real yields are not responding to the deficit, nor the deficit to real yields; they are both responding to rotten economic conditions (and where we are on the chart should give you some pause about expecting robust growth ahead).
However, look instead at a scatter plot of TIPS yields as a function of the deficit. The relationship is pretty good, but interestingly it is not linear. I’ve plotted two regression lines here: one is linear and the other is polynomial of order 2. The polynomial curve fits better (notice the higher R2), which confirms what our eyes seem to tell us when we look at it.

Same data as above, but arranged in scatterplot form.
In other words, the indirect relationship (through growth) isn’t clean. Real yields are not as low as they should be given growth that is bad enough to lead to a deficit as large as it is. This either means that (a) we are getting bad mileage out of our deficit spending, and running one too large given the underlying economic growth, or (b) real yields are higher than you would think they should be given how punk growth is. I suspect both of these are true, but the implication of the latter is more worrisome because we can always improve the profile of what we’re wasting money on. Higher real yields suggests that the government is having to pay a bit more to fund its deficit (in real terms), even though the Fed is buying scads of the debt. Now, if we want to be generous we can suppose this is because private borrowers are competing for the capital more than they were, but look again at the first chart and see where the inflection really happened. This is a phenomenon associated with the huge deficits resulting from the latest recession.
Indeed, my regression lines are probably too generous. The clump of dots on the right appears to be roughly linear, but then the clump of dots on the left represents total outliers. If the linear-vs-nonlinear approach is “right,” then real yields are about 75bps higher than we would expect them to be otherwise but that’s just the point estimate and you can plausibly argue the effect isn’t large. But if the dots from the most-recent period are best viewed as outliers relative to the “normal” relationship from the last recession and the expansion periods around it (basically, one full cycle since TIPS were first issued), then real yields are a couple of hundred basis points too high, or the deficit is over 5% larger than it should be given the underlying growth dynamic, or some combination of the two. Any way you slice it, I think the first chart (the “happy” one) is misleading, and the scatterplot (the “unhappy” chart) is more illuminating. So, do deficits matter? You tell me.
On Monday, I plan to discuss what will no doubt be a hot topic at the Fed meeting on Tuesday: inflation targeting.
Inevitable But Still Alarming
Well, just like that, Ireland’s ruling coalition sinks beneath the waves. After having promised that the country had enough funds to make it through until mid-summer 2011 (if you ignore the needs of the banking system, which apparently investors were not willing to do), and then folding and asking for help, the Prime Minister (Brian Cowen) announced today that the country will hold new elections after passage of the new budget in early 2011. Cowen faced defections from relatively minor (but crucial) coalition parties after seeking aid less than two weeks after claiming Ireland didn’t need any money. The amount of money it now appears they do need, according to Goldman Sachs as cited in this Bloomberg story, is a mere $130 bln (€95bln). That’s a lot of soda bread…and it happens to be something like 60% of Irish GDP. So Mr. Cowen was a wee bit off. It isn’t a ‘done deal,’ either, since Germany intends to attach pretty stringent measures to the bailout and other EU countries (those who haven’t failed and don’t plan to) will also have a voice.
While Irish bond yields actually declined a few basis points today, since the aid package is presumed to be aimed at eviscerating the bond and equity holders of the banks (which ought to be interesting, since many of them are other banks elsewhere in Europe), Greek 10y bonds sold off 33bps. Spain and Portuguese rates were roughly unchanged, which is encouraging if you’re hoping to arrest contagion before it gets started…but I wouldn’t think we’re done with this test yet.
U.S. and Continental equities were smacked, although U.S. markets managed to rally back to nearly unchanged on the day. But the FTSE was off 1.9%, the Spanish IBEX fell 2.7%, and the French bourse -1.1%. U.S. 10y real yields ended at 0.65% and 10y nominal rates at 2.81%, both improved on the day. The reactions are still surprisingly tepid, and the VIX today actually fell back to near recent lows. Some of that is due to a calendar that is rotten with holidays, but one certainly gets the impression that investors don’t get it. Ireland was never supposed to happen. Greece was supposed to be the last domino. Does that worry anyone?
.
Looking back at last week, it seems odd to me that the markets responded positively to any rumor of an Irish bailout, while reacting negatively to news that China was tightening lending. For the record, during the last 12 months the United States has $275bln in exports to Europe and only $85.5bln with China (Source: US Census, e.g. here), so in terms of our domestic growth Europe is about three times as important as is China. True, imports of $370bln from Europe are only somewhat higher than the $348bln from China, but if China contracts 5% and Europe contracts 5%, the latter is a much bigger deal. Not only that, our banking system is much more intertwined with the European banking system than with the Chinese banking system.
Now, the fact that China is tightening is also a problem, but it is certainly less immediate. The problem there is that tighter monetary policy in China, coupled with looser monetary policy in the U.S., should make the yuan much stronger relative to the dollar. This is what we want, but China doesn’t. A stronger yuan would slow the Chinese economy (which they seem to want), lower inflation (which they seem to want), but it would seem to be a concession to the West (which they don’t seem to want). The Chinese government seems reticent to let the yuan accelerate its appreciation, but if it tightens policy and does not loosen the reins on the FX market, the pressure will build for a future less-gentle adjustment. I just don’t think that’s something we need to worry about in the next few months, while the collapse of the EU periphery on the other hand is something we need to worry about. And, as odd as it sounds, it doesn’t seem to me as if anyone is worried about it.
.
Tomorrow’s main event is the release of the FOMC minutes from the November 2-3 meeting. While just about every Fed official has spoken either in the days leading up to the meeting or in the days immediately following the meeting, so that it seems unlikely the minutes hold anything we are not already aware of, the market will lean on the nuance of the discussion (or what it perceives to be the nuance). Was it a close call, or is there pressure for a bigger or longer-lasting program? Among the unsurprising things we could learn that the market might still react to would be some admission that QE2 is progressing about as rapidly as the Fed can operationally handle; this could be read – depending how it is phrased – as a recognition that the current state of monetary policy is “we’re pedaling as fast as we can” and that quantitative easing over a longer time horizon is entirely possible. This would be presumably good for TIPS and commodities and perhaps good for equities (although by now investors may realize that QE is not a license to buy stocks without risk).
The earlier data releases are less exciting. There will be a revision of Q3 GDP, and Existing Home Sales (Consensus: 4.48mm from 4.53mm) will also be released. Pay attention, as usual, to the inventory of existing homes, last at 3.38mm. A significant decline in inventory is a sine qua non for a recovery in broad pricing pressures and likely also crucial to broad economic activity as well. Finally, the Fed will buy TIPS while the Treasury sells 5y notes. I will say this much for the government, at least they avoid having the Fed buy exactly what the Treasury is selling…perhaps that will confuse some people.
Building Blocks Of The Future
Volume is starting to be a real concern. While the bond market rallied (2.52% on the 10y note), inflation markets and stocks fell (-0.6%), and the VIX was slightly higher, the real story is starting to be the continued slide in exchange volumes. The 60-day average volume just fell below 1bln shares for the first time since at least 2004, which is as far back as Bloomberg has volume figures. Again, this isn’t entirely surprising given the regulatory changes we’ve recently seen – it’s just surprising that it has happened so abruptly.
But this doesn’t necessarily mean the market’s future is bleak. The Stock Trader’s Almanac apparently just came out with a 8-year, 7-year forward forecast (that is, starting in 2017 and extending to 2025) for the Dow of 38,820.
The forward-starting forecast is creative. If the market rallies a lot before 2017, and is sitting at, say, 25,000, is the forecast for a “SuperBoom” over those 8 years also raised? If not, then it’s really a 15-year forecast of 9%-per-year growth.
Mind you, that’s still a fairly optimistic forecast. With 2-3% inflation, 2% dividends, and 2% real growth in GDP-per-capita (see the explanation, especially of the latter, here), 6-7% is what you’d ordinarily expect as a long-run equity return (and that assumes that we’re starting from fair value, not the elevated Q-ratio of where we are). An extra 2-3% per year for 15 years is a big difference.
But since I am ordinarily playing the part of naysayer, I thought I would break form today and give a reason to be optimistic in the long run. I think that the potential future outcome is binary: there is a low but meaningful chance that our country spends the next decade or two struggling with war, inflation, a loss of confidence in the currency, civil unrest, and miserable economic performance, but there is a much higher probability that things work out okay and we come out of the current depression with bright prospects. (The chance that the best fantasies of the equity bulls come true, though, is very low).
How might things work out okay? Note that this is not my 1-year outlook. I am not particularly sanguine on the medium-term prospects, to say the least. But the view from 30,000 feet, a truly macro perspective, isn’t too bad. It doesn’t require blind faith in the American Way or patriotic chest-thumping that we’re the Best Country On Earth; all it requires is some math, one or two good decisions from our leaders (admittedly its weak point) and one small assumption.
Let’s start with this: potential GDP over time is driven by productivity growth and population growth. In Japan and in Europe’s case this is worrisome since population growth is likely to be negative as the demographic bubble bursts, but one great strength of this nation is that, for all the debate about the treatment of illegal immigrants, as a nation we generally support legal immigration. Most of us come from families, after all, that were immigrants at some point in the past. So unless our leaders make a very bad decision and prevent legal immigration as well as stopping the flow of illegal immigrants, we need to make no wholesale changes to our policies to ensure that our population growth continues to be positive.
We will lead aside the productivity question for a moment and come back to it.
Now, let’s look at the building blocks of GDP. The formula we all know is Y≡C+I+G+(X-M); in words that is GDP is definitionally equal to the sum of consumption, fixed investment, government spending, and net exports. We all know that recently, with consumption and investment down, artificial government spending is the only thing that kept GDP from collapsing. But let’s look at the long run. The chart below shows the components of GDP in chained 2005 dollars, their proportions of the economy, and the compounded growth rate for the 10 years from 1999 to 2009 (source: BEA).

Whatever would we do without Uncle Sam??
Contributing to the blistering 1.8% growth in the overall economy was a steady rise in consumption expenditures and a rise in the size of government (especially Federal, and this obviously doesn’t include the new health care entitlement and only includes part of the stimulus money).
This could make one feel afraid for the future, because the populace clearly wants the “G” number to shrink considerably. Doesn’t that doom us to slower growth, if Big Brother isn’t putting a following wind in our sails?
Not at all; in fact, quite the opposite is probably true. The government competes in the capital markets to fund its expenditures; because of its sterling credit, it outcompetes some investment expenditure (“crowds out” private borrowing, that is). It is interesting, although surely largely spurious, to note that over the last 10 years the increase in Federal spending has been $333bln (chained 2005 dollars) and the contraction in private investment has been $328.6bln.
Now, going back to the drivers of long-term GDP growth: which do you think is more likely to inspire productivity improvements, $300bln in federal spending or $300bln in private investment?
If, in fact, the arrow of government size is starting to point lower – and golly, it’s hard to imagine how it could be pointing higher given the size of the deficit – then this is probably of long-run benefit to the economy, and the future growth rate will be higher in such a circumstance rather than lower. Admittedly, this conclusion is subject to the assumption that private investment is more productive than public investment, and some people (roughly 45% of the electorate) seems to disagree with that statement. But in my mind, it isn’t such a big stretch.
.
Tomorrow, the economic data include the Case Shiller home price indices (Consensus: -0.1% month/month, +3.1% year/year) and the Consumer Confidence number at 10:00 (Consensus: 52.1 from 53.5). As always, watch the “Jobs Hard To Get” subindex for signs that the dip in August was a mirage and the employment picture is in fact improving. I don’t entirely buy it, but we’ll see.
Also tomorrow is my presentation at the New York Investing Meetup. My talk will begin at around 7pm, and the topic is “Why I Don’t Worry About Deflation And Neither Should You.” Go here for details. You don’t have to be a member of the group to attend; attendance is only $10 to cover the group’s expenses. I’d love to meet you.
