Archive
Float On
It is Golden Week in Asia, and the May Day holiday in Europe. In other words, it has been a slow couple of days in the markets.
The world still keeps producing news, though, whether or not anyone feels like trading it. Late last week, Japan extended its asset-purchase program by one-third in amount (¥40 trln from ¥30 trln) and one-half in maturity (from 3 years to 2 years). Last night, the Reserve Bank of Australia surprised markets by cutting interest rates 50bps to 3.75%, against general expectations for 25bps. The RBA had made its initial rate cut in December, so now they’re officially closer to the 2009 bottom in the cash rate target (3.00%) than to the 2011 highs (4.75%). Join the crowd, Australia!
The Chicago Purchasing Managers’ Report released on Monday was weak, in fact the weakest since 2009. Fortunately, the market didn’t worry too much about that, since today the equivalent national index (the ISM) rose to its highest level since last summer although well off the highs of last spring. Remember that these are relative-change indices, so that a higher print means growth accelerated a little bit from one month to the next. With an election coming up, and the federal government in effective control of the automotive industry, don’t expect a sharp slowdown in manufacturing any time soon! More interesting will be the non-Manufacturing ISM, released on Thursday, but it will be in any event overshadowed by tomorrow’s ADP report (Consensus: 170k vs 209k last) and Friday’s Employment Report (Consensus: 161k vs 120k).
Richmond Fed President Lacker said that the Fed may have to raise interest rates in mid-2013, even if the Unemployment Rate is above 7% and even though it has previously promised to keep rates on hold until mid-2014.[1] Now, Lacker has been a hawkish dissenter for some time, so this isn’t a particularly shocking revelation. It was interesting though that according to Bloomberg he said “It is ‘really tricky’ for the Fed to find ‘that time when interest rates need to rise to prevent inflation pressures from emerging, before you see them emerge, before you see inflation move up steadily.’” I am not sure what constitutes “inflation moving up steadily” if 16 out of 17 months of acceleration in year-on-year core inflation doesn’t qualify!
.
Interest rates are near or at all-time lows, with long-term rates considerably below expected inflation (1.94% on 10-year Treasuries; 2.61% on 10-year inflation swaps). So what is a country to do, if it needs to borrow trillions of dollars for the next couple of decades?
Apparently, the answer is ‘issue floating rate debt!’
As Tim Geithner looks to sew up the “worst Treasury Secretary ever” award,[2] apparently the U.S. Treasury is considering issuing floating-rate debt. Why? The Treasury needs to raise enormous amounts of money, but would like to raise it on the part of the curve where rates are effectively zero. However, it already issues so many TBills that the risk of a failure in that market isn’t zero, if there grew any concern about the size of the government’s debt. So it wants to issue longer. That part seems smart: reduce ‘rollover’ risk by issuing long but having rates pegged to short-term rates. I don’t have any issue with the desire to issue longer-dated debt; in fact, I’d advise the Treasury to issue perpetual notes or, as Robert Shiller has suggested, notes linked to GDP that are effectively equity in the United States.
But if you’ve decided to replace uncertain bill rollovers with longer-dated notes, that doesn’t resolve the question of whether to issue fixed-rate or floating-rate notes. That’s a wholly different question. Consider this analogy: you’ve bought a house, and you need to choose whether to take out a one-year balloon mortgage at a great, low rate or a 30-year mortgage. Clearly, the one-year balloon mortgage represents way too much rollover risk, because if you’re unable to roll it over you’ll default on the mortgage. But does that mean you should take out an adjustable-rate mortgage? Well, no – that’s a false choice. You can take out a 30-year ARM, or a 30-year fixed-rate mortgage. Your choice between those two depends on several factors, but they are equally acceptable alternatives along the maturity dimension.
What the Treasury is really trying to do is to raise money at low rates, so as to keep the current interest bill low and help the deficit numbers. (And who cares, really, if rates go up during the next Administration, which anyway is unlikely to be Obama’s and if it is then there will be plenty of time to fix this?) But that puts the government in exactly the same position as the homebuyer who in 2006 took out a 3y/1y ARM relying on the low teaser rate to qualify for more home than he could otherwise afford. We have more government than we can afford, to be sure! I suppose Geithner assumes/hopes that no one will foreclose on the U.S. government.
Incidentally, you may perhaps be thinking “well, a floating-rate note will be inflation-protected, because short rates are correlated with inflation.” This is true (at least, when the Fed isn’t lashing itself to the mast), and there are some money managers who in fact sell products based on the idea that floating-rate notes are an inflation-protected asset class. To be sure, floating-rate notes are more inflation-protected than fixed-rate notes, but unless the maturity is extremely long, the investor still has ample inflation exposure. This is because while the coupons are roughly inflation-protected (because they go up and down with a high correlation to inflation), the principal is not.
If you invest $100 in a 5-year floating rate note, in five years you will get back $100. Along the way you will have received floating coupons that provide inflation protection – but only if the part of the coupon that represents inflation protection of the principal is re-invested in more notes of the same type. In other words, you had better have more than $100 of principal at the end of the deal, or you’ve lost real principal. And on a 5-year note, at these yields, something like 96% of the value of the bond is the present value of the return of principal. Even for a 10-year note, 82% of the value of the note reflects the value of principal, and on a 30-year note 40% of the note’s value still derives from the principal payback. So, in a nutshell, unless you’re carefully reinvesting your coupons in the same security, your real return is not assured with a floating rate note. I would steer clear of any such Treasury issues unless they trade extremely cheap. If you want floating-rate inflation protection in a bond form, a superior investment (although still one I’d avoid at these real yields) is to buy TIPS so that your principal is also explicitly protected against inflation.
And speaking of protecting against inflation, I’d appreciate your help with a one-question poll. We are trying to determine how protected investors feel they are, today, with respect to inflation (whether naturally or because of steps they have taken). The poll appears below. Now, there’s likely to be quite a bit of bias in the results considering that if you’re reading this you surely already have more awareness of the inflation threat than the average investor, so feel free to point others to the poll via the “Share This” link at the bottom of the poll. Thanks in advance.
[1] There is ongoing discussion about whether the Fed saying “at least” mid-2014 constitutes a promise, but I stick with my original analysis: either it was meant to be a promise, in which case the institution’s credibility should be damaged if they don’t hold to it, or it was meant to be a forecast in which case it was pointless since there’s no reason the Fed’s forecast ought to have any impact on rates – especially since they are demonstrably worse at forecasting than private-sector economists. Or, what is most likely, it was originally meant to be a promise because the Fed wanted to force rates lower, but now they want it to be considered just a forecast because they think they may no longer want rates that low for that long and they don’t want to lose credibility.
[2] Stop! Stop! We’ll concede the point! Please take a vacation until January!
Promising Isn’t The Same As Delivering
Yet another weekend appears to be poised to end without the promised big-picture agreement on Greek debt. The BBC was reporting earlier today that talks between the Greek Prime Minister and the leaders of other coalition parties had concluded without agreement to take additional austerity measures; at this hour Bloomberg is reporting that there is agreement on cuts of 1.5% of GDP although these will not be finalized until Monday. These Greek-on-Greek talks became necessary because European Union representatives demanded additional austerity measures. On Friday, a report from Radio Netherlands Worldwide said that the AAA countries demanded “that the [Greek] government implement agreed reforms and austerity measures by March at the latest. Otherwise they will withdraw the bailout funds pledged last year.”
In case you’re wondering: yes, when those bailout funds were announced last year the stock market rallied because the problem had been solved. You see, it is easy to announce the desire to help. It is harder to actually help.
I wonder if the U.S. will consider throwing in a little help now that we have had a couple of months of decent data (more on that in a moment). I think it would be a mistake, both politically and economically, but this Administration has tended to have a tin ear politically since taking office. A driving force of its foreign policy has been a desire to be loved worldwide, and it would not surprise me a bit if we started to hear about the U.S. taking a bigger role in talks. Would this be bullish or bearish for our markets? It might be bullish since it would increase the perceived chance of the immediate crisis being averted, but it might be considered bearish since it increases the chance of a crisis later. It would, though, change the equation significantly since the U.S. is the only power capable of writing a hundred-billion-dollar check alone (heck, that’s only a tenth of a trillion!). I imagine the stock market would like it but I’m pretty sure the bond market would hate it.
This wasn’t even a consideration a couple of months ago, when we had enough of our own problems to deal with. Those problems are still here, but the problems we have – high private leverage, a chastened although recovering banking system, an addiction to extremely high budget deficits with little appetite to reduce the size of government, and a dangerously loose monetary policy – are not the problems that the Administration (and the Fed) believe we have. It is true that if the economy can grow at 4% for 5-7 years, many of our problems will diminish, but policymakers seem to think the weak growth is not an effect but rather a cause of our current circumstance. And recently, the news on growth has been better.
On Friday, the Employment Report produced a new jobs figure of 243k, which was about 100k greater than expectations. The Unemployment Rate dropped to 8.263%, only a whisker away from triple-downticking. Aggregate hours worked and average hourly earnings both rose, which means that Q1 income got off to a good start.
The January report is a little quirky, partly because of the usual seasonal adjustment issues around year-end and partly because benchmark revisions take place in this month. I’m not terribly uncomfortable with the overall reading of mild strength, because it’s consistent with most other labor market indicators showing the same thing. (In my mind, the question is more about sustainability of this mild strength if Europe holds to current trends.) The Unemployment Rate plunge was on the quirky side because the Household Survey from which it is derived incorporated the annual adjustment to population.[1] According to the BLS, the adjustment “increased the estimated size of the of the civilian noninstitutional population in December by 1,510,000, the civilian labor force by 258,000, employment by 216,000, unemployment by 42,000, and persons not in the labor force by 1,252,000.” Overall, however, the civilian labor force grew by 508k and employment by 847k, which means that the addition from other than the population adjustment was 250k to the civilian labor force and 631k to employment. That’s quite a large number, and won’t do anything to soothe those who think that every number is a government conspiracy. But, as I said, it’s not inconsistent with other signs of decent employment growth.
On the unfortunate side, the participation rate plunged to 63.7%, the lowest since 1983 (see Chart, source Bloomberg). The BLS explained this by saying “This was because the population increase was primarily among persons 55 and older and, to a lesser degree, persons 16 to 24 years of age. Both these age groups have lower levels of labor force participation than the general population.” However, notice that while this explains the sudden drop, what it means is that the prior ratio was overstated, not that the current ratio is understated. So this is something less than encouraging.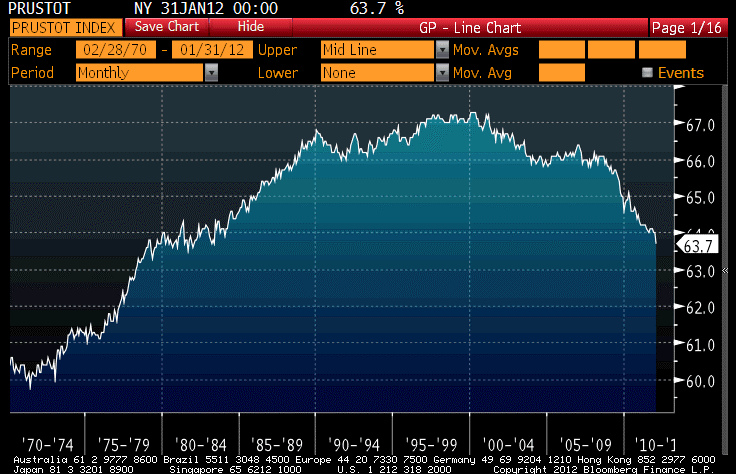
On this point, Julia Coronado at BNP (whose analysis of economic releases is generally among the more clear-eyed reads) made a great summary observation. She said “It is becoming increasingly likely that the path toward lower unemployment rates will mainly be through fewer workers rather than an acceleration in job growth.” Since economic output is workers times hours worked times productivity, this means the path to a full recovery in economic output is either going to be longer hours or an acceleration in productivity. That’s really the path we’re going to be on for a long time hence, now that the baby boom generation is beginning to be of retirement age. And if I may say so, it is a prime argument for allocating more GDP to the private sector, where productivity enhancements are generally developed, and less to the public sector. The government can keep redistributing the pie, but it would be better to grow the pie and government has had an abysmal record at doing so for roughly the last eight thousand years. We could hope for a better result in the future, but to do so would seem audacious.
Another growth sign from Friday were good as well. Non-manufacturing ISM reached an 11-month high at 56.8, far above estimates. All of this news helped push stock prices 1.5% higher, commodities prices 0.8% higher (despite a 1.1% fall in Precious Metals), and 10-year yields 10bps higher to 1.92%. Even TIPS yields rose, finally, by 8bps at the 10-year point.
In other inflation-bond-related news, Japan is reportedly considering a re-start of its inflation-linked debt market. As I illustrated recently, Japan’s inflation rate has been rising since early 2010, and as the tsunami effects finish passing through the system the core rate will likely rise to above zero and end the nation’s deflationary period. The last Japanese inflation-linked bond was issued in June 2008 when year-on-year core CPI was +0.2% but large investor losses in illiquid Japanese inflation markets in late 2008 combined with a plunge of core inflation to -1.6% in early 2010 meant the Ministry of Finance feared there would be scant demand for the bonds, which unlike those in other countries never carried a ‘par floor’ (so, in the case of persistent deflation, you could get back less than you invested in nominal terms).
That structure detail annoyed bond salesmen, but it is the right treatment. Otherwise, investors get a free option on deflation that means their real return will rise in a deflationary environment although it is constant at any positive level of inflation. That turns out to be painful to model, and awkward to trade, as asset-swappers learned to their/our chagrin in 2008. Having said all of that, I expect there will be a strong sentiment to add such a floor to the JGBi when and if the program re-starts.
On Monday, most of the day in the U.S. will be occupied with discussing the Super Bowl. But be aware that St. Louis Fed President Bullard will be speaking in Chicago at 8:55ET on the topic of inflation targeting. Listen carefully for any intimation that the Fed is trying to generate support for a policy of price level targeting as opposed to inflation rate targeting. I wrote way back in December 2010 about the Fed Chairman’s affection for inflation targeting, some of his prior words on the subject, and of the (better) arguments of KC Fed economist George Kahn. It’s worth a review if the topic comes up again. In the current context, whipping up a fresh discussion of price-level targeting would be another excuse to let inflation keep accelerating for a while. Under a price-level target, the Fed just promises to hit the price-level target on some future date, implying an average level of inflation between now and then. So, if for example the Fed wanted to run inflation a little faster right now, it could do so and pretend that this didn’t impair their credibility as long as they eventually hit that target.
I think the FOMC is looking carefully for ways to let inflation run faster without the bond market charging higher rates for that policy. If they can somehow convince investors that the 10-year average inflation will be 2%, even if it happens to be 3-4% over the next, say, 3-4 years, then 10-year nominal rates would stay down and real rates very negative despite an inflationary policy. I doubt they can pull it off, because I don’t think they have much credibility as it is. And, as Kahn pointed out in 2009, “[central banks] have no modern practical experience with such targets.”
The lack of practical experience, however, has never stopped this Fed before. I continue to marvel that investors are willing to be long rates here. You see, it is easy to announce the desire to price-level target. It is harder to actually price-level target.
[1] The BLS recognizes that the nation adds these citizens over the course of the year, but rather than make monthly estimates of labor force growth it adds them all at once in January. This year, the jump is large partly because it reflects the results of the decennial Census, which marks the actual population to the estimated population as of 2010.
Yee-Haw News And Ho-Hum Trading
Tuesday was another day of ho-hum trading following yee-haw news.
Anyone expecting a bloodbath following the ratings downgrades clearly has not been paying attention as the market sleepwalks through 2012. Stocks gained 0.4%, 10-year note yields ended virtually unchanged at 1.86%, and TIPS yields fell 2.5bps despite the proximity of a $15bln 10-year auction, now only 2 days away with 10-year TIPS yields at -0.22%.
The dollar slid somewhat, and commodities rallied. Indeed, the only market with a reasonable level of excitement was the Nat Gas market, where prices fell to levels not seen since 2002 (see Chart, Source Bloomberg). It is useful to remember that a significant part of commodities futures returns comes not from movements in the spot price, but from collateral return, normal backwardation, expectational variance, and a couple of other sources.

Natural Gas front contract. Spot gas has gone basically nowhere in a decade as supply responded to price.
Of course, Nat Gas also had the worst fundamentals of any commodity. Coming into the month, the mild winter and the added supply from frackers had combined to make NG the fourth-most-contango commodity (a commodity in contango is one which has deferred contracts at higher prices than nearby contracts, implying a negative roll return), with the worst momentum, among the universe of normal commodities. That combination means that it was not selected this month to be one of the commodities in the USCI basket. And that, in turn, means that USCI has appreciated by 3.79% this month while DJP, an ETN that tracks the DJ-UBS Commodity Index, is up only 0.02%.
European bonds closed mixed, with small gains in Greece, Portugal, Ireland, and Italy on the back of successful sales of short bills in Spain, Hungary, Belgium, and by the EFSF. But it isn’t very surprising that these sales of 3-month to 18-month bills were well-received, considering that the ECB has made hundreds of billions of Euros available virtually free to banks, which can earn an easy spread in this way. Let me know when Spain sells a 5-year note. Portugal also bounced a little today because the huge move yesterday was caused by Citi removing the country from its European Bond Index after its downgrade. Some investors who systematically wait for these “forced” moves to take the opposite side of figured to be getting a mild bargain. For a little while, anyway!
Fitch tried to grab the headlines back from S&P by saying that Greece is insolvent and will default. Really, though, at this point it’s about the over/under on when, not if, Greece defaults. Markets did not react to this news, nor to S&P’s statement that it will take ratings actions on European banks and insurers within the next month, some as early as the next week. This is potentially a bigger deal than the original downgrade itself. While a sovereign rating is a strange beast – since many investors will treat the sovereign as the closest thing there is to a risk-free investment in a particular country, no matter what its rating – ratings of financial companies affect actual contracts, collateral covenants under a CSA (collateral support annex to an ISDA), and credit lines. It was a downgrade to AIG that triggered one of the big failures in 2008, when the additional margin demanded by CSA agreements could not be met by the firm. And the problem for investors is that unless you’re the guy holding the CSA that has the rating trigger in it, you won’t know about the problem until it’s too late. Not that investors need any more reason to avoid financials than that their business model is irremediably destroyed and ROE will be permanently lower in the future, but the silent-but-violent nature of the blowup events means the only person holding the credit that is about to go under will be the person who is the last to hear about margin calls.
.
By now, I suppose we all recognize that one of the precipitating factors for this crisis, if not the precipitating factor, was the rise in leverage and in particular private leverage. There has been a lot of ink spent about the ‘deleveraging’ that is going on; as I have written several times before (most recently in “Scrooge Businesses”) the data say this is largely a myth. Domestic financials are deleveraging; Households are deleveraging slightly; Businesses are now re-leveraging. And of course, this is all occurring with the backdrop of the great increase of leverage that the federal government is generously taking on our behalf. I think that many of us feel that society must be deleveraged broadly in order to build the foundation for robust future growth. I want to take a quick moment here to talk about the difficulty of actually reducing overall leverage.
John Mauldin recently wrote (and he has written many times before on this topic, as have others):
“…a country cannot reduce private-sector leverage, reduce public-sector leverage and deficits (balance its budget), and run a trade deficit all at the same time…ultimately, there must be a trade surplus if leverage and debt are to be reduced.”
The statement is true from any given country’s perspective; Mauldin’s argument is that we can’t all run trade surpluses. That’s not quite true: emerging market countries are in general drastically less-leveraged than are the developed countries, so if we could just persuade them all to run large trade deficits to the developed world, we could shift our indebtedness to them. Let’s assume for the sake of argument that isn’t a serious alternative. What, if anything, do we need to do to reduce ALL debt and leverage?
It may seem easy. Each of us needs to save, pay down credit cards, and so on. We all know people who are doing this. And yet, the numbers say that in aggregate, it’s not happening. That’s because when Person A sells his house to person B, one is delevering but the other one is levering. When Person A defaults, he delevers but the bank who lent him the money increases its leverage. If Person A defaults and the government injects capital into the bank, then the government is taking on Person A’s leverage.
What the numbers tell us (see the charts in ‘Scrooge Businesses’ referred to above) is that the government’s increase in leverage is simply balancing out the decrease in the banks’ leverage, and households and businesses are just trading around leverage and not doing much. Is there anything we can do, absent borrowing lots of money from EM?
It turns out that there is one thing we can do, and you may be able to guess what it is by the fact that it has been the last refuge of heavily-indebted governments for many generations. Leverage is, notionally, the dollar value of debt divided by the dollar value of assets. Back in the 1970s and 1980s, one reason that overall leverage wasn’t growing too fast is that the real value of debt evaporated pretty quickly. That is, you paid off your mortgage with dollars that were worth a lot less than when you took out the mortgage, and the house was worth a lot more. This happened because the value of a mortgage is a fixed number of dollars. Inflation helped keep leverage in check by eroding those claims. As a society, we became used to this effect, and when inflation went away in the 1990s and 2000s, we continued to draw as much debt as we had been (and more) but when we went to pay it back, it was still a lot of money! Much more debt got rolled and refinanced, and the debt numbers climbed.
The solution to the debt/assets ratio is inflation, unfortunately. While many assets will not keep pace with inflation, some will. Below is a chart (Source: Enduring Investments) that I use in presentations in a different context – illustrating how a corporation’s capital structure drifts (to non-optimal levels) over time if debt is nominal. But the chart has meaning in the context of this discussion. The curves show how rapidly your leverage decreases under different inflation assumptions, assuming that you start at 100% leveraged, your assets keep pace with inflation and your debt is nominal. So for example, if inflation is 1%, after 10 years your leverage is down to 78% or so; if inflation is 7%, then your leverage is down to 45%.
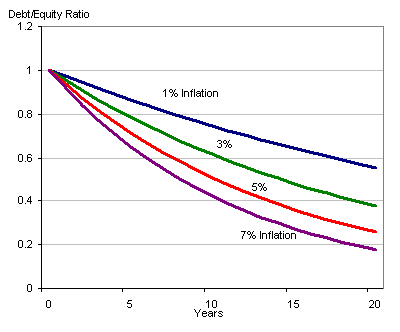
Inflation isn't all bad. If you're a debtor. And aren't we all?
Note that this has nothing to do with amortizing the loan. We are assuming no amortization here. So all you do is pay the interest, and in 10 years your leverage drops 150% more (55% instead of 22%, roughly) with 7% inflation.
So, do you still think the Fed is neutral on inflation? Do you still think the Committee really wants inflation pegged at 2%? At the very least, the FOMC wants inflation to be at the upper end of the band that allows it to retain its credibility. And, if push came to shove, I suspect they might allow an “oops” to happen if they thought a little more inflation might help delever society.
And it might. It just might.
.
Speaking of inflation, the next two days see PPI (Consensus: +0.1%/+0.1% ex-food-and-energy), which isn’t important, and CPI (Consensus: +0.1%/+0.1%), which is. I’ll have more to say on CPI tomorrow.
Deal, Or No Deal?
Investors on Friday felt a bit betrayed, while the man on the street said “See? I told you so!” as the Bureau of Economic Analysis (BEA) reported revised figures for the last several years of GDP growth. The BEA revised the last three years (plus 2011Q1) in the regular series of revisions, and also made some lesser revisions back to 2003. These revisions show the 2008/09 recession to be deeper and the recovery less strong, and help explain the strange phenomenon of an economy growing without adding new jobs. It isn’t that productivity was jumping; actually, the economy just wasn’t growing as fast as we thought. In other words, the job growth makes more sense now.
The economy is smaller than we thought it was – and Q2 was weaker-than-expected as well. Headline GDP was +1.3% versus expectations for +1.8%, and Personal Consumption was only +0.1% (economists expected +0.8%).
Incidentally, the revisions have generally been to lower figures from the original releases to the final releases, as well. Counting from the original GDP release in each quarter, the new revised quarter-on-quarter growth rate ended up lower in 22 of the last 29 quarters, and higher in only 6. In other words, don’t be too confident in the +1.3% that was announced for Q2!
Revising level of GDP lower, of course, raises the market-to-GDP ratio, and the ratio of profits to GDP, which is now at the highest level (biggest margins) in 60 years. The market, in other words, is even more over valued than it was on dependable long-term metrics like the Q ratio. (This doesn’t mean that the next 100 Dow points is lower. The question I am more concerned with is what the next 5-10 years looks like. If I can be consistently right on that, I’ll be consistently overweight when stocks are generally cheap and underweight when they are generally rich, and that ought to be good enough to do quite well over time. I feel the need to mention this because I think some people read this commentary as if I am writing about day trades. In general, I focus more on strategic positioning than tactical trading, although I try for a few good hit-and-run tactical trades per year).
Less-noticed was the Employment Cost Index, which rose +0.7% after +0.6% last quarter. This performance will worry some people who fret about wage-push inflation, even though the evidence that there is such an animal is sparse (wages typically follow inflation, rather than lead it). The ECI broke down as +0.4% on the wages portion (right on the trend of the last couple of years), but the +1.3% rise in benefits was the largest quarterly increase since 2005.
Noticed even less than ECI was the rise in M2 that printed on Thursday evening and put the 52-week rise in M2 at +7.9%. I had expected this rise to pause, flatten out a little bit, as the sudden acceleration is very unusual. But at least so far, there are few signs that this surge is a temporary phenomenon (see Chart). It also bears observing that since real GDP was revised lower, it implies that velocity slowed more than we thought as well (since MV=PQ, where M is the money stock, V is velocity, P is the price level, and Q is real output).
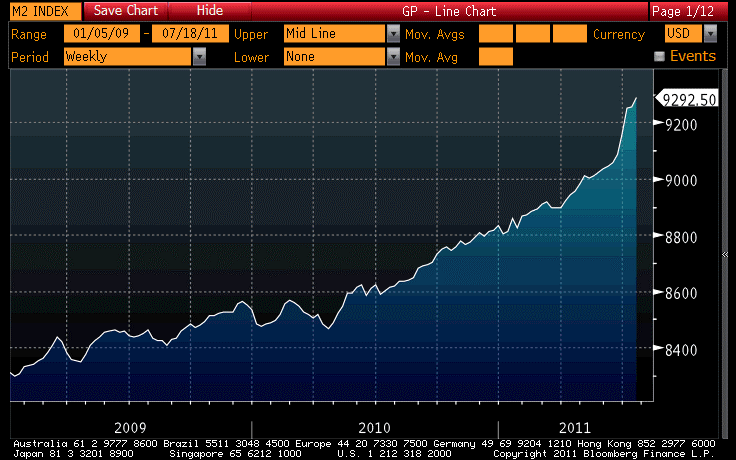
The multi-week acceleration in M2 is now noticeable even on a chart of the level of M2.
All of this news led stocks to open up weak, and bonds to continue their recent rally with 10-year yields falling to 2.80%. Equities rallied mid-morning when President Obama went on TV again to waggle his finger menacingly at the Congress. Soon, stock prices fell back and the S&P index ended the day -0.7%. As I said, bonds had a big rally, with yields falling 15bps on the 10y note. Real yields accounted for almost all of that, as the 10y TIPS yield fell 13bps to 0.36% – tying all-time lows from last October (see Chart). The reaction of real bonds implies that the bond rally is not due to a decline in inflation expectations, but rather to a decline in investors’ expectations of the long-run growth rate of the economy. At least, that’s philosophically the case; right now there are obviously a lot of other crosscurrents with the potential for the government to briefly stop spending money if a debt ceiling deal is not reached. Disappointment on Friday that a deal had notbeen reached also led the VIX index to reach its highest level since the Japanese tsunami.

10-year TIPS yields tie all-time lows.
Because the nominal bond rally occurred through the medium of real rates rather than inflation expectations, it seems that the rally was less due to flight-to-quality than it was a reaction to the GDP report and the revisions, which suggest that the resurgent economy was less resurgent than had been thought (and the return to monetary and fiscal policy even less than had been thought).
The reason that may matter is that, as I am writing this on Sunday night, there is talk that there may be an agreement to raise the debt ceiling that has been approved by Republican and Democratic leaders and by the White House. So far, it appears to be just the leadership that has agreed to the deal, but since both sides of the aisle have already had their cover vote (that is, they have each voted on the plan they wanted but that was doomed in the other chamber, so they can say to their constituents “I really tried”) there is a decent chance that this gets approved and we can again spend like drunken sailors. Yayyy!
The deal only cuts spending by $1 trillion over the planning horizon from the previous baseline, which means a drop in the bucket compared not only to spending (which would be something like $40-50 trillion over the next 10 years, so this is a 2.0%-2.5% cut) but to the deficit itself. It would be a down-payment on another $1.5 trillion cut that Congress would need to decide on by year-end, or that would in the alternative happen through automatic cuts to all government areas.
If the deal is real, and is passed by Congress and signed by the President, then the stock market will breathe a sigh of relief. At this hour, S&P futures are up 15 points in Sunday evening trading. But it certainly isn’t nearly enough to avert the downgrade that the ratings agencies have threatened, and fairly soon I imagine we will hear them say so. There was never a chance of default, unless the Administration had chosen petulantly to not pay the interest on the bonds with the trillions in revenue it continues to take in, and the deal doesn’t seem to avert the downgrade, which was the real threat all along…so I suspect this is a sucker’s rally in stocks.
Now, notwithstanding the foregoing I still don’t think a downgrade is a big deal either. Indeed, since I wasn’t worried about a default and I don’t think a downgrade to the sovereign credit is a big deal, the main reason I have been watching the monkey business on Capitol Hill is because of my love for country and my fear for its future and the future of my children. Nothing I have seen recently makes me feel much better about that, except for the fact that the citizens themselves seem finally to be getting moved to action. And in the U.S., that’s a mean feat.
Now, I did think of another negative possibility that could follow a US downgrade. A downgrade would also result in the downgrade of Fannie Mae (FNM) and Freddie Mac (FRE), which are under U.S. conservatorship and which only survive in their forms because of the extraordinary funding that U.S. backing affords. Without a AAA, it is much less clear that these entities will survive (although it has long been unclear whether they should survive). And that raises the specter of volatility in mortgage markets. It also might help explain the bid to Treasuries, because while there are few investors whose mandates will require them to sell sovereign bonds that are downgraded from AAA to AA, there are many more investors who hold agency securities who may have such mandates. Where does an investor who needs to sell Fannie Mae agency bonds turn to invest that money? Well, turning to the sovereign herself makes some sense.
In my current job I don’t see those flows, as I might have if I was still on the sell side, but I wouldn’t be surprised to hear that Asian accounts have been sellers of agencies for Treasuries.
.
One or two clean-up items from last week: on Thursday, Richmond Fed President Lacker said:
“The additional monetary stimulus initiated last November raised inflation and did little to improve real growth… Given current inflation trends, additional monetary stimulus at this juncture seems likely to raise inflation to undesirably high levels and do little to spur real growth.”
I missed this when I wrote Thursday’s comment but it is worth noting. So much for the new, tighter communications policy! This is just what I have argued for some time, but it is very surprising to see coming out of the mouth of someone in policy circles.
On Friday, St. Louis Fed President Bullard commented that the Fed’s large balance sheet could cause an inflation concern if it isn’t shrunk when it is time to shrink it. Hey, news here: see the M2 chart above. It’s entirely possible that ship has already sailed! Bullard also said that the Fed is unlikely to add any more stimulus, because inflation is now rising. I’ve said this in the past as well. Last year, core inflation was declining, so the Fed’s two mandates were not in conflict – adding more money helped avoid deflation and helped growth (well, anyway, that was their theory). That is no longer the case; the twin mandates are in opposition now so there is a much bigger hurdle for outright stimulus. Another bank crisis might do it, though.
.
The Wall Street Journal had an interesting story on Friday, entitled “Lending Markets Feeling the Strain.” The story details how investors have been pulling lots of money out of money-market funds, supposedly because individuals are afraid of default on the government securities that are held in large quantities by those funds. This is the second explanation I’ve seen of the money leaving money funds, and this makes more sense than the “elimination of Reg Q” theory. In this case, we’ll soon know if it’s accurate because once a deal is reached and there is no default coming, the money should flow back in, right? But that isn’t the reason I point this out. I want to make a different point.
Money flowing out of money funds affects the funding markets, but most individual investors never really see that dynamic. It isn’t very important right now, anyway, since banks are dramatically over-funded thanks to the Fed. But moving money from money market accounts into transactional accounts – checking accounts, cash, brokerage accounts, etc – is a threat to inflation in assets or goods and services.
When transactional money increases, prices of goods tend to increase; asset markets, however, sometimes act as a ‘relief valve’ for inflationary pressures, which end up spawning bubbles rather than triggering inflation in goods and services. People who have extra cash, courtesy of the extra amount sloshing around in the system, can either spend that cash or invest it. If they invest it at increasing market valuations, it drains some of the inflationary pressure (I need to stipulate “increasing market valuations” in the argument, because obviously every dollar I spend buying equities is just transferred to the person selling me his shares) that would otherwise bid up goods.
But what happens when the markets start looking expensive and/or dangerous for everyone, across a great many asset classes? Then investors hold more cash – and that’s exactly what they are doing. And that is fine as long as those cash balances sit there in those checking accounts or in cash. What happens, though, if investors fear those cash balances are going to be taken, either by government fiat or by inflation? Then the money gets spent instead, and moves from asset markets to goods markets.
We don’t really know how this dynamic works. We don’t know how fast money moves in these circumstances. We have never observed this sort of situation before, and we can’t recreate it in the lab. I raise it as a point of curiosity, and a matter for discussion and debate, and as a warning. It is just another risk to watch, as if we didn’t already have plenty of them. It is not today’s trade.
.
On Monday, we’ll react to the weekend edition of Deal-Or-No-Deal. The ISM will be released, and is expected to be approximately unchanged (Consensus: 55.0 from 55.3), but unless there is a real shock that will be largely ignored while investors watch the votes on Capitol Hill. Passage of a deal will mean an equity rally that many of us will look to sell into if we have a chance. Failure…well, let’s not even think about that.
Of Haircuts and Helicopters
Bonds shrugged off somewhat-upbeat economic news and stocks managed to fade late in the day. As bullishly as the equity market was behaving two weeks ago on bad news, it’s now behaving bearishly on good news.
Initial Claims came in nearly 20k better than consensus (although there was a slight upward revision to last week’s figure), tossing a 398k figure onto the screens at 8:30ET. Two out of the last 3 weeks have been below the 420k line, and it’s probably the case that the underlying trend is improving modestly. Whether 380k or 400k or 420k, though, it isn’t anything to write home about and other measures of labor market health – notably the “Jobs Hard to Get” subindex of the Consumer Confidence survey – continue to look poor. Labor is a lagging indicator, sure – but it is unusual for it to lag this much, this far into what most economists would call a recovery.
The Administration made a play late in the day to get an equity rally going, by leaking the news that “The U.S. Treasury will give priority to making interest payments to holders of government bonds when due if lawmakers fail to reach an agreement to raise the debt ceiling.” Well, duh. Anyone with a sharp pencil can see that there’s enough revenue to pay the interest on the bonds, and the military, and social security, and a few other things as well. I haven’t yet seen an apology from anyone for the scare tactic of threatening to not send Grandma her Social Security check, which I presume is prioritized over, say, the National Endowment for the Arts.
It is somewhat scary that the Administration felt the need to leak such “news;” it implies that they are starting to think there is a pretty good chance that a debt ceiling deal doesn’t get done, or at least doesn’t get done before the markets melt down. Tomorrow is the next-to-last trading day before the August 2nd deadline, so prepare to go into the weekend not knowing. Will investors on Friday bet that there will be a deal announced over the weekend, and so go home long? Or will they bet that there will not be a deal announced, and so go home short? Or will they have some common sense and go home flat? (Don’t put money on the “flat” bet.)
It also seems increasingly likely that Treasury debt will be downgraded by one or more of the agencies. I have noted a number of times here why that’s nonsense: the Treasury can always replace interest-bearing notes with non-interest-bearing notes called dollar bills, regardless of the debt ceiling. Therefore, the only reason the U.S. would ever default is because it just doesn’t want to pay. But no issuer is creditworthy if it simply chooses not to pay – the rating is supposed to evaluate only the ability to pay and as long as the U.S. controls its own printing press there will always be a 100% ability to pay.
I find the gnashing of teeth over the downgrade in the ‘borderline humorous’ category. I think it mainly affects Americans in the ego department. The Wall Street Journal today said “Still, it’s hard to grasp a world in which the one security regarded as ‘risk-free’ is rated lower than the government debt of Austria, Denmark, Finland, the Netherlands and Hong Kong (all AAA.)” Really? Is it that hard to grasp that people incorrectly regarded something as risk free that isn’t? It isn’t like that hasn’t happened in a while. Home-ownership and ‘stocks for the long run’ spring immediately to mind. Besides, nominal debt is never risk-free, because it is exposed to inflation, so it’s the “regarded as” that is the error here. TIPS are the true risk-free instrument (or as close as one can get) in the U.S., and TIPS do not have competition from Austria, Denmark, Finland, the Netherlands, or Hong Kong. Maybe we can finally dispense with the idea of nominal Treasuries as the risk-free instrument, which is a Ptolemaic view of the fixed-income heavens anyway. Let’s start calling them Treasury Inflation-Exposed Securities, which is after all what they are.
Now, fortunately most of Wall Street (the people who should know because they talk to all of the investors) finally seems to agree that a downgrade from AAA to AA (which, by the way, would be a large single-downgrade move – be prepared for a rally if it’s just AAA to AAA- or AA+) would not cause most investors to sell Treasuries. Double-A is still very good and it is very rare to have a mandate that distinguishes between really-good credit and really-good (but not quite as good) credit.
One place where people worry is that in principle, a downgrade could cause dealers to require larger “haircuts” on Treasuries used as collateral. For the non-initiated, a “haircut” is when your dealer says you can only borrow, say, 95 cents against an asset that is worth one dollar. In general, a haircut is larger the higher (a) the volatility of the collateral’s price; (b) the illiquidity of the market the collateral trades in; and (c) the difficulty of assessing the value of the collateral. A dollar bill receives no haircut. A T-Bill receives very little haircut, maybe 1% or less, because its price is highly stable, the market is very liquid, and it is very clear what the value of the collateral is. A long Treasury bond receives a larger haircut, because its price is more variable even though the market is liquid and the price clear. A corporate bond gets a bigger haircut still, because it is more variable, the market for any particular credit is less liquid, and a structured corporate bond on the same name, compared to a bullet bond, gets an even bigger haircut (at least in principle) because it is less clear what the price really is.
So will haircuts change on U.S. Treasuries? I don’t see why they would, since (a) the market shouldn’t be any more volatile (in the medium-term, anyway), (b) the market will be just as liquid and (c) just as transparent. Remember, the question for a haircut is “how fast can I sell it at receive something close to the marked price?” If the price changes, then the collateral may be worth less, or more…but the haircut percentage shouldn’t change just for that reason.
Now, there is one ex-theoretical reason that haircuts might change, and that’s because a downgrade would give dealers an excuse to change haircuts on their clients. This is a dangerous game, because it would decrease the leverage available to hedge funds and would force some position unwinds – not just in Treasuries, but in all kinds of asset classes where risk positions are collateralized by Treasuries (that is, all of them); moreover, if the customer repo haircut changes then there will be pressure on the interbank haircut to change. Since dealers rely on the leverage afforded by being able to use their bond inventory as collateral, this would force dealer leverage to decline, causing some unwinds and by-the-way reducing further the future ROE (one element of which is the financial leverage used).
In the worst case, a change in repo haircuts could cause a significant unwind of long Treasury positions, driving interest rates higher and – as a side note – leaving dealers with lots of cash and lots of reserves rather than lots of bonds and lots of reserves. The latter configuration is positive carry; the former is flat carry and increases the incentive to lend these funds (especially as rates would be rising). Perversely, then, we could get higher rates but also an expansion of credit and the attendant inflation pressures, simply because Treasuries are less valuable as collateral. This would be good for an inflation consultant/trader/advisor (ahem) and good for the small business that can finally get credit, but bad for everyone else.
Let me highlight that that’s the “worst case.” I doubt that haircuts on Treasuries will change, even with a downgrade, unless dealers are just looking for an excuse to squeeze more collateral out of clients.
.
A good friend who writes a daily note I’m lucky enough to receive made a very insightful point tonight. He said, and I echo him, that it’s important to remember that the market can only be preoccupied on one point at a time; as soon as the debt ceiling deal is sealed, the markets will start focusing again on the European mess. Or, I would add, on the CMBS mess.
The Commercial Mortgage-Backed Securities (CMBS) market has been tagged as the ‘next disaster’ by many observers for quite some time. We have become all-too-familiar with the risks of issuing high loan-to-value mortgages to unqualified homeowners in a real estate market downturn. Well, the same thing happens in the commercial world, although there aren’t really any ‘no-doc’ or ‘liar’ loans. The problem is still that high LTV mortgages were made on properties that are now worth much less.
This is one reason, I think, that CMBS issuance has been so heavy recently – dealers have been trying hard to limit their direct exposures as much as possible. The hammer has not yet come down, but there are some signs that it is hovering. Today Citigroup and Goldman withdrew a $1.5bln CMBS offering after S&P said the transaction would not get the rating that Citi and Goldman expected. Now, the firms could have added some more credit enhancements and gotten the deal to the rating needed, or raised the interest rate it was packaged to, but then investors in other CMBS deals would start (and probably already are starting) to question why their CMBS deal doesn’t have that yield. Pulling the deal is a curious move that either says the rating was way off or, possibly, that some investor group was willing to buy the whole thing without the rating.
But if it was for the latter reason, I don’t think the head of Citigroup’s CMBS group and the head of Goldman’s CMBS group would have both resigned this week. Indeed, if there is a lot of money still to be made there, it would be weird to see either guy resign, much less both of them. Keep a watchful eye on CMBS headlines in the near future! This would be a surprise that isn’t, really, a surprise except for the timing.
.
Tomorrow, we get a slew of economic data. The 2nd quarter ECI (Consensus: +0.5% versus +0.6% in Q1), and GDP (Consensus: +1.8%, +0.8% personal consumption) will be released at 8:30ET. The Chicago Purchasing Managers’ Report (Consensus: 60.0 vs 61.1) and NAPM Milwaukee (Consensus: 56.9 from 59.3) will come out at 9:45ET and 10:00ET, respectively. There is also the revision to the month’s Michigan Confidence figure. But the real point of the trading day is what happens going into the weekend (which is also the month end). I have no real feel for what is going to happen, so I will maintain my current, conservative, stance.
“No, Mister Bond, I Expect You to Die!”
Warning: excessively long post. And I apologize about the many different fonts on the various charts!
That was not the Payrolls number I was expecting, nor the number the market was expecting. The economy created only 18k new jobs in June; combined with a net downward revision of -44k to the prior two months, the net was negative. That wasn’t the only bad news. The Unemployment Rate went back to 9.2%, up from 9.1%. That means it is 0.4% above the lows set in March, and here’s why that’s scary: when the Unemployment Rate rises 0.5%from a low, at least since the 1960s it always has gone at least another 1% higher or more after that.
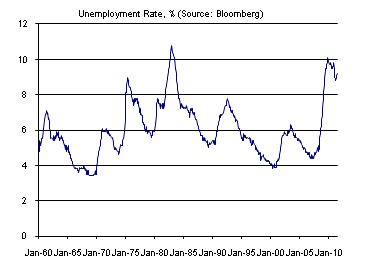
Once the Unemployment Rate starts to rise, it usually keeps rising for a while.
Past may not be prologue here, since there aren’t many examples of the Unemployment Rate descending a lot and then bouncing back at least 0.5%…but, by the same token, there aren’t many examples of the government spending trillions to push the Unemployment Rate down artificially without having organic growth recover. More on that later.
The report is rotten clear to the core. The Labor Force Participation Rate fell to 64.1%, another multi-decade low (see Chart).
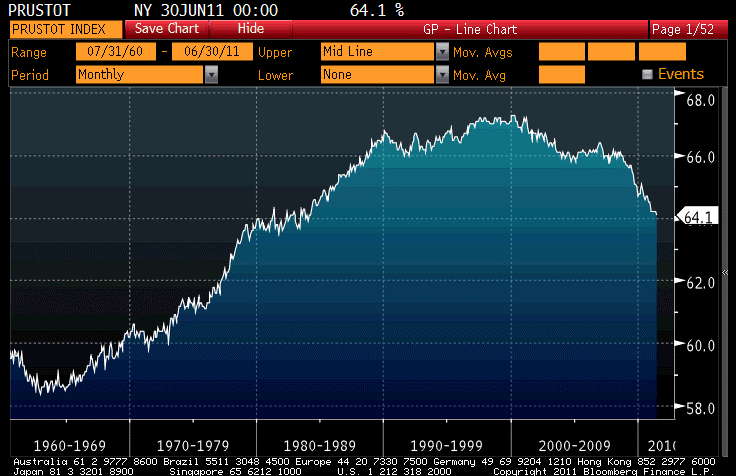
Labor Force Participation Rate continues to dive.
One more Employment-related chart: this is one of my favorite charts of labor underutilization. It shows the number of people (in thousands) that are not technically in the labor force, but nevertheless want a job now and would take one if it was offered. To be “not in the labor force,” you can neither have a job nor be looking for one. This includes students and retired people, as well as people who have given up looking for work. This indicator went to new all-time highs – again. More than six and a half million people aren’t even looking for work, but wouldtake a job if one was available. That’s 1.5mm more than normal, and in my opinion at least those extra 1.5mm ought to be considered as part of the unemployed. (The effect on the Unemployment Rate itself, in case you’re curious, would be to push the ‘Rate to about 10.1%).

This is a very evocative series - people who aren't even looking, but would take a job if one was available.
So this is pretty ugly all around. And the curious thing is that there wasn’t any obvious sign of this coming. ADP didn’t show the same weakness, and although Initial Claims is rising it didn’t suggest weakness this profound. For the time being, we need to regard this as an aberration from the presumed underlying trend of 100k or so. Note that that’s a pretty weak trend, and not enough to keep the Unemployment Rate from rising, but it’s better than outright contraction. So in my opinion we can reject the null hypothesis that the jobs situation in this country is improving, but we can’t reject a null that the jobs situation is treading water.
As an aside, I wonder at the size of another effect that I am sure is operative but presumably is pretty small right now. I wonder by how much jobs are underreported simply because more people are working off the books due to the health care law and other onerous government requirements? As if we need another reason to repeal Obamacare (and polls continue to indicate that a majority of Americans favor repeal) there is this one: if the law pushes more economic activity off the books, it is activity that the government can’t tax. See: “Greece.”
Now, some people are saying that the weak Jobs figure puts pressure on the Fed to roll out QE3. I cannot think why that would be the case. It seems more reasonably to be evidence supporting the notion that QE2 didn’t do very much…isn’t it? Agreed, it is going to put pressure on the Committee to “do something,” but it would seem to me the last thing they’d want to do is something which has already failed. The definition of madness is to do something over and over again and expect a different result, right?
Some folks also think that the current spate of weakness means that the Congress ought to stop talking about serious deficit reduction. Most of those people are Keynesians (e.g., Krugman, who on Friday said “The situation cries out for aggressively expansionary monetary and fiscal policy,” which makes you wonder how the actions of the last few years don’t qualify as – at least – aggressive) who have never questioned the efficacy of excessive government spending despite copious prior evidence that it doesn’t have a lasting effect (See: FDR, George W. Bush). They are not likely to put any more weight on the most recent experience, which at best showed that massive deficit spending has a short-term effect, and seems not to have the ‘kick-start’ effect that most proponents considered almost automatic. And we haven’t yet seen the other side of the coin which must come, when the deficits must be cut and the short-term effects run the other way. Or perhaps we have begun to see this – as state and local governments continue to lay off workers, that is certainly contributing to the rise in the Unemployment Rate. Push it down with trillions, watch it rise back when the trillions are gone…
But I think Congress will continue to talk about deficit reduction, and will reach an agreement to cut the deficit by at least 1-2 trillion over the next decade as part of an agreement to raise the debt ceiling. Do you know why I think that? Because the debt ceiling once raised will not come back down, but the budget cuts can easily be rescinded whenever they like. Like, for example, if there were “economic emergencies” that demanded the cuts be restored. Since no deal the two sides make today will have anything to do with next year’s budget, they’ll reach some sort of agreement or I’ll eat my hat.
.
In Thursday’s article, I noted the recent rise in the M2 money supply rates of change to post-2009 highs. I meant to say a little more about that. I should have added that the latest week of data was for June 27th, so some of the most-recent surge may be quarter-end. The Fed may also have wanted to let the market get a little extra liquid with Greece in the backdrop – that explanation is somewhat more pleasing since the jump in M2 rates of change isn’t a one-week phenomenon but the rates of change have been edging higher for a few weeks now.
But there’s a problem with that explanation, and that’s the fact that the Fed doesn’t control M2. In fact, the relationship between M0 and M2 – the money multiplier – has been unstable since the wall of money was first unleashed a few years ago. And that leads to the real fear, which is that the wall of money in M0 is finally starting to pass into M2. That is, the fear is that the money multiplier is recovering.
Until now, if the Fed added more reserves through LSAP it manifested in higher M0 and a lower multiplier. That is, M2 didn’t really show much effect. The multiplier I first discussed here is down to 3.5 now that QE3 is complete. With the monetary base at $2.6 trillion, if the old 8.5 multiple were to suddenly re-appear tomorrow (and I am not saying I expect that) then M2 would rise from $9.1 trillion to $22.1 trillion. That rise in transactional money would almost certainly be extremely inflationary! The point is that if the multiplier, which collapsed mainly because the Fed was paying banks to hold reserves, were to suddenly start rising again, it becomes a clear and present danger requiring aggressive and determined response from the central bank – which, with the Unemployment Rate rising, would be ticklish to say the least.
Now, I wrote Tuesday about the conversion of Ron Paul and the implications of his plan for explicit monetization of the debt (effected, in his plan, by having the Fed “tear up” the bonds it has bought) on the risks for inflation. And now I’ve just written about the acceleration in money supply growth and the risk that the multiplier could rebound for reasons we may not correctly anticipate (or more to the point, the central bankers may not correctly anticipate). But what about the implications for the bond market, and other markets, generally?
Both of these things are potentially ‘tail events,’ but they are both strongly inflationary. We’re not talking here about a rise in core inflation to 2%, which is roughly where my models have it going over the next year-plus based on historical relationships with the money supply, the dollar, private debt, and so on. The risk is that it goes much higher, and surprisingly quickly. Not since the early 1980s have we seen Core CPI accelerate more than about 1% in a year, but from February 1978 to June 1980, Core CPI rose from 6.2% to 13.6% and from August 1973 to Feb 1975 Core CPI went from 3.2% to 11.7%. Remember, this is core inflation so the OPEC embargos are not the cause (in the 1973-75 example, the removal of wage and price controls probably contributed as official prices rose to match black market prices). So an acceleration of 5% or more in a single year is not impossible…and back then, while monetary policy was irresponsible the Fed was not purchasing trillions of dollars’ worth of bonds and then (if Congressman Paul has his way) ripping them up.
I think it’s important here to point out that I am not talking about probabilities. I am not predicting 7% core inflation next year. My point forecast is 2.1% for 2012. But the distribution is extremely skewed to higher outcomes, and has fat tails in that direction as well. I am talking about possibilities, and they’re worth talking about since they’re no longer hundred-to-one long shots but maybe five-to-one or ten-to-one. Since 7% or 13% core inflation would pretty much destroy most plans based on assumptions derived from the last twenty years, it’s not a bad idea to ask how your plan might fare in such a case. Here’s a quick cut giving my basic thoughts; if you want more color then ask me about becoming a client!
Equities
For starters – even if you think that equities are an inflation hedge, you should be aware of this fact: since 1881, when inflation has been between 1% and 2% the average Cyclically-Adjusted P/E (CAPE) has been 19.97; when inflation has been between 2% and 4% the average CAPE has been 17.95; when it has been over 8%, the average CAPE has been 10.12 (Source for those numbers is Robert Shiller, via http://www.irrationalexuberance.com/). So let’s assume that prices rise 10%, and corporate earnings rise 12% (certainly, corporate earnings cannot rise much faster than inflation overall, although there certainly would be winners and losers). Then we would expect the market to fall precipitously. Let’s suppose that cyclically-adjusted earnings are $10 in year 0:
Market index in Year 0: 17.95 x $10 = 179.50
Market index in Year 1: 10.12 x ($10 * 1.12) = 113.34
As long as you’re willing to wait for a while, your ‘inflation hedge’ will end up doing okay, but “a while” might be 20 years. In the meantime, you’re staring at a 37% loss in year 1. It is much better to be underweight stocks when conditions (in particular, interest rates and inflation) are perfect, because they don’t do very well in the transition to less-than-perfect!
Commodities
There are a lot of people getting this wrong right now. Gary Shilling, who I think is terrific, in a recent note made the same mistake so many people make: he says that coming recession in China, and weak growth elsewhere, will tip the supply/demand balance and trigger much lower commodity prices. As far as that thought process goes, in a ceteris paribus way, it is surely right. But the much bigger effect is the effect on the money:stuff exchange rate. The error being made here is analogous to the one made by investors in stocks who think equities are inflation-protected: they are right about one effect, but they miss a much bigger effect. In the case of stocks, they are missing the reduction in the multiple that is associated with higher inflation outcomes, and that effect dominates the rise in nominal earnings that goes along with higher prices. In the case of commodities, the two effects are ordinarily unrelated so normally the main thing you have to worry about – and surely the most important thing for a short-term investment in a single commodity – is the supply/demand balance. More acreage planted and higher yields in corn will assuredly push prices lower.
But prices are denominated in dollars, and if the supply of dollars relative to the supply of corn rises, then the relative price of corn may rise even if there is more corn this year than there was last year. The mistake we make is that we think of dollars as being some fixed thing, when it is more accurate to think of them as a counter with no intrinsic value of their own. If you’re up $50 in a casino, you flip the dealer two bucks. If you’re up $5000, you slide him a hundred-dollar chip. Why? Because in the latter case, dollars are less scarce.
If the money supply rises 4% next year, then the supply and demand of commodities will dominate. But if the money supply rises 50%, the supply and demand simply won’t matter – all prices will rise. And that is potentially a much larger effect, although one reason I like commodities is really that there are two ways to win: you can win the supply/demand game, or if there is another recession and a QE3, you can win on the too-many-dollars game.
Bonds
Obviously, a huge rise in inflation will absolutely kill nominal bonds (and also any TIPS other than very short-dated ones, although in TIPS’ case their return will catch up over time while that will not happen with nominal bonds), and that is all I need to say about that! But I think bonds are in trouble anyway. The chart below is one I’ve run before; it shows the 10-year Treasury yield on a logarithmic scale through the entire multi-generational bull market.

Logarithmic scale - the secular bull market in bonds technically is still in place.
I am on record as saying that the bull market is already over, and that yields are slowly working their way to the top of this channel and through it (as of this month the top channel line is at 4.27% although there is a secondary one that comes through essentially at this year’s high yields). We are right now roughly in the middle of the channel and technically speaking rates have done nothing “wrong” yet. A weak economy would seem to keep a lid on rates, but that is true only if the Fed and the Treasury can resist throwing more fuel on the fire by rolling out more stimulus. I don’t think they’ll be able to resist for very long.
What is concerning is not the eventual move from 3% to 4% (which, incidentally, I expect we will not see until early next year unless the rise in M2 is really the beginning of something big). The risk is that somewhat higher interest rates will make the government’s fiscal position that much less tenable. The interest on the Federal debt is $242bln in the President’s Fiscal 2012 budget, and already is expected to grow to $494bln by 2015 (because of a larger debt but also because of the interest rate assumptions: 91-day T-Bills are expected to rise to 4% and 10-year notes to 5%). Suppose rates instead went to 7% and 8%? We have seen recently how uptrends in yields in Greece, Ireland, and Portugal helped precipitate crises at the same time as they were telegraphing the crisis. My concern is not so much that bond yields go to 5%, or even higher. My concern is that they go high enough to start the death spiral.
Now, that’s a strategic view: nominal bonds are going to get crushed. Tactically, though, let me return to what I said earlier. Congress and the Administration are going to come to an agreement on a big deficit reduction measure, with high confidence, in the next couple of weeks. When that is announced with much fanfare, bond prices are going to rally, the ratings agencies are going to take the U.S. off negative watch, and everyone is going to make snide comments about Bill Gross. But when that is done, we’re going to see bond yields start to slip higher and it will be the beginning of the end.
Wounded Worrier
The stock market continues to power ahead, with the S&P up another 1.1% today and about 7% over the last 8 trading sessions. For those keeping track that’s roughly a 220% annualized growth rate, but the bulls don’t seem to care about such trifles. And, indeed, the optimists clearly have the upper hand as the indices power to a seemingly unavoidable rendezvous with the destiny of the year’s highs. Today, the market was launched higher following a rate hike in Europe (and hints that more, incredibly, are yet to come) and a slightly stronger number from a second-tier jobs report, and sustained their gains in the face of a 4.1% rise in gasoline prices.
You can call this a “risk-on” trade if you like; commodities broadly were up 1.5% and Treasury yields rose to 3.14%. But you could also term it a “growth” trade. A recovery that is about to gain steam suddenly would leave the same market footprint: higher commodities prices, especially energy commodities, rising interest rates, and rising stocks.
I personally am short stocks, but fortunately through the medium of options. Having bought options at low vol, I am losing on delta but not losing doubly by watching vols drop further. Indeed, it is somewhat incongruous but implied volatilities have not been declining over the last few sessions despite much higher equity prices.
However, a worrier doesn’t have to look very far to find worries (and a bull doesn’t have to look very far to find a wall to climb). Rate hikes into a sovereign debt crisis would be a good place to start, although at the same time the ECB suspended its minimum credit-rating requirements for Portugal so it is strangely being both tight and loose at the same time.
The general loss of ECB credibility could be a worry, although to me the whole institutionalized crazy routine makes me think more of the scene in Blazing Saddles where the sheriff pretends to be taken hostage by his own split personality, in order to manipulate the crowd. I don’t think the manipulation routine in this case is working very well, but I just prefer to believe that over the alternative that Trichet has simply gone mad. Today he insisted that the Irish government, which recently has threatened to force senior bondholders in the country’s banks to take losses as a way of ‘sharing the burden,’ should instead respect prior agreements. “All the plan, nothing but the plan including all what has been said at the time of the approval of the plan,” quoth Trichet expansively, apparently numb to the dramatic irony of demanding utter fidelity to precedent on one hand while rewriting collateral guidelines with the other hand.
The growth camp got a mild boost from the ADP figure, which was stronger-than-expected at 157k (versus 70k expected). That got people excited, or perhaps I might even say overwrought with joy, about tomorrow’s Employment data. Initial Claims came down to 418k, which is still high although down from 432k last week. It seems weird, though, to get very excited about beating expectations when that happened mainly because the expectations were stupid. The ADP number was actually right on the regression line (see Chart below) – it was last month’s number that appears to be the aberration. Economists were just too morose. Oh joy!

Economists shouldn't have been so surprised by ADP, which was right where it should have been given Claims.
The ADP figure suggests Payrolls should be around 162k on the coarse regression I use, but even though expectations for that number rose today, they’re still well below that number (Bloomberg reports 105k but that includes people who didn’t change their numbers on the new information). There is a good chance of a high-side surprise in Employment tomorrow, although it shouldn’t be a surprise especially after today’s data. A 150k jobs gain is no reason to set off fireworks, folks, and the stock market is already priced as if it is known that job growth will shortly triple from that level. But if (probably when) we get that surprise, the market will leap higher, especially if the Unemployment Rate falls from 9.1% – it is expected to be unchanged. Personally, I will use that opportunity to add to my put position, although I will not do so if stocks blast through the year’s highs.
.
There was again news today about the notion of changing the cost-of-living adjustment in Social Security so that it uses chained CPI rather than the current “standard” CPI. Note this is not a change to CPI, and will not affect TIPS (which were unchanged today versus a declining nominal market), but rather is a change to the index to which Social Security will be statutorily indexed to.
There is a lot of debate about whether or not this is a “tax increase” or a “benefit cut,” but that misses the point. If you want to call this a tax increase on the old, to keep the young from having to pay back in the future the money that we have to borrow today to pay those benefits, then fine – although calling it a “tax” just makes the political deal-making that much more difficult, the description I just used at least captures the notion of what is really happening: this is a question of a transfer more than a tax.
And, as someone who doesn’t yet receive Social Security, doesn’t ever expect to, and yet will be paying for it throughout my entire life, I would say – isn’t it about time? The transfers have run the other direction for decades: young people have pledged trillions of dollars far into the future to pay the Medicare and Social Security entitlements. When there was some chance those young people might eventually receive similar future entitlements, that arrangement was arguably fair – an intergenerational transfer that could be thought of as a low-interest savings program. I am paying extra money now so that my future-self can receive money. But because it was never built as an actual savings program, that intergenerational transfer turned into a Fountain of Youth that politicians could bathe in by pledging more benefits to politically-active retirees. Now that those programs are clearly not viable – Medicare especially: in principle Social Security could be made temporarily viable with changes to entitlement age etc – the time is probably right to ask, “why shouldn’t there be an intergenerational transfer back to the young from the old?” The answer, of course, is that no one will ask that question in the right way, and explaining it won’t fit in a sound bite. I fear for my country, and this is one reason why.
.
One additional worry just cropped up today with the release of the weekly money supply numbers. There was a very large increase in the latest week, which brings the annualized 13-week growth rate to 11.1% (highest since March 2009), the 26-week growth rate to 7.0% (highest since June 2009), and the 52-week growth rate to 6.1% (highest since November 2009) – see Chart.
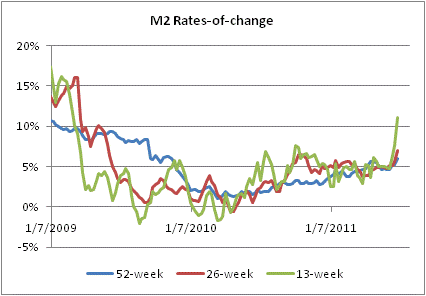
I start this graph in 2009 so the crazy spikes from 2008 don't distract us. M2 is jumping.
While I am trying not to get alarmed yet, it is interesting to reflect on this chart in conjunction with the resurgence in equities and the sudden (and largely unexpected) recovery in commodities. Commercial bank credit, which has been contracting on a year-on-year basis since early 2009, is essentially flat (-0.1%) over the last 52 weeks (see Chart).

Bank credit is still technically contracting year-over-year, but only by a hair.
So, perhaps the stock market has it right, and the ECB is right to begin tightening. I am skeptical about that possibility, especially since the European crisis is far from over. And yet, that set of facts is consistent with the dollar being stronger than one would expect given 11% dollar M2 growth and an ECB tightening, and with the U.S. 10-year rate being at 3.14% instead of at 5%.
It is a set of facts and hypotheticals that I am not comfortable with, and indeed I think this optimism will prove to have been premature. Moreover, the stock market has already priced in the money-stimulated recovery – that’s what the rally from last August was theoretically about (or so we were told) – and I am always reluctant to pay for the same item twice. But there is certainly a chance that the market is right this time.
Goodbye QE2, We Hardly Liked Ye
QE2 is now over. Long live QE2! The following table illustrates the effect of the second bout of quantitative easing from start to finish. I’ve chosen two potential start dates – the actual start date of November 12th last year, and the date we knew we were going to get QE2: August 27th, when Bernanke more or less said it would happen when he discussed “Policy Options for Further Easing” in his speech at Jackson Hole.
|
Aug 27, 2010 |
Nov 12, 2010 |
Jun 30, 2011 |
Net (Aug-Jun) | |
| 2yr Treasury Note |
0.55% |
0.51% |
0.46% |
-9bps |
| 10yr Treasury Note |
2.65% |
2.79% |
3.16% |
+51bps |
| 10yr TIPS |
1.02% |
0.66% |
0.70% |
-32bps |
| 10yr Inflation Swaps |
2.10% |
2.51% |
2.81% |
+71bps |
| Grains (DJ UBS) |
100.2992 |
115.8296 |
117.3552 |
+17.0% |
| Livestock (DJ UBS) |
73.7738 |
70.6753 |
72.3312 |
-2.0% |
| Softs (DJ UBS) |
127.0117 |
170.2196 |
197.7473 |
+55.7% |
| Gold |
$1236.00 |
$1365.50 |
$1502.80 |
+21.6% |
| Ind. Metals (DJUBS) |
329.6994 |
375.1198 |
392.2899 |
+19.0% |
| Crude (WTI) |
$75.17 |
$84.88 |
$95.42 |
+26.9% |
| Retail Unleaded Gas |
$2.682 |
$2.886 |
$3.541 |
+32.0% |
| Dollar Index |
82.918 |
78.082 |
74.404 |
-10.3% |
| Stocks |
1064.59 |
1199.21 |
1320.64 |
+24.1% |
| M2 |
$8,650.5 bln |
$8,767.9 bln |
$9,067.4 bln |
+4.8% |
So let’s analyze the effect of the Fed’s purchase of $600bln in Treasuries (plus reinvested coupons and principal payments) over seven months and change. If the Fed’s intention was to lower the 2-year note yield, then mission accomplished: 60% of a trillion will apparently buy you 9bps (only 5bps if we just count from November). If instead it was trying to lower longer-term rates, which was supposedly the more important goal, it failed utterly. 10y yields are half a percent higher. Now, the Fed did succeed in decreasing the real cost of debt; TIPS yields fell 32bps (although all of that happened in the Aug-Nov period) while expected inflation increased steadily.
The farmers like Bernanke, of course: Grain prices are up 17% since August, even after today’s 4.4% drop in Corn and 8.9% shellacking of Wheat. Ranchers, not so much, as livestock prices are flat, but softs (coffee, sugar, cocoa, cotton) are up a whopping 56%. Of course, the rest of us are consumers and have to buy this stuff. If we want to be very uncharitable, we should also point out that the skyrocketing cost of grains helped trigger unrest in a number of countries around the world. Bernanke will get no gifts from Mubarak!
Of course gold and industrial metals are up, around 20% each although you wouldn’t know it from how precious metals advocates have been whining. Crude is +27%; I’m sorry if you have to buy gasoline since retail prices at the pump are up 32%.
The dollar is worth 10% less on world markets. On the other hand, stocks are up 24%!
So if the Fed was trying to pump up stocks or nudge 2y note yields, they did a fine job. Beyond that, what we can see is…and what I’ve been saying all along…if you increase the quantity of money, the main thing you increase is the price level. The only reason you might expect a growth effect is if there is money illusion, meaning people see more money in their pockets and perceive themselves as wealthier because they don’t realize that the dollars are worth less. That is certainly somewhat true, but the figures above suggest that the most pronounced effects were on inflation expectations and the prices of raw commodities.
Well, we shouldn’t forget about this little effect as well: QE2 also kept Tim Geithner in his job for far longer than was good for the country. Obviously, Geithner knows that his job was made easier by the fact that the Fed was buying 85% of the Treasury issuance since November, and virtually 100% of the net TIPS issuance: he has apparently decided to “weigh” moving on from Treasury as soon as the budget deal is done. I’m sure the timing is completely coincidental and has nothing to do with the fact that the next guy is going to have to find a new $600bln buyer to take the Fed’s place (and maybe a bigger buyer, if the Fed ever decides to sell). “Not it!”
To be fair, Initial Claims did decline from 468k in August to 441k in November to 428k last week, and to be even more fair I should point out that monetary policy typically works with a lag. Not, apparently, on inflation expectations, but perhaps we should wait a while before judging the efficacy of turning on the money gusher.
.
In other news, Greece voted a second time to affirm the austerity measures, prompting much relief (again). It led to such comments as that by Belgian Finance Minister Didier Reynders, who said today “I expect we will be able to organize the payment of the next tranche of €12 billion.” Hang on, “expect”? Boy, if the EU doesn’t approve the payout after Greece’s politicians did everything asked of them…one hopes that the statement merely didn’t translate well.
Equities rallied, a semi-predictable result of quarter-end monkey business but I was delighted because implied volatilities dropped sharply as well. Out-of-the-money puts on stocks are much cheaper than they were just a few days ago, and I bought some late in the day.
Bonds dropped again, with 10y yields all the way up to 3.16%. Commodity indices declined, but a significant part of that decline was due to the shellacking that grains took today (on crop estimates that were revised sharply higher). Energy quotes were higher.
The Fed announced that it is suspending sales of the AIG and Maiden Lane securities after discovering – wait for it – that their unloading ten billion dollars’ worth of various sorts of bonds was actually pushing the credit market lower. Wow, really? You don’t say? Selling billions and billions will move a market? Who knew? Certainly not the people at the Fed, who declined an all-or-none bid from AIG back in March, and who continue to speak earnestly about how they will dump over a trillion dollars’ worth of Treasuries when it is time to do so, and no one the wiser. Seriously, can someone put a grown-up in charge over there?
The asset markets are, I suspect, about to get sloppy. I’m really not looking forward to the third quarter (except inasmuch as I own puts). This could begin as early as tomorrow, but I suspect it will take a few days. Still, if I’d bought a bunch of stocks for window-dressing on Thursday and faced a three-day weekend with the U.S. debt ceiling still not resolved (although Congress has canceled the holiday break to work on it. Gee, I feel lots better now) and Euro politicians still so busy back-slapping each other that anything might happen. The only major data out tomorrow is from the ISM (Consensus: 52.0 from 53.5), although auto sales will come out as well. It’s a holiday-shortened session in the bond market, and a three-day weekend.
That means I will not be writing a comment tomorrow, although I will be Tweeting if anything interesting happens. You can follow me @inflation_guy. Happy Independence Day, fellow Americans. Happy day-off-from-the-stinking-Americans, rest of the world!
Parallel Lines Do Not Intersect
The battle lines are being drawn in the Greek drama, and in increasingly-strident tones that will make retreat very difficult. This is one negotiating strategy: burn the bridges behind the army.
Here are some examples: the ECB’s Christian Noyer “ruled out” a restructuring. “There’s no solution possible” for Greece besides tightening its belt further in an austerity program. A default would make Greek sovereign bonds ineligible as collateral at the ECB, and according to Noyer they would become ineligible even if the country fails to meet the terms of the bailout. Since those terms appear to be impossible, this is a difficult situation.
It doesn’t help that the ECB is already understood – if not widely understood – to already be an “Enormous Bad Bank.” That’s the assessment of Der Spiegel, who says the ECB is “exposed to everything that could go wrong in Europe.” To some extent, a central bank is always exposed to bad things going wrong in its backyard, but Der Spiegel means exposed, as in “could need a bailout.”
Meanwhile, in the UK some MPs have begun vigorously protesting the use of any UK money in bailouts for the Eurozone. MP Mark Reckless (his real name) said “…it is unaffordable for this country to bail-out countries who joined a currency we chose not to when we ourselves are borrowing as much money, if not more, than those very countries we are bailing out…it is not our problem; it is not our currency.” It’s hard to argue with that! Reckless was speaking on the motion requiring the Government to oppose further use of the EFSM unless the UK is excluded.
The lines are being drawn in Germany, in Finland, in the UK, in Greece, in Ireland, and in Portugal and Spain. If the IMF gets further involved (as surely it will) then lines will be drawn by U.S. legislators. These lines are all parallel, in the sense that they are not set up as tradeoffs but as ultimatums. One side cannot gain except by making the other side cross its line. Parallel lines do not intersect, as we know from geometry. And where are we most likely to find parallel lines in the modern world? It is when we’re on a railroad heading inexorably towards our destination.
Nevertheless, Tuesday was a relatively sedate trading day. Equities consolidated yesterday’s move lower, which is actually a bad sign in that the lower levels were not rejected by the price action. Commodities bounced, thanks in part to Goldman’s declaration that it is turning “more bullish” on them. NYMEX Crude made a run at $100 but couldn’t break back above that (increasingly irrelevant) milestone. Bonds were mostly unchanged.
The economic data didn’t do much for the market. New Home Sales exceeded expectations at 323k, but this is both within the range of the last 6-8 months as well as below the lowest recorded rate in 2009. So it’s not exactly time to cue the fanfare.
On the good-news front, Goldman also put out a research piece noting that state tax collections continue to be strong, up 12% year/year among those states that have reported April numbers. Goldman notes that a significant portion of the rise is from prior-year tax settlements but takes an overall cheerful view of this data. But I think it’s important to realize that one of the main drivers of year-to-year changes in revenue is the level of the stock market (see Chart).

Federal tax receipts versus S&P index level, annual.
Higher equity prices result in more capital gains and more federal and state revenue. Given how much stocks have rallied (as well as bonds, commodities, and everything else) over the last couple of years, it would be really remarkable if revenues were not up quite considerably this year. The chart above is through 2010; a 12% gain looks about right.
What the bull giveth the bear may taketh away, however. If stocks go sideways, or heaven forbid lower, from here then tax receipts are going to stagnate. And our deficit projections do not incorporate ‘possible revenue stagnation’ as a potential outcome.
Note that I am not saying that revenues will fall if growth turns negative. I’m merely looking at the stock market, which is currently overvalued by many metrics. Federal revenues kept growing throughout recessions in the 1980s and the early 1990s, partly because nominal equity prices never experienced a major setback. It is also worth appreciating that this is a chart of nominal equity prices; although a rise in equity prices that merely accounts for a decline in the value of the currency isn’t a real gain to the investor it is still taxed. In the recessions of the early 1980s and early 1990s, inflation was high enough (and stock prices low enough) that there was a natural following wind to equity prices and therefore some support for ever-growing Federal revenues. We don’t live in that world any longer.
.
Wednesday’s data includes April Durable Goods Orders (Consensus: -2.5%, +0.5% ex-transportation), expected to retrench a little after March’s strength. The FHFA Home Price indices are out, and Minnesota Fed President Kocherlakota speaks on monetary policy around 1:30. The Fed speakers are also starting to draw their parallel lines, with some speakers advocating balance sheet unwinds while others demand increasing target rates first and still others think nothing needs to be done for a while. I have trouble reconciling this strong disagreement with Bernanke’s utter certainty that the Fed will have no trouble pulling back the liquidity without any side effects, when it is necessary. That can only mean that there are lots of good options, because otherwise someone is wrong and that would imply that certainty is harder to come by than he says it is. But I have trouble seeing that there are lots of good ways to unwind these unprecedented Fed actions. I guess that’s why I’m not a Fed official.
Soggy
I am sure it is just pure chance, but sometimes it seems as if the market action matches the weather. Today in New York it was cold and rainy, with the prospect of more of the same for a few days. And the stock market (-0.6%) and many commodities (Crude -2.3%; Industrial and Precious Metals and Livestock all lower, but Grains and Softs +1% or so) were drippy as well. TIPS dripped, with the 10y real yield up to 0.77%. Treasuries rallied 2-3bps, because bond traders are happiest when everyone else is miserable (right??).
Or, perhaps, it may not have been the weather after all.
The Empire Manufacturing Index fell to 11.88, the lowest level of 2011. This isn’t really an important number, except that it has been confounding expectations on the high side all year and so a downward surprise is unusual (except in the context that most other indicators have also been surprising in that direction lately).
The United States hit its debt ceiling, provoking more discussions about whether the U.S. will default, and what it would mean. I have stopped worrying about this and the implications for the U.S. credit rating. As Mark Steyn pointed out a couple of weeks ago (thanks DS for bringing this column to my attention):
…generally speaking, when you hit your “debt ceiling,” your credit is at risk. If you’ve got a $10,000 credit card, and you run it up to the limit, but you need a couple more grand right now, pronto, because you outspend your earnings by 50 percent every month and you have no plans to change that anytime soon, well, the bank might increase the limit to $15,000, or $20,000. Or they might not. There is a question mark over your credit because there is a question mark over your credit worthiness: It is at risk.
That seems to me to be a good point, as long as we distinguish between the credit rating and creditworthiness. The credit rating measures the probability that an entity will default, whether because it cannot pay or chooses not to. In neither case should there be any chance for any outcome other than a narrow technical default, since the federal government can always print currency to pay its debts…or to buy goods and services directly, without even raising debt in the first place (indeed, if we’re never going to pay it back, it would be less dishonest to just print-n-pay). The credit rating of the U.S., Japan, and probably all countries that can print their own currencies – that is, not European nations – should be very high and probably uniformly AAA.
But creditworthiness measures the borrower’s probability of actually making good on the debt. In the case of a sovereign that controls its own currency, “making good” surely ought to include the addendum that the debt is paid back in currency that has not depreciated dramatically in real terms (some mild depreciation is probably okay, since after all that is part of the interest rate that the sovereign is paying). And, given that the Federal Reserve is currently buying all of the Treasury’s new debt, there is at least a prima facie case to be made that we are not a very creditworthy borrower. As Steyn points out, it really shouldn’t be surprising that the creditworthiness of this nation is being questioned.
Now, in market terms how significant is this debate? Actually, I think what would happen if the U.S. stopped spending more money than it took in is that growth would take a near-term hit, which is why stocks and commodities would tend to drift lower, while the credit of the U.S. would improve marginally and Treasuries would become relatively more scarce. Presumably, the Treasury would take some of the maturing Treasury Bills and reissue longer debt to hearty demand, keeping the total amount of debt outstanding unchanged. And in what would be the most dangerous thing to both political parties, we would discover that life actually can go on without the government spending like a drunken sailor. But that’s just my guess, and I don’t expect that there will be a government shutdown of any meaningful duration so we won’t get to test it.
Markets are probably reacting less to the issues with U.S. debt than to the issues with Greek debt. Over the weekend, European leaders seemed to decide to use the word “re-profiling” to describe what may need to happen to Greek debt. This word means, as far as I can tell, to change the maturity profile and potentially the interest rate of the debt. The other word we have for that is “default,” but “re-profiling” sounds more like you’re sanding down a door to make it fit better. Ahhh…fits like a glove! Greek 10y is still around 15.5% and the 2y around 25%. A lower “profile” there sure would feel better, wouldn’t it?
But for all the news, equities fell (and did on Friday as well) but did not have a meaningful breakdown. The dollar rallied over those two days, but didn’t break through important resistance to launch higher. Crude oil declined today (and on Friday), but has so far averted a collapse. Bonds rallied to new low yields on the year (3.15%), but haven’t exactly lifted off yet. Markets are doing one of two things: we are either bracing for a crisis-ish sort of break (sharply lower equities, commodities, and TIPS, and a sharply higher dollar and Treasuries) or we’re getting bears, bears, bears, bulls, and bulls respectively overcommitted ahead of that break and instead markets are going to reverse hard if nothing bad happens in the near-term.
The introduction of new terminology (“re-profiling”) suggests that the singularity is near. But I suspect it is further than we think it is. I would be cautious about following breakouts in any of these markets in the absence of crisis-type news, but as traders we might get sucked into such positions because market moves often precede the public news. If that happens, then for goodness sake make healthy use of protective stops!
On Tuesday, the expectations are for another tepid Housing Starts figure (Consensus: 569k vs 549k last) and decent Industrial Production/Capacity Utilization figures (Consensus: +0.4% vs +0.8% last, 77.6% for CapU). But traders main attention will remain on the tape.
