Archive
Tight Spreads’ Cost: Orderly Markets
In this article I am taking a brief break from writing about inflation. There have been lots of great stories and anecdotes recently about inflation. I loved the Wall Street Journal article about how “Inflation and Other Woes Are Eating Your Girl Scout Cookies”, and we have seen several contributions from former Treasury Secretary Larry Summers that are worth reading. One was an opinion piece in the Washington Post (“Opinion: The stock market liked the Fed’s plan to raise interest rates. It’s wrong.”) and one was a very good NBER working paper on “The Coming Rise in Residential Inflation,” in which he confirms and extends the normal way inflation people forecast rents and comes up with even higher numbers than I’ve been working with for a while. Incidentally, if you haven’t seen these stories before now, consider installing the Inflation Guy mobile app. I don’t curate every single inflation story; just the ones worth curating.
Moreover, the Fed increasingly sounds like they want to be aggressive with rates. That’s half the battle, though on the more important half (the balance sheet reduction) they don’t yet have a plan. I should note that saying hawkish things on half the plan isn’t really all that hawkish, especially when your notion of “pushing rates above neutral” means 3%: a level well below inflation. But it’s progress that these folks have finally realized that inflation is a real phenomenon and not just due to port congestion. They still don’t seem to see the role of money growth in causing that phenomenon, but it’s nice we’re making baby steps.
As I said, though, in this article I’m going to talk about market structure, and the deal with the devil we have made to seek ever-tighter-spreads at a cost of orderly markets.
Since the 1970s, the cost of trading equities has moved from a bid/offer spread of a half point or a quarter point ($0.50 or $0.25 per share), on round lots, plus large brokerage fees, to sub-penny spreads on any size trade, often with zero brokerage costs. The cost of bond execution has similarly declined, as has the cost of futures and swaps brokerage. Volumes, across all markets, have responded to the decrease in costs. Some of this improvement in the median cost of trading has come from increased transparency, and a lot from increased competition.
Those improvements have not come without a cost, but at most times the cost is less apparent. The way the stock market used to be structured was around a number of market-making firms whose job it was to maintain orderly markets – including the distasteful task of being the buyer when everyone else is selling. What this means for the profit of a market-maker is that they generally made steady, small profits (a quarter of a point on every share, day in and day out) and occasionally lost huge amounts in market panics. It’s a classic “short gamma” position of picking up nickels before the bulldozer, and well-understood by the market-makers to be so. But that was the deal: you let the market-maker take his spread as an insurance premium, and collect on that premium when a calamity hits. Primary dealers in the government bond markets worked the same way: in exchange for the privilege of building an auction book (and being able to bid on the auction with that knowledge) and making spreads as a market-maker most of the time, it was understood that they were supposed to work to keep markets liquid in the bad times.
Then, we decided that we didn’t like paying all of these insurance premiums, which we called the “cost of trading” but could also be considered “the cost of providing continuous liquidity in bad times.” So stock prices were decimalized, which immediately started narrowing spreads. Electronic trading made the deal even worse because anyone could jump in front of the market-maker and be the bid or the offer, meaning that the market-maker wasn’t earning the spread. In many cases, there wasn’t any spread left to earn.
There is a parallel to something else I’ve written about recently, and that’s the trend over the years to lower and lower costs, and longer and longer supply chains, in manufacturing. Such a system is lower cost, but the price of that cost-savings is fragility. A long, international supply chain gets snarled much more easily and much worse than a short, domestic one. That cost/fragility tradeoff is the bargain that manufacturers made, although not thoughtfully.
Similarly, the price of the cost-savings from sub-penny equity spreads is fragility in the market-making system. It is difficult to find dealers who will accept the responsibilities of being the buyer or seller of last resort, and maintaining orderly markets, when that cost is not counterbalanced by an increase in profit opportunities during placid times.
As with international trade, we have begun to see the downside of this tradeoff when trading risks increase. Not that this is the first time, but it seems these days that liquidity conditions get sketchier more quickly now than they used to. Of course, we saw this as recently as March 2020, when trading in credit got so bad that the Fed had to step in and backstop corporate bond ETFs by buying corporate bonds and ETFs under the Secondary Market Corporate Credit Facility.[1] Recently, the Nickel market basically broke when prices went vertical and the resulting margin calls would have put some LME brokers out of business (conveniently, the LME decided to just cancel the trades that they didn’t like, which means those brokers are still in business but probably won’t have a market to broker). Prices went vertical partly because there are fewer highly-capitalized market-maker shops to stand in the middle and make orderly markets. Also recently, the European Federation of Energy Traders pleaded for “emergency funding mechanisms” so that they can continue to trade energy markets that have had greatly increased volatility recently.[2]
Now, the disturbing thing is that we are starting to see declines in liquidity even in fairly unremarkable periods. The last seven months’ worth of volatility in interest rate markets was higher than we’d seen in some years, but not exactly unprecedented. This month, 10-year Treasury yields are up 57bps. In 2002, 10-year yields fell 170 bps between May and October, in something close to a straight line driven by mortgage convexity. In about 6 weeks from May to June in 2003, yields dropped 81bps and then immediately reversed 129bps higher over the ensuing 6 weeks (same reason, different direction). I mention those two episodes because I was making markets in rates options and remember them not-very-fondly.
But these recent 57bps have been a lot more stressful on the market with fewer strong hands responsible for maintaining order. The chart below shows the BofA MOVE index, which measures normalized implied volatility on 1-month Treasury options. Recently, that index reached its second-highest level since the Global Financial Crisis. The highest prior level was in the March 2020 shutdown crash…understandable… and during the GFC banks were undercapitalized and in risk of failure. What’s the reason now?

We also see it in various market ecosystems. For example, there are roughly two dozen “Lead Market Makers” in the ETF ecosystem. In order to launch an ETF, you need to find someone to be the LMM. The function of the LMM is to make markets in virtually all conditions. But it is exquisitely hard to get an LMM signed up nowadays because the math for them works out badly. If your fund is very small, they make a decent spread but on tiny volume so it’s not very lucrative. As soon as your fund gets large, everyone else jumps in front of your markets, because they can and there’s money there to be made, so the LMM either makes no spread at all or makes a very small spread. Of course, those other Johnny-come-latelies will scatter the first time there is volatility, leaving the LMM there all alone to make orderly markets. So the market-making itself is a bad deal for the LMM in almost all circumstances. Their models are only tenable if they are able to make money on the relationship with the ETF issuer in other ways – being a broker for fund rebalancing, etc. This means that fewer good ETFs come to market than otherwise would. I have lamented this elsewhere. And the root cause and ultimate result are the same: we’ve engineered a very low-cost, high fragility system for investors to deal in.
The bottom line is that as any insurance agent can tell you people really hate paying for insurance. But no one expects insurance companies to provide insurance without being paid at least a fair premium. What would happen if we did? Well, then we wouldn’t have any insurance. Financially speaking right now, we don’t have much insurance because it’s too costly to stand in the middle. That looks like a win, until something catches on fire.
[1] For the Fed to buy corporate bonds was long held to be impermissible, since the Federal Reserve Act listed the assets the Fed was authorized to buy and that list did not include corporates and equities. Clearly, this was meant to follow Bagehot’s dictum that a central bank, to avert panic, “should lend early and freely, to solvent firms, against good collateral, and at ‘high rates’”, but thanks to clever lawyers who note that the Act does not explicitly prohibit the Fed from buying these things the Fed has in recent years decided that since it wants to, what could go wrong?
[2] A sad aside is that the movement to remove “pricey, greedy market-makers” and replace them with bailouts provided by central bank or treasury is the opposite of what Dodd-Frank was supposedly trying to do in ensuring that systemically-important institutions were adequately capitalized. They’re adequately capitalized now, but they don’t provide the market-braking function they used to because that’s ‘speculative activity’ that penalizes capital severely.
Last Time Was Different
They say that the four most dangerous words in investing/finance/economics are “This time it’s different.”
And so why worry, the thinking goes, about massive quantitative easing and profound fiscal stimulus? “After all, we did it during the Global Financial Crisis and it didn’t stoke inflation. Why would you think that it is different this time? You shouldn’t: it didn’t cause inflation last time, and it won’t this time. This time is not different.”
That line of thinking, at some level, is right. This time is not different. There is not, indeed, any reason to think we will not get the same effects from massive stimulus and monetary accommodation that we have gotten every other time similar things have happened in history. Well, almost every time. You see, it isn’t this time that is different. It is last time that was different.
In 2008-10, many observers thought that the Fed’s unlimited QE would surely stoke massive inflation. The explosion in the monetary base was taken by many (including many in the tinfoil hat brigade) as a reason that we would shortly become Zimbabwe. I wasn’t one of those, because there were some really unique circumstances about that crisis.[1]
The Global Financial Crisis (GFC hereafter) was, as the name suggests, a financial crisis. The crisis began, ended, and ran through the banks and shadow banking system which was overlevered and undercapitalized. The housing crisis, and the garden-variety recession it may have brought in normal times, was the precipitating factor…but the fall of Bear Stearns and Lehman, IndyMac, and WaMu, and the near-misses by AIG, Fannie Mae, Freddie Mac, Merrill, Goldman, Morgan Stanley, RBS (and I am missing many) were all tied to high leverage, low capital, and a fragile financial infrastructure. All of which has been exhaustively examined elsewhere and I won’t re-hash the events. But the reaction of Congress, the Administration, and especially the Federal Reserve were targeted largely to shoring up the banks and fixing the plumbing.
So the Federal Reserve took an unusual step early on and started paying Interest on Excess Reserves (IOER; it now is called simply Interest on Reserves or IOR in lots of places but I can’t break the IOER habit) as they undertook QE. That always seemed like an incredibly weird step to me if the purpose of QE was to get money into the economy: the Fed was paying banks to not lend, essentially. Notionally, what they were doing was shipping big boxes of money to banks and saying “we will pay you to not open these boxes.” Banks at the time were not only liquidity-constrained, they were capital-constrained, and so it made much more sense for them to take the riskless return from IOER rather than lending on the back of those reserves for modest incremental interest but a lot more risk. And so, M2 money supply never grew much faster than 10% y/y despite a massive increase in the Fed’s balance sheet. A 10% rate of money growth would have produced inflation, except for the precipitous fall in money velocity. As I’ve written a bunch of times (e.g. here, but if you just search for “velocity” or “real cash balances” on my blog you’ll get a wide sample), velocity is driven in the medium-term by interest rates, not by some ephemeral fear against which people hold precautionary money balances – which is why velocity plunged with interest rates during the GFC and remained low well after the GFC was over. The purpose of the QE in the Global Financial Crisis, that is, was banking-system focused rather than economy-focused. In effect, it forcibly de-levered the banks.
That was different. We hadn’t seen a general banking run in this country since the Great Depression, and while there weren’t generally lines of people waiting to take money out of their savings accounts, thanks to the promise of the FDIC, there were lines of companies looking to move deposits to safer banks or to hold Treasury Bills instead (Tbills traded to negative interest rates as a result). We had seen many recessions, some of them severe; we had seen market crashes and near-market crashes and failures of brokerage houses[2]; we even had the Savings and Loan crisis in the 1980s (and indeed, the post-mortem of that episode may have informed the Fed’s reaction to the GFC). But we never, at least since the Great Depression, had the world’s biggest banks teetering on total collapse.
I would argue then that last time was different. Of course every crisis is different in some way, and the massive GDP holiday being taken around the world right now is of course unprecedented in its rapidity if not its severity. It will likely be much more severe than the GFC but much shorter – kind of like a kick in the groin that makes you bend over but goes away in a few minutes.
But there is no banking crisis evident. Consequently the Fed’s massive balance sheet expansion, coupled with a relaxing of capital rules (e.g. see here, here and here), has immediately produced a huge spike in transactional money growth. M2 has grown at a 64% annualized rate over the last month, 25% annualized over the last 13 weeks, and 12.6% annualized over the last 52 weeks. As the chart shows, y/y money growth rates are already higher than they ever got during the GFC, larger than they got in the exceptional (but very short-term) liquidity provision after 9/11, and near the sorts of numbers we had in the early 1980s. And they’re just getting started.

Moreover, interest rates at the beginning of the GFC were higher (5y rates around 3%, depending when you look) and so there was plenty of room for rates, and hence money velocity, to decline. Right now we are already at all-time lows for M2 velocity and it is hard to imagine interest rates and velocity falling appreciably further (in the short-term there may be precautionary cash hoarding but this won’t last as long as the M2 will). And instead of incentivizing banks to cling to their reserves, the Fed is actively using moral suasion to push banks to make loans (e.g. see here and here), and the federal government is putting money directly in the hands of consumers and small businesses. Here’s the thing: the banking system is working as intended. That’s the part that’s not at all different this time. It’s what was different last time.
As I said, there are lots of things that are unique about this crisis. But the fundamental plumbing is working, and that’s why I think that the provision of extraordinary liquidity and massive fiscal spending (essentially, the back-door Modern Monetary Theory that we all laughed about when it was mooted in the last couple of years, because it was absurd) seems to be causing the sorts of effects, and likely will cause the sort of effect on medium-term inflation, that will not be different this time.
[1] I thought that the real test would be when interest rates normalized after the crisis…which they never did. You can read about that thesis in my book, “What’s Wrong with Money,” whose predictions are now mostly moot.
[2] I especially liked “The Go-Go Years” by John Brooks, about the hard end to the 1960s. There’s a wonderful recounting in that book about how Ross Perot stepped in to save a cascading failure among stock brokerage houses.
The Fed’s Reserves Management Problem
There has been a lot written about the Fed’s recent decision to start purchasing T-bills to re-expand its balance sheet, in order to release some of the upward pressure on short-term interest rates in the repo market. Some people have called this a resumption of Quantitative Easing, while others point out that it is merely an adjustment to a technical condition of reserves shortage. The problem is that both perspectives may be right, under different circumstances, and that is the underlying problem.
The triggering issue here was that overnight repo rates had been trading tight, and in fact briefly spiked to around 10%. It isn’t surprising that the Federal Reserve responded to this problem by adding lots of short-term liquidity: that’s how they respond to every issue. Banks in trouble? Add liquidity. Economy slightly weak? Add liquidity. “Stranger Things” episode somewhat disappointing? Add liquidity.
Traditionally, the Fed’s response would have been correct. In the “old days,” the overnight interest rate was how the Open Markets Desk gauged liquidity in the interbank market. If fed funds were trading above the Fed’s desired target (which was not always announced, but which could always be inferred by the Desk’s actions in response to reserves tightness or looseness), the Fed would come in to do “system” repos and add short-term liquidity. If fed funds were trading below the target, then “matched sales” was the prescription. It was fairly straightforward, because the demand for reserves was relatively easy to monitor and the adjustments to the supply of reserves small and regular.
But the problem today goes back to something I wrote about back in March, and that’s that reserves no longer serve just one function. In those aforementioned “old days,” the function of reserves was to support a bank’s lending activities in a straightforward statutory formula that was easy for a bank to calculate: this amount of lending required that amount of reserves, calculated over a two-week period ending on a Wednesday. Under that sort of regime, spikes in funds and repo rates (other than occasionally over the turn of year-end) were very rare and the Desk could easily manage them.
This is no longer the case. Reserves now serve two functions, as both lending support and as “High Quality Liquid Assets” (HQLA) that systemically-important banks can use in calculating its Liquidity Coverage Ratio (LCR). This has two really critical implications that we will only gradually learn the importance of. The first implication is that, because the amount of reserves needed to support lending activities is unlikely to be exactly the amount of reserves needed for a bank to achieve its HQLA, at any given time one of these two effects will dictate the amount of reserves the system needs. For example if banks need more reserves for HQLA reasons, then it means they will have more reserves than needed for their existing loan books – and that means economic stability and inflation control will in those cases take a back seat to bank stability. So, as the Fed has struggled to keep up with HQLA demand, year-over-year M2 growth (which is partly driven by reserves scarcity or plenty) has risen fairly quickly to 2-year highs (see chart, source Bloomberg).
The second implication is that, because the demand for each of these two functions of reserves changes independently in response to changes in interest rates and other market forces, it is not entirely knowable or forecastable by the Desk how many reserves are actually needed…and that number could change a lot. For example, there are other assets that also serve as HQLA; so if, for example, T-bill yields were a bit higher than the interest paid on reserves a bank might choose to hold more Tbills and only as much reserves as needed to support its lending activities. But if Tbill rates then fall, or customers lift those bills away from the bank’s balance sheet, or the denominator of the LCR (the riskiness of the bank’s activities, essentially) changes due to market conditions, the bank may suddenly choose to hold lots more reserves. And so rates might suddenly spike or plummet for reasons that have to do with the demand and supply of reserves for the HQLA function, with the Fed struggling to add or subtract large amounts of reserves over short periods of time.
In such a case, targeting a short-term interest rate as a policy variable is going to be exquisitely more difficult than it used to be, and honestly it isn’t clear to me that this is a solvable problem under the current framework. Either you need to declare that reserves don’t qualify as HQLA (which seems odd), or you need to require that a bank hold a certain amount as HQLA and set that number high enough that reserves are essentially the only HQLA a bank has (which seems punitive), or you need to accept that the central bank is either going to have to surrender control of the money supply (which is scary) or of short-term interest rates (which is also scary).
But simply growing the balance sheet? That’s the right answer today, but it might be the wrong answer tomorrow. It does, though, betray that the central bank has a knee-jerk response to err on the side of too much liquidity…and those of us who remember that inflation is actually a real thing see that as a reason for concern. (To be fair, central banks have been erring on the side of too much liquidity for quite some time. But maybe they’ll keep being lucky!)
What if ‘Excess Reserves’ Aren’t Really Excess?
One intriguing recent suggestion I have heard recently is that the “Excess” reserves that currently populate the balance sheet of the Federal Reserve aren’t really excess after all. Historically, the quantity of reserves was managed so that banks had enough to support lending to the degree which the Fed wanted: when economic activity was too slow, the Fed would add reserves and banks would use these reserves to make loans; when economic activity was too fast, the Fed would pull back on the growth of reserves and so rein in the growth of bank lending. Thus, at least in theory the Open Markets Desk at the New York Fed could manage economic activity by regulating the supply of reserves in the system. Any given bank, if it discovered it had more reserves than it needed, could lend those reserves in the interbank market to a bank that was short. But there was no significant quantity of “excess” reserves, because holding excess reserves cost money (they didn’t pay interest) – if the system as a whole had “too many” reserves, banks tended to lend more and use them up. So, when the Fed wanted to stuff lots of reserves into the system in the aftermath of the financial crisis, and especially wanted the banks to hold the excess rather than lending it, they had to pay banks to do so and so they began to pay interest on reserves. Voila! Excess reserves appeared.
But there is some speculation that things are different now because in 2011, the Basel Committee on Banking Supervision recommended (and the Federal Reserve implemented, with time to comply but fully implemented as of 2015) a rule that all “Systematically Important Financial Institutions” (mainly, really big banks) be required to maintain a Liquidity Coverage Ratio (LCR) at a certain level. The LCR is calculated by dividing a bank’s High Quality Liquid Assets (HQLA) by a number that represents its stress-tested 30-day net outflows. That is, the bank’s liquidity is expressed as a function of the riskiness of its business and the quantity of high-quality assets that it holds against these risks.
In calculating the HQLA, most assets the bank holds receive big discounts. For example, if a bank holds common equities, only half of the value of those equities can be considered in calculating this numerator. But a very few types of assets get full credit: Federal Reserve bank balances and Treasury securities chief among them.[1]
So, since big banks must maintain a certain LCR, and reserves are great HQLA assets, some observers have suggested that this means the Fed can’t really drain all of those excess reserves because they are, effectively, required. They’re not required because they need to be held against lending, but because they need to be held to satisfy the liquidity requirements.
If this is true, then against all my expectations the Fed has, effectively, done what I suggested in Chapter 10, “My Prescription” of What’s Wrong with Money? (Wiley, 2016). I quote an extended section from that book, since it turns out to be potentially spot-on with what might actually be happening (and, after all, it’s my book so I hereby give myself permission to quote a lengthy chunk):
“First, the Federal Reserve should change the reserve requirement for banks. If the mountain will not come to Mohammed, then Mohammed must go to the mountain. In this case, the Fed has the power (and the authority) to, at a stroke, redefine reserves so that all of the current “excess” reserves essentially become “required” reserves, by changing the amount of reserves banks are required to hold against loans. No longer would there be a risk of banks cracking open the “boxes of currency” in their vaults to extend more loans and create more money than is healthy for an economy that seeks noninflationary growth. There would be no chance of a reversion to the mean of the money multiplier, which would be devastating to the inflation picture. And the Open Markets Desk at the Fed would immediately regain power over short-term interest rates, because when they add or subtract reserves in open market operations, banks would care.
“To be sure, this would be awful news for the banks themselves and their stock prices would likely take a hit. It would amount to a forcible deleveraging, and impair potential profitability as a result. But we should recognize that such a deleveraging has already happened, and this policy would merely recognize de jure what has already happened de facto.
“Movements in reserve requirements have historically been very rare, and this is probably why such a solution is not being considered as far as I know. The reserve requirement is considered a “blunt instrument,” and you can imagine how a movement in the requirement could under normal circumstances lead to extreme volatility as the quantity of required reserves suddenly lurched from approximate balance into significant surplus or deficit. But that is not our current problem. Our current problem cries out for a blunt instrument!
“While the Fed is making this adjustment, and as it prepares to press money growth lower, they should work to keep medium-term interest rates low, not raise them, so that money velocity does not abruptly normalize. Interest rates should be normalized slowly, letting velocity rise gradually while money growth is pushed lower simultaneously. This would cause the yield curve to flatten substantially as tighter monetary conditions cause short-term interest rates in the United States to rise.
“Of course, in time the Fed should relinquish control of term rates altogether, and should also allow its balance sheet to shrink naturally. It is possible that, as this happens, reserve requirements could be edged incrementally back to normal as well. But those decisions are years away.”
If, in fact, the implementation of the LCR is serving as a second reserve requirement that is larger than the reserve requirement that is used to compute required and “excess” reserves, then the amount of excess reserves is less than we currently believe it to be. The Fed, in fact, has made some overtures to the market that they may not fully “normalize” the balance sheet specifically because the financial system needs it to continue to supply sufficient reserves. If, in fact, the LCR requirement uses all of the reserves currently considered “excess,” then the Fed is, despite my prior beliefs, actually operating at the margin and decisions to supply more or fewer reserves could directly affect the money supply after all, because the reserve requirement has in effect been raised.
This would be a huge development, and would help ameliorate the worst fears of those of us who wondered how QE could be left un-drained without eventually causing a move to a much higher price level. The problem is that we don’t really have a way to measure how close to the margin the Fed actually is; moreover, since Treasuries are a substitute for reserves in the LCR it isn’t clear that the margin the Fed wants to operate on is itself a bright line. It is more likely a fuzzy zone, which would complicate Fed policy considerably. It actually would make the Fed prone to mistakes in both directions, both over-easing and over-tightening, as opposed to the current situation where they are mostly just chasing inflation around (since when they raise interest rates, money velocity rises and that pushes inflation higher, but raising rates doesn’t also lower money growth since they’re not limiting bank activities by reining in reserves at the margin).
I think this explanation is at least partly correct, although we don’t think the condition is as binding as the more optimistic assessments would have it. The fact that M2 has recently begun to re-accelerate, despite the reduction in the Fed balance sheet, argues that we are not yet “at the margin” even if the margin is closer than we thought it was previously.
[1] The assumption in allowing Treasuries to be used at full value seems to be that in a crisis the value of those securities would go up, not down, so no haircut is required. Of course, that doesn’t always happen, especially if the crisis were to be caused, for example, by a failure of the government to pay interest on Treasuries due to a government shutdown. The more honest reason is that if the Fed were to haircut Treasuries, banks would hold drastically fewer Treasuries and this would be destabilizing – not to mention bad for business on Capitol Hill.
The Limits to Trusting the Robots
After another day on Thursday of stocks starting to look mildly tired – but only mildly – only to rally back to a new closing high, it hardly seems unusual any more. I have to keep pinching myself, reminding myself that this is historically abnormal. Actually, very abnormal. If the S&P 500 Total Return Index ends this month with a gain, it will be the second time in history that has happened. The other time was in 1936, as stocks bounced back from a deep bear market (at the end of those 12 months, in March 1936, stocks were still 54% off the 1929 highs). A rally this month would also mean that stocks have gained for 19 out of the last 20 months, the longest streak with just one miss since…1936 again.
But we aren’t rebounding from ‘oversold.’ This seems to be a different situation.
What is going on is confounding the wise and the foolish alike. Every dip is bought; the measures of market constancy (noted above, for example) are at all-time highs and the measures of market volatility such as the VIX are at all-time lows. It is de rigeur at this point to sneer “what could go wrong?” and you may assume I have indeed so sneered. But I also am curious about whether there is some kind of feedback loop at work that could cause this to go on far longer than it “should.”
To be sure, it shouldn’t. By many measures, equities are at or near all time measures of richness. The ones that are not at all-time highs are still in the top decile. Buying equities (or for that matter, bonds) at these levels ought to be a recipe for a capitalistic disaster. And yet, value guys are getting carried out left and right.
Does the elimination (with extreme prejudice) of value traders have any implications?
There has been lots of research about market composition: models, for example, that examine how “noise” and “signal” traders come together to create markets that exhibit the sorts of characteristics that normal markets do. Studies of what proportion of “speculators” you need, compared to “hedgers,” to make markets efficient or to cause them to have bubbles form.
So my question is, what if the combination of “buy the dip” micro-time-frame value guys, combine with the “risk parity” guys, represents a stable system?
Suppose equity volatility starts to rise. Then the risk-parity guys will start to sell equities, which will push prices lower and tend to push volatility higher. But then the short-term value guys step in to ‘buy the dip.’ To be clear, these are not traditional value investors, but rather more like the “speculators” in the hedger/speculator formulation of the market. These are people who buy something that has gone down, because it has gone down and is therefore cheaper, as opposed to the people who sell something that has gone down, because the fact that it has gone down means that it is more likely to go down further. In options-land, the folks buying the dip are pursuing a short-volatility strategy while the folks selling are pursuing a long-volatility strategy.[1]
Once the market has been stabilized by the buy-the-dip folks, who might be for example hedging a long options position (say, volatility arbitrage guys who are long actual options and short the VIX), then volatility starts to decline again, bringing the risk-parity guys back into equities and, along with the indexed long-only money that is seeking beta regardless of price, pushing the market higher. Whereupon the buy-the-dip guys get out with their scalped profit but leaving prices higher, and volatility lower, than it started (this last condition is necessary because otherwise it ends up being a zero-sum game. If prices keep going higher and implied volatility lower, it need not be zero-sum, which means both sides are being rewarded, which means that we would see more and more risk-parity guys – which we do – and more and more delta-hedging-buy-the-dip guys – which we do).
Obviously this sort of thing happens. My question though is, what if these different activities tend to offset in a convergent rather than divergent way, so that the system is stable? If this is what is happening then traditional value has no meaning, and equities can ascend arbitrary heights of valuation and implied volatility can decline arbitrarily low.
Options traders see this sort of stability in micro all the time. If there is lots of open interest in options around, say, the 110 strike on the bond contract, and the Street (or, more generally, the sophisticated and leveraged delta-hedgers) is long those options, then what tends to happen is that if the bond contract happens to be near 110 when expiry nears it will often oscillate around that strike in ever-declining swings. If I am long 110 straddles and the market rallies to 110-04, suddenly because of my gamma position I find myself long the market since my calls are in the money and my puts are not. If I sell my delta at 110-04, then I have locked in a small profit that helps to offset the large time decay that is going to make my options lose all of their remaining time value in a short while.[2] So, if the active traders are all long options at this strike, what happens is that when the bond goes to 110-04, all of the active folks sell to try and scalp their time decay, pushing the bond back down. When it goes to 99-28, they all buy. Then, the next time up, the bond gets to 110-03 and the folks who missed delta-hedging the last time say “okay, this time I will get this hedge off” and sell, so the oscillation is smaller. Sometimes it gets really hard to have any chance of covering time decay at all because this process results in the market stabilizing right at 110-00 right up until expiration. And that stabilization happens because of the traders hedging long-volatility positions in a low-volatility environment.
But for the options trader, that process has an end – options expiration. In the market process I am describing where risk-parity flows are being offset by buy-the-dip traders…is there an end, or can that process continue ad infinitum or at least, “much longer than you think it can?”
Spoiler alert: it already has continued much longer than I thought it could.
There is, however, a limit. These oscillations have to reach some de minimus level or it isn’t worth it to the buy-the-dip guys to buy the dip, and it isn’t worth reallocation of risk-parity strategies. This level is much lower now than it has been in the past, thanks to the spread of automated trading systems (i.e., robots) that make the delta-hedging process (or its analog in this system) so efficient that it requires less actual volatility to be profitable. But there is a limit. And the limit is reach two ways, in fact, because the minimum oscillation needed is a function of the capital to be deployed in the hedging process. I can hedge a 1-lot with a 2 penny oscillation in a stock. But I can’t get in and out of a million shares that way. So, as the amount of capital deployed in these strategies goes up, it actually raises the potential floor for volatility, below which these strategies aren’t profitable (at least in the long run). However, there could still be an equilibrium in which the capital deployed in these strategies, the volatility, and the market drift are all balanced, and that equilibrium could well be at still-lower volatility and still-higher market prices and still-larger allocations to risk-parity etc.
It seems like a good question to ask, the day after the 30th anniversary of the first time that the robots went crazy, “how does this stable system break down?” And, as a related question, “is the system self-stabilizing when perturbed, or does it de-stabilize?”
Some systems are self-stabilizing with small perturbations and destabilizing with larger perturbations. Think of a marble rolling around in a bowl. A small push up the side of the bowl will result in the marble eventually returning to the bottom of the bowl; a large push will result in the marble leaving the bowl entirely. I think we are in that sort of system. We have seen mild events, such as the shock of Brexit or Trump’s electoral victory, result in mild volatility that eventually dampened and left stocks at a higher level. I wonder if, as more money is employed in risk parity, the same size perturbation might eventually be divergent – as volatility rises, risk parity sells, and if the amount of dip-buyers is too small relative to the risk parity sellers, then the dip-buyers don’t stabilize the rout and eventually become sellers themselves.
If that’s the secret…if it’s the ratio of risk-parity money to dip-buyer money that matters in order to keep this a stable, symbiotic relationship, then there are two ways that the system can lose stability.
The first is that risk parity strategies can attract too much money. Risk parity is a liquidity-consumer, as they tend to be sellers when volatility is rising and buyers when volatility is falling. Moreover, they tend to be sellers of all assets when correlations are rising, and buyers of all assets when correlations are falling. And while total risk-parity fund flows are hard to track, there is little doubt that money is flowing to these strategies. For example one such fund, the Columbia Adaptive Risk Allocation Fund (CRAZX), has seen fairly dramatic increases in total assets over the last year or so (see chart, source Bloomberg. Hat tip to Peter Tchir whose Forbes article in May suggested this metric).

The second way that ratio can lose stability is that the money allocated to buy-the-dip strategies declines. This is even harder to track, but I suspect it is related to two things: the frequency and size of reasonable dips to buy, and the value of buying the dip (if you buy the dip, and the market keeps going down, then you probably don’t think you did well). Here are two charts, with the data sourced from Bloomberg (Enduring Intellectual Properties calculations).

 The former chart suggests that dip-buyers may be getting bored as there are fewer dips to buy (90% of the time over the last 180 days, the S&P 500 has been within 2% of its high). The latter chart suggests that the return to buying the dip has been low recently, but in general has been reasonably stable. This is essentially a measure of realized volatility. In principle, though, forward expectations about the range should be highly correlated to current implied volatility so the low level of the VIX implies that buying the dip shouldn’t give a large return to the upside. So in this last chart, I am trying to combine these two items into one index to give an overall view of the attractiveness of dip buying. This is the VIX, minus the 10th percentile of dips to buy.

I don’t know if this number by itself means a whole lot, but it does seem generally correct: the combination of fewer dips and lower volatility means dip-buying should become less popular.
But if dip-buying becomes less popular, and risk-parity implies more selling on dips…well, that is how you can get instability.
[1] This is not inconsistent with how risk parity is described in this excellent paper by Artemis Capital Management (h/t JN) – risk parity itself is a short volatility strategy; to hedge the delta of a risk parity strategy you sell when markets are going down and buy when markets are going up, replicating a synthetic long volatility position to offset.
[2] If this is making your eyes glaze over, skip ahead. It’s hard to explain this dynamic briefly unless I assume some level of options knowledge in the reader. But I know many of my readers don’t have that requisite knowledge. For those who do, I think this may resonate however so I’m plunging forward.
The Gravity of the Liquidity Situation
(**Administrative Note: Get your copy of my new book What’s Wrong with Money: The Biggest Bubble of All! Here is the Amazon link.)
In the long list of nightmares that market risk managers have to wrestle with on a daily basis, some have gradually receded. For competently-run banks and large trading institutions, the possibility of a rogue trader making undiscovered trades or mis-marking his own book – another Nick Leeson – is increasingly remote given the layers of oversight. But one nightmare in particular has been increasing in frequency since 2009, especially as Volcker Rule and Dodd-Frank restrictions have been implemented.
The concern is market illiquidity. Every year that goes by, liquidity in the financial markets is declining. This is not apparent to the casual observer, or casual investor, who faces a tight market for his hundred- or thousand-lot. But probably every institutional investor has a story of how his attempt to hit a bid on the screens resulted in his trading the minimum size while the rest of the bid fled with sub-millisecond dispatch. And so the question is: if your mutual fund is hit by redemptions at the same time that its market (equities, emerging markets, credit?) is falling apart – and that is the normal time that redemptions swell – then at what price will it be able to get out? And what if there is no bid at all that is big enough?
Banks and other dealing institutions have responded to both the new regulatory restrictions themselves, and to the effects of the restrictions, by decreasing the size of their balance sheet dedicated to trading. Much of the apparent ‘liquidity’ in the market now is provided by the algos (the algorithmic trading systems) who as we have seen can be there and gone in an eyeblink. I am not aware of anything that has been done in the wake of the various “flash crashes” we have seen that would lead me to have great confidence that in the next big market discontinuity markets will function any better than they did in 2008. In fact, public liquidity is quite a bit smaller and I would expect them to function a fair bit worse.
Yes, many institutions have begun to access “dark pools” where they face anonymous counterparties in crossing large trades, rather than chasing hair-trigger algos for a fraction of the size they need. But nothing is particularly soothing about the dark pools, either (starting with their name). The whole point of a market discontinuity is that flow traders end up all on the same side of the flow; in these times we want the speculative traders with big balance sheets to take the other side of trades at a price that reflects a reasonable return on their capital. Those spec traders, or at least the big-balance-sheet banks, aren’t providing extra liquidity in dark pools either.
Banks have also responded to the beat-down regularly administered by socialists like Bernie Sanders and by sympathetic ears in the press (and among the populist splinters of the right as well) – by cutting the experienced and expensive traders who have more experience in pricing scarce liquidity, and perhaps finding it sometimes. Again, none of this makes me optimistic about how we will handle the next “event.”
None of this rant is new, really. But what is interesting and new is that the illiquidity is starting to show up in very visual ways. Regular readers know that my primary area of domain expertise is in rates, and specifically in inflation. Consider the chart below (source: Enduring Investments), which I would consider strong evidence that market liquidity in inflation is worse now than it was two years ago. The chart shows 1-year inflation forward from various points on the inflation curve. That is, the point on the far left is 1 year inflation, 0 years forward (in other words, today’s 1-year inflation swap). The next point is 1 year inflation, 1 year forward. And so on, so that the last point is 1 year inflation, 29 years forward.

Ignore the level of inflation expectations generally – that isn’t my point here. Obviously, inflation expectations are lower and that is not news. But the curve from two years ago shows a nice, smooth, “classic rates derivatives” shape. Inflation is priced in the market as rising in smooth fashion. This doesn’t mean that anyone really expects that inflation will rise smoothly like that; only that such is the best single guess and, moreover, one that has nice characteristics in terms of derivatives pricing and transparency.
The blue curve shows the curve from last Thursday. Now, I could have chosen any curve in the last month or two and they would have been similarly choppy. You can see that the market is evidently pricing in that inflation will be 1.72% over the next year, and then decline, then rise, then decline, then rise irregularly until 9 years from now when it will abruptly peak and descend.
That’s a mess, and it is an indication that liquidity in the inflation swaps market is insufficient to pull the curves into a nice, smooth shape. This is analogous to one important characteristic of a planet, from an astrophysicist’s point of view: any body that is not sufficiently massive to pull itself into a sphere is not a planet, by definition. I would argue that the inability of the market to pull the inflation curve into a nice and smooth “derivatives” shape is an early warning sign that the “mass” of liquidity in this market – and in others – is getting worse in a visually-apparent way.
Zigs and Zags
“The market,” said J.P. Morgan, when asked for his opinion on what the market would do, “will fluctuate.”
Truer words were never spoken, but the depth of the truism as well is interesting. One implication of this observation – that prices will vary – is that the patient investor should mostly ignore noise in the markets. Ben Graham went further; he proposed thinking about a hypothetical “Mister Market,” who every day would offer to buy your stocks or sell you some more. On some days, Mister Market is fearful and offers to sell you stocks at a terrific discount; on other days, he is ebullient and offers to buy your holdings at far more than they are worth. Graham argued that this can only be a positive for an investor who knows the value of the business he holds. He can sell it if Mister Market is paying too much, or buy it if Mister Market is selling it too cheaply.
Graham did not give enough weight to momentum, as opposed to value – the idea that Mister Market might be paying too much today, but if you sell your holdings to him today, then you might miss the opportunity to sell them to him next year for double the stupid price. And, over the last couple of decades, momentum has become far more important to most investors than has value. (I blame CNBC, but that’s a different story).
In either case, the point is important – if you know what you own, and why you own it, and even better if you have an organized framework for thinking about the investment that is time-independent (that is, it doesn’t depend on how you feel today or tomorrow), then the zigs and zags don’t matter much to you in terms of your existing investments.
(As for future investments, young people should prefer declining asset markets, since they will be investing for long periods and should prefer lower prices to buy rather than higher prices; on the other hand, retirees should prefer rising asset prices, since they will be net sellers and should prefer higher prices to lower prices. In practice, everyone seems to like higher prices even though this is not rational in terms of one’s investing life.)
We have recently been experiencing a fair number of zigs, but mostly zags over the last couple of weeks. The stock market is near the last year’s lows – but, it should be noted, it still holds 84% of its gains since March 2009, so it is hardly disintegrating. The dividend yield of the S&P is 2.32%, the highest in some time and once again above 10-year Treasury yields. On the other hand, according to my calculations the expected 10-year return to equities is only about 1.25% more per annum than TIPS yields (0.65% plus inflation, for 10 years), so they are not cheap by any stretch of the imagination. The CAPE is still around 24, which about 50% higher than the historical average. But, in keeping with my point so far: none of these numbers has changed very much in the last couple of weeks. The stock market being down 10%, plus or minus, is a fairly small move from a value perspective (from a momentum perspective, though, it can and has tipped a number of measures).
But here is the more important overarching point to me, right now. I don’t worry about zigs and zags but what I do worry about is the fact that we are approaching the next bear market – whether it is this month, or this year, or next year, we will eventually have a bear market – with less liquidity then when we had the last bear market. Dealers and market-makers have been decimated by regulations and constraints on their deployment of capital, in the name of making them more secure and preventing a “systemic event” in the next calamity. All that means, to me, is that the systemic event will be more distributed. Each investor will face his own systemic event, when he finds the market for his shares is not where he wanted it to be, for the size he needed it to be. This is obviously less of a problem for individual investors. But mutual fund managers, pension fund managers – in short, the people with the big portfolios and the big positions – will have trouble changing their investment stances in a reasonable way (yet another reason to prefer smaller funds and managers, but increasing regulation has also made it very difficult to start and sustain a smaller investment management franchise). Another way to say this is that it is very likely that while the average or median market movement is likely to be similar to what it has been in the past, the tails are likely to be longer than in the past. That is, we may not go from a two-standard-deviation event to a four-standard-deviation event. We may go straight to a six-standard-deviation event.
If market “tails” are likely to be longer than in the past because of (il)liquidity, then the incentive for avoiding those tails is higher. This is true in two ways. First, it creates an incentive for an investor to move earlier, and lighten positions earlier, in a potential downward move in the market. And second, in the context of the Kelly Criterion (see my old article on this topic, here), rising volatility combined with decreased liquidity in general means that at every level of the market, investors should hold more cash than they otherwise would.
I don’t know how far the market will go down, and I don’t really care. I am prepared for “down.” What I care about is how fast.
Walmart Traffic may be Down but Wall Street Traffic is Up
Walmart (WMT) didn’t have its best day today. The bellwether retailer forecast a profit decline of 6-12% in its 2017 fiscal year, in some part because of a $1.5bln increase in wage expenses; the stock dropped 10% to its lowest level since 2012 and off about 33% from the highs (see chart, source Bloomberg).

I mention Walmart neither to recommend it nor to pan it, but only because in the absence of news from WMT I would have been inclined to ignore the modest downside surprise in Retail Sales today; September Retail Sales ex-auto-and-gasoline were unchanged versus expectations for a +0.3% rise. But Retail Sales, like Durable Goods, is a wildly volatile number (see chart, source Bloomberg).

This was a bad month, but it wasn’t the worst month in 2015. It wasn’t even the second or third-worst month in 2015. Looking at a monthly figure, it is difficult to reject any null hypothesis; put another way, you really cannot discern whether +0.5% is statistically different from +0.0%. [I didn’t actually do the test…I am just making the general statistical observation.] Today’s data will tweak the Q3 forecasts a bit lower, but isn’t anything to be upset about. Except, that is, for the fact that Walmart is bleeding.
There is something else that is different about this decline, and really about this whole year. I have documented in the past the steady decline in equity volumes that has been occurring for almost a decade now. The chart below shows the cumulative NYSE volume, by trading day of the year, for 2006 through present. Note the steady march lower in volumes year after year after year. 2014 and 2013 were almost mirror images, so you can’t see 2014. But notice the thicker black line: that is 2015.
 Here is another way to illustrate the same thing. By year, here is the number of days that less than 1 billion shares traded in NYSE Composite Volume.
| Number of sub-billion share days | |
| 2005 | 4 |
| 2006 | 7 |
| 2007 | 7 |
| 2008 | 18 |
| 2009 | 35 |
| 2010 | 113 |
| 2011 | 166 |
| 2012 | 240 |
| 2013 | 246 |
| 2014 | 246 |
In 2015, we are on pace for a mere 228 sub-billion share days.
I guess by now my point is plain, but here is one more chart and that is the rolling 20-day composite volume for 2014 (lower line) and 2015 (upper line).

In general, volumes have been higher this year, but the real divergence began at the end of July, when the lines began to move away from each other more rapidly. The equity breakdown started on August 20th.
What does this all mean? Rising trading volumes while markets are declining suggests we should consider imputing more significance to what many are calling a correction but which may be the beginning of something deeper. There are re-allocations happening, and outright sales – not just fast money slinging positions around. Technically, this is supposed to put more weight on the “damage” done by this correction, and raise a bit of a warning flag about the medium-term set-up.
Incidentally, you can buy warning flags cheaply at Walmart.
Possibly a Tactical Chance for Bonds
This week, I am participating in a school-style debate at the Global Fixed Income Institute’s conferences in Madrid where the question before the house is whether or not inflation will resurface in major world economies in the next five years. As you might imagine, I feel that my part of the debate is the easy part, especially as inflation is pointing higher in the US and core inflation just surprised higher in Europe. However, I am sure the other side feels the same way.
The Institute is interested in this discussion partly to illuminate the question of whether the substantial rise in yields over the last three months or so in all developed bond markets (see chart, source Bloomberg, showing 10y yields in US, UK, Germany and Japan) is indicative of a return of fears of inflation.

The ironic part of this is that I do not believe that the rise in yields has much if anything to do with the expectation for higher inflation. Partly, it is due to a subtle sea change in the way investors are thinking about the prospects for central bank policy – to wit, the possibility (which I see as slim) that the Fed chooses to raise rates meaningfully above zero in the next year, starting in September. But to some degree, the market has been discounting higher forward rates for a very long time. It has been consistently wrong on that point, but the steeply sloped yield curve (the 2y/10y spread hasn’t been flatter than 120bps since early 2008 – see chart, source Bloomberg) implies higher forward rates.

The rise in yields, in my view, is partly related to the prospect for changes in central bank policy, but also partly (and more sinisterly) related to the continuing intentional destruction by policymakers of the ability of large banks and dealers to make markets. We see worse liquidity in more and more markets almost by the day (as predicted five years ago in this space, for example here and here, as well as by many other observers). Less liquid markets tend to trade with more volatility, as it gets harder to move institutional size, and at lower prices since holders of assets need to factor in the difficulty of selling a position. Higher yields are going to happen in any event, and when institutional holders of bonds decide to diversify into commodities or into other real assets, interest rates could rise quickly depending how quickly that meme spreads. Of course, the same is true of equities, and commodities. Asset-allocation shifts will get messier.
I actually think this isn’t a bad time tactically to enter long positions in fixed-income. The Fed isn’t going to be as aggressive as people expect; also, bonds will get some support from investors fleeing fading momentum in stocks. The chart below (source: Bloomberg; Enduring Investments calculations) shows the 52-week price change in stocks. This is one measure of momentum, and a very important one as lots of investors look at their returns in annual chunks. Incredibly, since the latter part of 2012 investors have always been able to see double-digit returns from stocks when they looked in the rear-view mirror. Today, that number is 7.5%.

That’s still a terrific real return of more than 5%, but (a) many investors have very screwy return expectations, (b) many investors are well aware that they’ve been living on borrowed time with a liquidity-inspired rally, and (c) certain quantitative investors place significant weight to momentum, over value, in their investment models.
It’s just another red flag for stocks, but it has become passé to point them out. From the standpoint of a bond investor, though, this is good news because all of those equity owners, when they decide to take their chips off the table, will become bond buyers.
And when that happens, the liquidity issues in fixed-income might cut the other way for a while.
Just One Thing
The defining characteristics of the markets these days seem to include:
- Central bank liquidity matters; central government mistakes do not.
- Central bank liquidity matters; economic growth numbers do not.
- Central bank liquidity matters; market illiquidity does not.
- Central bank liquidity matters; and so does the dollar (but that’s just a manifestation of the fact that central bank liquidity matters).
You may notice some commonality about the four defining characteristics as I have enumerated them above. I will add that this commonality – that seemingly only central bank liquidity operations matter these days – is also the reason that I haven’t been writing as much these last days, weeks, and months. As someone who has watched the Fed for a long time, I might have a decent guess as to when the Fed might change course…but probably no better than many other watchers. (Moreover, as I have said before, whether the Fed actually hikes rates or not probably doesn’t matter either as long as there is adequate liquidity, which is a question independent at the moment from rates. Refer again to the four characteristics.)
Let us take these one at a time.
Central bank mistakes don’t matter as much as the question of whether central banks are adding enough liquidity. Exhibit A is the fact that 10-year yields are negative in Switzerland, under 1% in France, Germany, Sweden, and the Netherlands, and under 1.60% in (get this) Italy, Spain, and Portugal. This is despite the fact that Greece is likely to leave the Euro either sooner or later, provoking existential questions about whether Italy, Spain, Portugal, and maybe France can also remain in the Eurozone. We can debate whether “likely to leave the Euro” means 20% chance or 80% chance, but if the chance is not negligible – and it certainly looks to be something more than negligible – then it is incredible that the Italian, Portuguese, and Spanish yields are all so low. Yes, it’s largely because of the ECB. Quod erat demonstrandum.
Economic growth numbers do not matter as much as central bank profligacy. The Citigroup Economic Surprise index for the US just fell below -50 for the first time since 2012 (see chart, source Bloomberg).

Now, weaker-than-expected data spelled bad news for stocks in 2008, 2010, and 2011, but not since then. I wonder why? Right: central bank liquidity trumps. Quod erat demonstrandum.
Recently, I have read a fair amount about increasingly-frequent bouts of illiquidity in various markets. The US TIPS market has comfortably more than a trillion dollars’ worth of outstanding issues, but has been whipsawed unmercifully over the last week and a half (after, it should be said, a hellacious rebound from the outrageous selloff in H2 of last year – see chart of 10-year breakevens, source Bloomberg). But that market is not alone by any stretch of the imagination. Energy markets, individual stock names and the stock market generally, and the list goes on.

It isn’t that there has been dramatic volatility – volatility happens. It’s that the effective bid/offer spreads have been widening and the amount of securities that can be moved on the bid and offer has been declining (to say it another way, the real market for size has been widening, or the cost of liquidity has been rising). This in itself is not surprising: some pundits, myself included, predicted five years ago that instituting the Volcker Rule, and other elements of Dodd-Frank that tended to decrease the risk budgets of market liquidity-makers, would diminish market liquidity. (See here, here, and here for some examples of my own statements on the matter). But the other prediction, that markets would fall as a result of the diminished market liquidity – less-liquid stocks for example routinely trade at lower P/E ratios all else being equal – has proven incorrect. Why? I would suggest the central bank’s provision of extraordinary monetary liquidity has helped keep markets elevated despite thinning liquidity. Quod erat demonstrandum.
So what is there to write about? Well, I could talk about the dollar, which at +25% from last June is starting to be in the realm of interesting. But this too is just another manifestation of central bank shenanigans – specifically, the notion that every central bank is being easier than our Federal Reserve. So it comes back to the same thing.
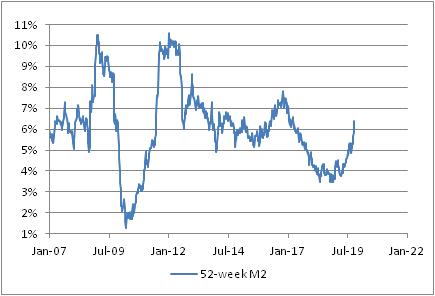
So all roads lead to the question of central bank liquidity provision. This primal single-note drum-beat is, if nothing else, exquisitely boring. But boring isn’t as annoying as the fact that it’s also wrong. The Fed isn’t being any more hawkish this year than it was last year. The growth in the money supply – which is the only metric of significance in the WYSIWYG world of monetary policy – is pretty much at the same level it has been for three years: about 6.0%-6.5% growth year/year (see chart, source Enduring Investments). That’s also exactly where UK M2 growth has been. Japanese money growth, while a lot healthier at 3.5% than it was at 2%, is still not doing anything dramatic despite all of the talk of BOJ money printing (color me surprised, by the way).

About the only interesting move in money growth has been in the EZ, which is where observers have been the most skeptical. One year ago, M2 growth in the Eurozone was 2.5%; as of January 2015, it was 5.6%.
The weakness in the Euro, in short, makes sense. The supply of Euros is increasing relative to the former growth trajectories, compared to USD, GBP, and JPY. Increase the relative supply; decrease the price. But the dollar’s strength against the rest of the world does not make so much sense. The supply of dollars is still rising at 6.5% per year, and moreover nothing that the Fed is proposing to do with rates is likely to affect the rate of increase in the supply of dollars.
At the end of the day, then, characteristic #4 I listed at the beginning of this article is wrong. It’s the perception of central bank liquidity, and not the liquidity itself, that matters to currencies. And that’s why I think the dollar’s run is going to come to an abrupt end, unless M2 growth inexplicably slows. How soon that run will end I have no idea, but it seems out of bounds to me. At least, if actual central bank liquidity is what matters…and for everything else in the securities markets, it seems to.