Archive
Why a 4.5% Nominal Rate is Roughly Equilibrium…Hmmm, Sounds Familiar…
I was planning to write today about why a 4.5%-5.0% nominal Treasury rate is not only not the end of the world, but actually sort of normal. Naturally, the reason I am even thinking about the topic is because of all of the apparent alarm because the current long bond recent peeked above 5% and the 10-year note at 4.50% continues to flirt with those levels. Because we haven’t seen the 10-year rate above 5% for a sustained period in about 18 years, it is natural that some of the young folks who were raised in an era of free money would think that this is the end of the world.
I’ve previously written about the return of some of the phenomena that we used to take for granted, such as the presence of optionality in the bond contract. After most of two decades of unhealthy interest rates produced unhealthy leverage habits among other unwelcome developments (including the leveraging of the government balance sheet because it was so cheap to borrow for one’s programs with no cost), I suppose it shouldn’t be surprising that there is so much wailing and gnashing of teeth, rending of garments, etc. But for those people who expect the Fed to lower rates significantly, because “after all 2% is the normal level of interest rates,” I am here to say that you probably don’t want the crack-up that would be necessary to make that plausible. The current level of interest rates is inconvenient for many organizations with a borrowing problem, but it is really quite normal.
Anyway, I’d intended to write a longer version of that, and as I started to write something bugged me and I looked back and noticed that I’d already written essentially the same thing a few years ago. At the time (June 2022) I was explaining “Why Roughly 2.25% is an Equilibrium Real Rate,” and of course if you add reasonable inflation expectations of 2.5%-3% you get to 4.75%-5.25% as an equilibrium nominal rate (and a bit higher than that for the 30-year, which also incorporates a modest additional risk premium). If you go and read that article directly, you can also get my screed on how models trained on the last 25 years of data leading up to the inflation spike only survived if they forecast a very strong reversion to the mean, and so *eureka* all of those models missed the entire inflation spike. But here is a reprinted snippet (reprinted by permission from myself) outlining the argument for why the current level of long-term real interest rates is about right.
Kashkari made a different error, in an essay posted on the Minneapolis Fed website on May 6th.[1] He claimed that the neutral long-term real interest rate is around 0.25%, which conveniently is where long-term real rates are now.
However, we can demonstrate that logic, reinforced by history, indicates that long-term real rates ought to be in the neighborhood of the economy’s long-term real growth rate potential.
I will use the classic economist’s expedient of a desert-island economy. Consider such an island, which has two coconut-milk producers and for mathematical convenience no inflation, so that real and nominal quantities are the same. These producers are able to expand production and profits by about 2% per year by deploying new machinery to extract the milk from the coconuts. Now, let’s suppose that one of the producers offers to sell his company to the other, and to finance the purchase by lending money at 5%. The proposal will fall on deaf ears, since paying 5% to expand production and profits by 2% makes no sense. At that interest rate, either producer would rather be a banker. Conversely, suppose one producer offers to sell his company to the other and to finance the purchase at a 0% rate of interest – the buyer can pay off the loan over time with no interest charged. Now the buyer will jump at the chance, because he can pay off the loan with the increased production and keep more money in the bargain. The leverage granted him by this loan is very attractive. In this circumstance, the only way the deal is struck is if the lender is not good at math. Clearly, the lender could increase his wealth by 2% per year by producing coconut milk, but is choosing instead to maintain his current level of wealth. Perhaps he likes playing golf more than cracking coconuts.
In this economy, a lender cannot charge more than the natural growth in production since a borrower will not intentionally reduce his real wealth by borrowing to buy an asset that returns less than the loan costs. And a lender will not intentionally reduce his real wealth by lending at a rate lower than he could expand his wealth by producing. Thus, the natural real rate of interest will tend to be in equilibrium at the natural real rate of economic growth. Lower real interest rates will induce leveraging of productive activities; higher real interest rates will result in deleveraging.
This isn’t only true of the coconut economy, although I would strongly caution that this isn’t exactly a trading model and only a natural tendency with a long history. The chart below shows (1) a naïve real 10-year yield created by taking the 10-year nominal Treasury yield and subtracting trailing 1-year inflation, in purple; (2) a real yield series derived from a research paper by Shanken & Kothari, in red; (3) the Enduring Investments real yield series, in green, and (4) 10y TIPS, in black.

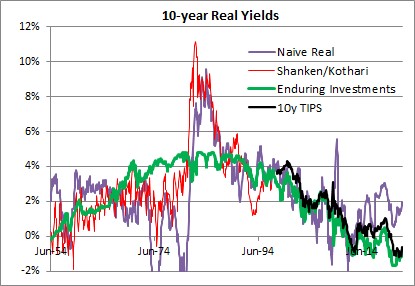
The long-term averages for these four series are as follows:
- Naïve real: 2.34%
- Shanken/Kothari: 3.13%
- Enduring Investments: 2.34%
- 10y TIPS: 1.39%
- Shanken/Kothari thru 2007; 10y TIPS from 2007-present: 2.50%
It isn’t just a coincidence that calculating a long-term average of long-term real interest rates, no matter how you do it, ends up being about 2.3%-2.5%. That is also close to the long-term real growth rate of the economy. Using Commerce Department data, the compounded annual US growth rate from 1954-2021 was 2.95%.
It is generally conceded that the economy’s sustainable growth rate has fallen over the last 50 years, although some people place great stock (no pun intended) on the productivity enhancements which power the fantasies of tech sector investors. I believe that something like 2.25%-2.50% is the long-term growth rate that the US economy can sustain, although global demographic trends may be dampening that further. Which in turn implies that something like 2.00%-2.25% is where long-term real interest rates should be, in equilibrium.[2] Kashkari says “We do know that neutral rates have been falling in advanced economies around the world due to factors outside the influence of monetary policy, such as demographics, technology developments and trade.” Except that we don’t know anything of the sort, since there is a strong argument against each of these totems. Abbreviating, those counterarguments are (a) aging demographics is a supply shock which should decrease output and raise prices with the singular counterargument of Japan also happening to be the country with the lowest growth rate in money in the last three decades; (b) productivity has been improving since the Middle Ages, and there is no evidence that it is improving noticeably faster today – and if it did, that would raise the expected real growth rate and the demand for money; and (c) while trade certainly was a following wind for the last quarter century, every indication is that it is going to be the opposite sign for the next decade. It is time to retire these shibboleths. Real interest rates have been kept artificially too low for far too long, inducing excessive financial leverage. They will eventually return to equilibrium…but it will be a long and painful process.
At the time I wrote the passage above, 10-year TIPS yielded about 0.25%; today they yield 2.125%. It turned out that returning to equilibrium wasn’t at all a long process. But it certainly was painful!
Returning to the original point: just because 10-year rates are now approximately at equilibrium is not at all a prediction that they will remain at equilibrium. Indeed, if I made that prediction I would be making a very similar mistake to the one I criticized above. Mean reversion in rates is not a particularly powerful force, when set against an active central bank and a profligate legislature. But if it matters at all, it is very important to correctly identify the mean to which rates should revert.
And it’s not 2%.
[1] https://www.minneapolisfed.org/article/2022/policy-has-tightened-a-lot-is-it-enough
[2] The reason that real interest rates will be slightly lower than real growth rates is that real interest rates are typically computed using the Consumer Price Index, which is generally slightly higher than the GDP Deflator.
Inflation Guy’s CPI Summary (April 2025)
Before the CPI analysis, I always try to give some context for where we are in the ‘story’ about the evolution of inflation right now. It’s really difficult to do that, though, because of all of the massive policy changes that are happening – and often in opposite directions with respect to the effect on inflation. Here is the Baker, Bloom & Davis Economic Policy Uncertainty Index, which is derived by scraping news sources. Even strong supporters of President Trump’s have to admit that his Administration has been a whirlwind on economic policy (for many of them, of course, that’s a feature and not a bug).

Here goes, anyway. Remember that last month, core CPI crashed but Median CPI actually accelerated. This kept us from actively celebrating the great inflation news; we knew that the good news was concentrated in a few one offs. In particular, Airfares (-5.3% for March), Lodging Away from Home (-3.5%), Used Cars (-0.69%), Car and Truck Rental (-2.66%), and Medicinal Drugs (-1.30%). But, as Median showed last month, there was really no reason to think that inflation was behind us…even before any effect from tariffs.
Speaking of tariffs, prior to this month we hadn’t really expected to see any effect yet and most economists thought that we shouldn’t see that much impact in the April figures either since the big tariffs on everyone went into place early in that month. However, remember that Mexico, Canada, and China had all faced escalating tariffs prior to April, so if there is going to be an impact we should expect to see something soon. I don’t expect a lot in most categories, but some impact in a few. It will be hard to discern how much of any monthly price change is tariffs, of course. We will look at Apparel, where demand elasticity in the short run is not terribly low. Broadly, though, remember that demand elasticity and foreign content percentage are both important…and foreign content in most goods is pretty low. I’d also look to Medicinal Drugs, since a lot of APIs are China-sourced and the demand for many drugs is pretty inelastic in the short-run, but I didn’t expect a lot of impact there (pharma companies will have had inventories), and going forward it will be muddied by Trump’s announcement of the Most-Favored-Nation policy in pharmaceuticals.
Speaking of that announcement, this month’s review of changes in inflation swap levels is seriously polluted because that announcement combined with the 90-day pause on China tariffs caused a massive crash in 1-year inflation expectations.

Despite the drop in tariff rates on China (for now), remember average tariffs remain the highest since the Great Depression (ominous music)! Of course, back then the US was a significant net exporter, so reciprocal tariffs were a bigger problem. Imports were only about 2-3% of GDP.

(Chart above is from https://www.stlouisfed.org/on-the-economy/2019/may/historical-u-s-trade-deficits)

(Chart above is from https://www.stlouisfed.org/on-the-economy/2020/march/evolution-total-trade-us)
There you go. That’s the context. Now onto the number.
CPI for April was expected to be +0.25%, and +0.27% on Core. The actual prints were 0.221% and 0.237%, respectively, so a mild surprise lower (although it turned the +0.3%/+0.3% rounded expectations to +0.2%/+0.2%, looking more dramatic a surprise than it actually was). Core is right about where it has been for the last 6 and 12 months (0.244% and 0.229% average, respectively) with the big January spike and the March plunge basically offsetting each other.

Amazingly, of the eight major subgroups only Housing, Medical Care, and “Other” increased on a m/m basis. What is especially surprising in that light is that Apparel – where the tariff canary in the coal mine lives – was down on the month.

Core goods continues to hook higher, now at +0.13% y/y. Remember, this is before any tariff effect has really been felt. In my mind, this is more the underlying ‘deglobalization’ effect: as I’ve said for a while, the deep deflation in core goods that we saw was a partial retracement of the COVID spike and we should expect going forward to see a small positive inflation in goods. Core services is decelerating nicely, and it will need to continue to do that if we’re ever going to see downward pressure in median inflation from where we are now.

Speaking of Median CPI, my early estimate is +0.308% m/m, putting the y/y at 3.43%. That’s about where we’ve been, and where we’re likely to be going forward.

Looking at some of those one-off categories from last month, Airfares fell another -2.83% m/m after that -5.3% prior decline. Some of that is jet fuel, some is tourism I suspect. Lodging Away from Home went flat (-0.1% m/m) from -3.54% prior. I think we’ll see continued downward pressure in that category, as hotels in some big cities are gradually emptied of illegal migrants and get added back to the stock of available rooms, but March’s drop was just too big. Used Cars’ decline (-0.53%) surprised some people, because the private surveys showed that prices advanced last month, but the seasonal assumption was a decent hurdle this month that wasn’t cleared. However, if you were worried about how the spike in car parts tariffs would cause car prices to spike…because that’s what the news was hyperventilating about…you needn’t have. New Car prices were also slightly down, -0.01% compared to +0.1% last month.
As for shelter, it continues to flatten out, with Primary Rents 3.98% y/y and OER at 4.31% y/y. Actually, Primary Rents were flat on a y/y basis compared to the prior month, and have basically converged with our model, which is around 3.7%. From here we should expect very slow deceleration, but rents should stay above 3.25% or so on a y/y basis.

Supercore is looking great. This is about the best news in the report, because if Shelter is just about tapped out and Core Goods is trending just above zero we’d need Core Services to continue to dive.

That’s the good news. The bad news is that the spread of median wages over median prices has returned to its long-run average, which means that it will be hard to see additional sharp declines here…it isn’t going to come from squeezing wages further.

Outright, the Atlanta Fed Wage Growth Tracker – the best measure of wages in my opinion – is at 4.3% y/y. That’s right where it was in November. It’s going to be very hard to squeeze services prices lower if wages don’t decelerate further.
Finally, let’s circle back to pharmaceuticals. I’m going to point you again to my article from 2020, which is the first time that the President mooted the idea of a Most-Favored-Nation clause affecting the pharmaceutical industry. https://inflationguy.blog/2020/08/25/drug-prices-and-most-favored-nation-clauses-considerations/ The upshot is that even if the MFN policy takes place exactly as the President states, retail drug prices are unlikely to decrease anything like as much as he has said. In fact, there could even be some circumstances in which drug prices rise because companies stop selling in foreign countries at levels lower than in the US (because they face a more-elastic demand there) but which contribute to the total profit of the drug company. There may be others in which the drug company stops selling the drug at all in the US. Furthermore, drug prices overall have only risen 7% since pre-COVID, compared to 23% for core prices generally (the black line in the chart below is the overall CPI for Medicinal Drugs; the blue is the core CPI price level – both normalized to December 2019).

By the way, if I was concerned about importing APIs from China and wanted the US to start producing more of them, I don’t think I’d be trying to crush end-product prices and reduce the incentive to spin up production of the APIs. So there will be a lot of exceptions to the MFN policy, and you can tell from the performance of pharma companies yesterday after the news (big up with the market, not down!) that investors don’t expect any important impact on the bottom lines of pharmaceutical companies. I agree. I think Medicinal Drugs going forward will probably decline a bit for some celebrated cases, but not in a big way that pushes CPI lower significantly.
The big conclusion here is that inflation continues to run at about 3.5% or so (Median), and there is no sign of a significant further deceleration to come. As long-time readers know, this has been my theme for a couple of years, that we will end up in the ‘high 3s, low 4s’ on median inflation, because the overall backdrop of deglobalization and demographics argue for a higher floor. If the Fed keeps money growth very low, my opinion could change (and I’d already amend my target to ‘mid to high 3s’ as the mode), but I am not very optimistic on that.
However, I also don’t think there is anything about the inflation picture that argues the Fed has a lot of room to drop rates significantly. I said last month “The right answer to uncertainty from a policymaker perspective is to increase the hurdle for taking action. The right answer is to make no changes to policy. I am not confident that the Federal Reserve will correctly separate the ‘price of risk’ effect from the ‘economic growth’ effect. They are correct to note that tariffs by themselves are not inflationary in that they are one-off effects. If they believe that, and they think there’s a big recession coming, they’ll cut rates. That would be a mistake, especially given the uncertainty.” I still think that’s the case. At the moment, there is no reason to cut rates any further than the ‘let’s help Biden’ cuts did, except to appease the President and I see little urgency from this Fed to do that. I wouldn’t expect any big moves from the Committee, any time soon.
One final announcement. If you’re an investor in cryptocurrencies (in particular, stable coins) and have a Telegram account, consider joining the read-only USDi_Coin room https://t.me/USDi_Coin where the USDi Coin price is updated every four hours or so…and where these charts are also posted shortly after CPI just as I used to do on Twitter before they changed the API to make auto-tweeting charts very difficult.
Inflation After 100 Days
It is hard to believe that a third of the year is already past. Some people, of course, would say that it seems like a hundred years have passed in the first hundred days of Trump’s second term, but to me it seems like a blink.
Here’s a quick mark-to-market summary of where I think we stand with respect to inflation and the economy generally…after which I actually have another point for this column:
Uncertainty. That’s the watchword, of course. One place this shows up is in the huge spread between survey data and hard data. The survey data is tinted with fear of uncertainty, and is very negative (and likely influenced by the media deciding that Trump’s Administration signals the End of Days); the hard data is clearly softening but not dramatically so – and frankly, that was already under way in some ways since at least 2023 when the Unemployment Rate started heading slowly higher. In my view the softening of the hard data won’t ever get to be dramatic in this recession, and this will end up being more like a garden-variety recession we used to have pre-2000.
Inflation will be higher than it would otherwise be, because of tariffs, but lower than many people think because people greatly exaggerate the effect of tariffs. Tariffs only affect goods, and only significantly if they are goods facing inelastic demand. There will be some shortages in the near-term, and unlike during COVID when many of the shortages were caused by too much demand induced by money-drops to consumers, in this case it really will be supply constraints. Look out for things like ibuprofen, which is 90% sourced from China which makes it hard to completely switch supply to domestic suppliers. But these are short-run or in some case medium-run disruptions as supply chains shift. As domestic or lesser-tariffed countries replace the highly-tariffed suppliers, the supplies will respond and prices will come back down – not all the way to where they were, but it will feel like deflation in some cases because we mentally refer to the most-recent price, not to the year-ago price.
But either way, the tariffs are a jump-discontinuity, a one-time effect. The uncertainty, less so but that will fade (as an aside, and as I’ve noted previously, the high uncertainty had the effect in Q1 of causing money velocity to decline very slightly for the first time in a couple of years). By the end of the year, things will be much more settled and inflation will be stabilizing again…but the story continues to be that inflation will stabilize in the high 3s, low 4s, not at 2%. This probably means the Fed will not be easing much, although if there is a significant slowdown not caused from net trade – the Q1 drag was significantly from the surge in imports due to front-running tariffs – the Fed will ease even if inflation hasn’t come down. They’ll point to tariffs being transitory, although I sincerely doubt they will use that word! And they’ll be right, but they’ll also be wrong. Money supply growth is still too fast to accommodate 2% inflation especially in a deglobalizing world.
We’ll talk more about all of these things in columns here and in my podcasts over the next few months. But today I am still very preoccupied with getting USDi[1] launched, getting investors involved, talking to crypto ecosystem providers, etc. And I want to address one question I get routinely these days – not just about USDi, which exactly tracks CPI but adds nothing on top, but about the underlying investment strategy that I’ve been running/marketing for 3.5 years. The question is, “why should I buy something that returns CPI when inflation is at 3% and I can buy Tbills and earn 4.25%?” Here are two important pieces of the answer – and they’re just as important to investors who operate wholly in the traditional finance world as it is to people operating in the crypto world.
The first part of the answer is that while Tbills are above inflation now, that is not exactly guaranteed. In fact, for the last quarter-century it has been fairly unusual.

Sure, if you go back to the 1980s and early 1990s, when inflation was high and coming down and the Fed was following inflation down, you can find a lengthy period when Tbill rates were above inflation. Is the current period, with inflation where it is, comparable to the period when inflation was descending from double-digits and the FOMC was dominated by hawks? Do you think Trump will replace Chairman Powell and other Fed governors whose terms expire, with hawks? It doesn’t seem that way to me. I think it’s important to realize that is the bet you’re making, if you hold short cash instruments as an inflation hedge.
The second part of the answer is that holding a cash instrument does not protect you during an inflation spike because the Fed cannot respond fast enough, and a cash instrument in nominal space does not protect you from a dollar crisis. Almost nothing does, in fact, as stocks and bonds both do poorly in those cases as do ‘inflation hedge’ products based on equities or bonds. Here is a chart of the recent inflation spike. How well did your Tbills, or short-duration bonds (VTIP) or long-duration inflation bonds (TIP), keep up? Did they ever catch up?

To me, any allocation to low-risk securities that is meant to serve as a volatility buffer for a portfolio, but does not hold inflation beta, is completely missing the value of that beta in certain scenarios where very little else is helpful. When inflation spikes, stocks and bonds become correlated (down). You can (and should) add commodity allocations to your portfolio, but those consume part of your risk budget and push out the equities, hedge funds, private equity, and other higher risk asset classes. If you can get the inflation beta from a very low-risk part of your portfolio, you ought.
The foregoing is, transparently, partly self-serving. But the products I’ve been involved with developing have never been developed because they produce big fees or are easy to sell.[2] I’ve developed them because they’re useful to investors. And, parenthetically, I do think that the worker is worthy of his wages.
If you want to find out more about USDi, I urge you to visit the home page https://usdicoin.com, where you can see the current value of the coin increasing minute-by-minute with inflation. If you’re a denizen of the crypto world, then you might also be interested in joining the Telegram read-only group for the USDiCoin, available at https://t.me/USDi_Coin. That group is where we will make announcements about the coin, post the price of the coin periodically (at least daily; automation in process), post the monthly reports confirming the collateralization of the coin, announce new market-makers and markets…and also post some inflation-related charts, such as I used to do on Twitter on CPI morning, when Twitter allowed such automation. If you’re at all interested in inflation and/or the inflation-linked coin, hop on.
[1] If you don’t know what USDi is yet, read my prior article https://inflationguy.blog/2025/04/15/announcing-usdi-inflation-linked-cash/
[2] Understatement of the century.
