Archive
Where Is The Breaking Point?
A small aftershock is rippling through EU bond markets these days. Today Moody’s downgraded Greece 3 notches to B1, citing lagging tax collections and “implementation risks” that are increasing odds of a default event. In general, I am not a big fan of ratings agencies and I think they tend to be considerably behind the curve when it comes to ratings changes (and sometimes, in the wrong direction), but this serves to highlight the fact that not everyone thinks the European sovereign bond crisis is over. While it is no surprise that Greek 10y bonds did poorly on the news, you may not be aware that Irish and Portuguese 10y government bonds are also both at long-term highs today as well (see Chart).

Greek, Irish, and Portuguese bonds are all near their highs in yield although no where near their highs in angst.
Oil was up again today; although it backed off to end up only 1% or so, WTI is above $105 now. RBOB Gasoline declined 4 cents but is still over $3.
The stock market dashed out of the gate, and then subsequently dashed itself upon the rocks. The S&P ended 0.8% lower but had been toying with last week’s lows around mid-day. The VIX moved back above 20. Volume was again right around 1bln shares.
Bonds, despite the decline in stocks, also fell slightly with the 10y yield up to 3.503%.
The movement of stocks and bonds are consistent with markets that are working off over-bought and over-sold conditions and just chopping around in the meantime. That is more than likely what is going on. But the movement of European bonds is less hopeful. The movement to lower volatility but a consistent slip higher in yields could be a sign that pressure is slowly being released, that these markets were being artificially supported by the ECB and are gradually being allowed to slide back to their true equilibrium levels. If this is true, it is just a water torture being visited on the banking institutions that hold so much of this risk, building pressure there.
Alternatively, the steady move to higher yields could be a sign that banks are releasing their bonds steadily into a market that keeps backing up bids. In that case, the pressure is being released from the banks but building on the market itself. At some point, either the banks will finish selling and the bond market will stabilize, or – and this is the bad case – the bids will decide they’ve had enough, the market will evaporate, and a sharp break will occur. Given the size of the exposures that many European banks have to periphery sovereigns, I’m not super optimistic that homes can be found for all the paper at yields that allow the sovereigns themselves to continue to access the capital markets and thereby service the bonds.
But notice that if either of these are true (and it may be that neither is true, and that these are just markets adrift with no one participating or having much exposure – but I doubt that), the formula is that steady pressure is being applied either to banks’ economic capital (although not regulatory capital since sovereigns can be treated as being worth par at maturity) or to the bond markets themselves.
Perhaps I’m just thinking in this way because today I have been musing about nonlinear effects in financial markets as I am working on building a model of inflation expectations in which expectations are anchored within a range defined by the way people think about inflation (“low”, “medium”, or “high” for example) and remain in a range as pressure builds until abruptly there is a regime shift to another equilibrium. So, for example, perhaps people perceive inflation as “low,” and will persist in that belief for a while even if inflation outturns are “medium” for a while. But eventually, I think, the herd shifts to the new equilibrium in what is probably a non-linear break.
Lots of ink has been spilled on the issue of non-linear dynamics in complex systems. Some of my favorites are Ubiquity: Why Catastrophes Happen

(Don’t quibble about the finer points of my definition – it was after all a very brief summary).
Applied to the European periphery, the “transition” could come when suddenly bank credits adjust, or it could come (in the other case) when the bond markets collapse. Of course, neither transition is assured, and the system might return to a stable equilibrium.
Applied to the economy, growth might do just fine with oil at $95, $105, or $115/bbl, but then the economy abruptly rolls over at $118.21.
Applied to inflation, CPI might move gently from 1.0% to 2.0% to 3.0%, and then snap suddenly to 6.0% (this sort of outcome is more likely if expectations serve some sort of anchoring function/feedback mechanism, which I am not confident of).
I am not predicting, mind you, any of these things. My point is only to highlight that markets are generally in equilibrium but it need not be a stable equilibrium. Markets that are at extremes are prime candidates for ones that are nearing transition points, which is why we watch breakouts.
Clarifications and Updates
With little on the calendar for today, trading started out sluggishly but began to get more interesting as the day wore on. I am writing this comment earlier-than-usual today, because I am leaving soon to head to NYC and attend a very exciting meeting of the QWAFAFEW Quantitative Investment Society. The topic is “Chasing Bernie Madoff,” and the speakers are Harry Markopolos, Erin Arvedlund, Frank Casey, and Michael Ocrant. You will recognize these names if you read the excellent book No One Would Listen: A True Financial Thriller
Tomorrow’s trading ought to be slow; the only data are the trade balance (Consensus: -$45.0bln from -$46.3bln) and an Initial Claims (Consensus: 450k from 457k) figure that was pushed to Wednesday due to the Veterans’ Day holiday on Thursday. I would think that ‘Claims has some chance of exceeding expectations, since the earlier release may make it more difficult for all states to get their data in on time – and we have seen recently that when this happens, the BLS estimates tend to be mildly optimistic. (It isn’t an important enough report or likely to be an important enough difference that I would put any money on that supposition, but just be aware when the number is released that you need to ask “how many states didn’t report on time?”).
I need to make a quick note about yesterday’s comment. A reader who was confused (misled??) by my chart suggested that since the decline in the M2/M0 ratio wasn’t associated with deflation, the rise in the ratio may not be associated with inflation. I realized upon reading that remark that I probably should have shown a different chart because focusing on the ratio can be confusing. The point is not the level of the ratio, but rather the change in the level of M2 – that is what causes inflation. The ratio itself fell because the level of M2 didn’t change much when M0 ballooned, but that was (I think) because of IOER and perhaps other factors as well. The ratio fell, in short, because the denominator exploded. So, if the ratio goes back to its former level because the denominator (M0) collapses but the numerator (M2) is unchanged, that’s okay. But if it goes back to its former level because M2 explodes, that’s highly inflationary. So it isn’t the ratio you want to look at, it’s the level (really, the change) in M2. The chart below uses the same data, but separates the components. If you compare this chart to the ratio chart, it’s plain to see that it is the rise in the monetary base that drove the ratio lower. The question isn’t really whether the ratio moves, but whether M2 “catches up” or M0 declines back to its old levels. My math yesterday was meant to illustrate what M2 catching up would imply. To repeat yesterday’s caveat: I have no idea what will happen, and the point is, neither does the Fed…but the range of potential outcomes is large.

Splitting the ratio into its component parts makes my point clearer.
Thanks to the reader for pointing out this confusion.
.
A brief aside here on some other work I’ve been doing that may be of interest to readers, retail investors, or their advisors. I have written a paper called “Maximizing Personal Surplus: Liability-Driven Investment for Individuals” that is available at SSRN (here). Here is the abstract:
To date, the financial literature has focused on very simple algorithms designed to improve the solution to the two-part challenge of determining the optimal portfolio asset allocation strategy and determining the maximum sustainable withdrawal rate for retirees. Most research, for example the well-known “Trinity Study” of Cooley, Hubbard, and Walz, pursues the asset-allocation problem by maximizing long-run asset growth subject to a withdrawal rule and a given acceptable probability of remorse (a.k.a. shortfall). However, the Liability-Driven Investing (LDI) thought process improves the approach by seeking instead to maximize return for a given level of volatility of the portfolio surplus, rather than optimizing on the basis of the volatility the assets themselves; by more closely matching assets and liabilities, the sensitivity of the strategy to unexpected returns, risks, and correlations is greatly decreased. I update the Trinity Study to incorporate inflation-indexed bonds and then illustrate how the LDI thought process may be applied to individual investors.
One of the important things I do in the paper (at least, I think it is important) is to update a table that appeared in the original Trinity Study showing “portfolio success rates” for various combinations of stocks and bonds. When the original study came out, inflation-linked bonds were just getting started, so this important asset class wasn’t included. The analogous chart, based on Monte Carlo simulation (see the paper for more details) and including TIPS, is below.
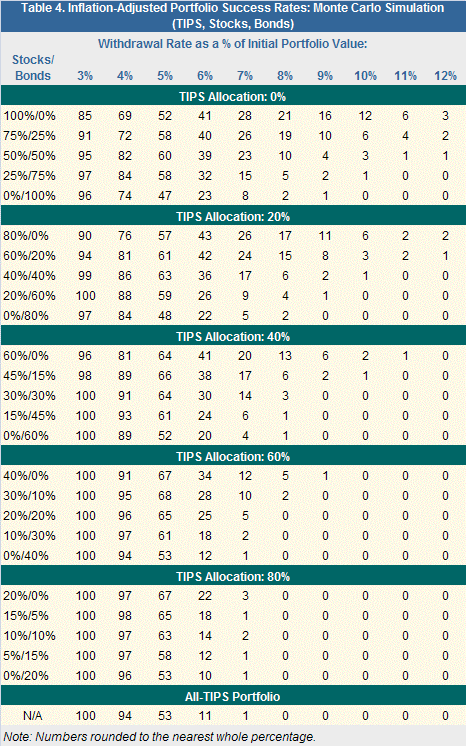
Updated Trinity Survey chart
If this interests you, take a look at the paper. I also illustrate how the “portfolio success rate” doesn’t necessarily tell the full story; you also care how long it takes, if the portfolio fails, for that failure to happen. Is it one year or 20? It makes a difference in planning. Moreover, the structure of your own “liabilities” matters in terms of finding the right allocation for you. If you’re interested, and read the paper, I am always interested in feedback.
Loose Ends
Apparently, it was too hot to do anything today but stay at home and put in equity bids, and stocks responded to the recent expression of market-indecision by rallying sharply. It surely didn’t hurt that Kansas City Fed President Hoenig opined that “current Fed policy makes asset bubbles more likely;” of course, equities are priced generously and buyers are seriously desirous of a bubble to jump aboard. I do not disagree with Mr. Hoenig, but in the current circumstance “more” likely is still pretty unlikely while wealth continues to be destroyed by a lengthening recession in employment. When the economy someday recovers and begins to grow, then he will be correct, but that bubble will take time to form. Today, I worry that several markets are priced – as I said – ‘generously,’ but I wouldn’t characterize stocks or bonds or credit or gold as being in “bubble” territory at the moment. For example, while 10-year yields sub-3% represents an investment that is very likely to be quite disappointing over that 10-year horizon, for it to be a true “bubble” I’d want to see near-unanimity of thought that there is nothing else that is a sure thing like owning 10-year Treasuries at 0%. I rather sense that skepticism about the bond market is quite high, and rightly so.
Since there weren’t any new economic data of note today, I want to tie up a few loose ends/idle thoughts I have had recently that didn’t necessarily fit at the time I thought of them, or that I recently thought of.
Inventory of homes
I read somewhere that “the national inventory of [new] homes available soared to an 8.5 months supply in May…” The market’s fascination with the months’ worth of inventory is unhealthy. The problem is that in a ratio such as this, it is probably worthwhile to separate the numerator and the denominator. In this case, the fact that the ratio shot up was due to the very low selling pace of new homes last month. In fact, the total seasonally-adjusted inventory of new homes is quite manageable, and suggests that builders have done a reasonable job of cutting back the supply (indeed, some of the low New Home sales rate might even be caused by the low inventory). See the chart (source: Bloomberg).
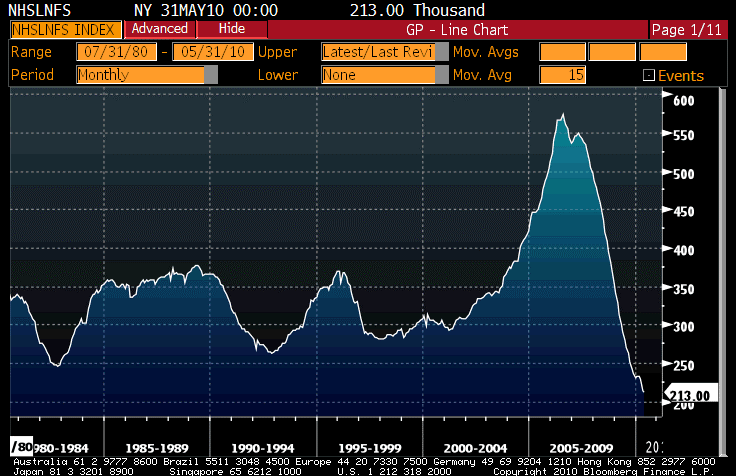
Inventory of New Homes is NOT that high...
The market made the reciprocal mistake in 2006, when the inventory was under 7 months of sales, but that was only because of a ridiculously high selling rate. The total inventory number told the real story: that there were an awful lot of homes out there, and if the pace of sales were to decline there would be a big problem. Looking at the ratio obscures this important detail. (People make the same mistake with the semiconductor book-to-bill ratio, where each part of the ratio matters too). Ratios like this are only particularly useful if the denominator is pretty stable.
Now, the bad news is that the inventory of existing home sales is still pretty high (see chart below, source Bloomberg). Why the difference? I suspect it is in the intake pipe…home builders are slowing their additions to inventory, but on the existing home side the bank REO will continue to add inventory for the foreseeable future. This hurts the builders too, of course, because the ready availability of a substitute keeps the lid on new home sales (and prices) as well. I think that when you eventually see the inventory of existing home sales dip back below 3mm again, it may be time to consider the builders.
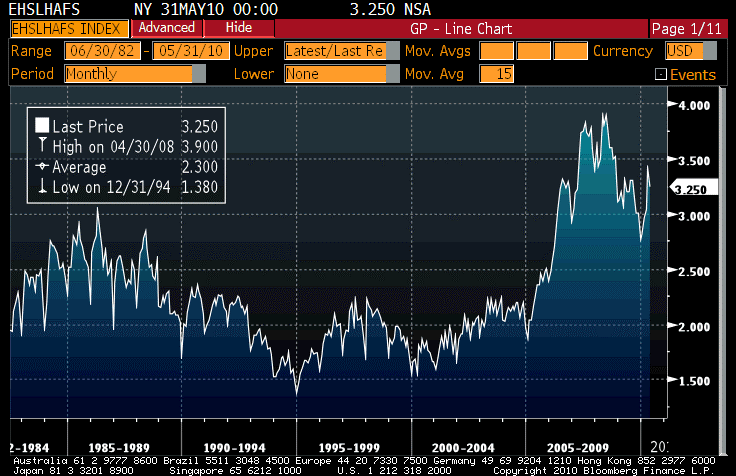
Unfortunately, inventory of existing homes is still elevated.
Problems with recession forecasting models
I am not a big fan of Goldman, but economist Jan Hatzius generally does a terrific job at spotting the key issue. In a recent article, he noted that “Typical recession forecasting models estimate a near-zero likelihood that the economy has entered recession again, or that it will in the near future. But they suffer from a serious bias: most models use the slope of the yield curve as a forecasting variable, with a flat or inverted curve a classic warning sign of a slowdown or recession.” This is a great point. Recently, Gene Epstein at Barron’s – who is the anti-Hatzius, and mostly misses the key points – has been touting the Credit Suisse “recession model” as virtual proof that there will not be a double-dip recession – see here for example. (My opinion is well-known. We are probably not going to have a double-dip because we are still in the primary recession, which will probably last for a while). Hatzius makes hash of these models by pointing out that the yield curve factor, which is normally a very important indicator of tight money and hence recession risk, is completely useless when the Fed has pedal pressed to metal. He reports that a forecasting model that leaves out the yield curve and also adjusts for “employment related distortions” (presumably Census stuff) estimates a 25% chance that the economy will be in recession six months from now. I would add, “still.”
Animal Spirits: A Book Worth Reading
Although Animal Spirits, by Akerloff and Shiller, isn’t the best book I have read that Shiller has written or co-written (that honor goes to Irrational Exuberance, of course), it is thought-provoking. The authors take issue with the current state of the economic “science,” which models economic actors as rational even while acknowledging that they are not. We all know this, but economics doesn’t really have any clever solutions or “workarounds” for the fact that there are many phenomena that aren’t explainable as the result of interactions of coldly-rational automata. Akerloff and Shiller, of course, are leading behavioral economists and believe that adjustments need to be made to the standard models to incorporate behavioral phenomena.
The best part of the book is Part One, where they discuss several aspects of “animal spirits”: Confidence, Fairness, Corruption and Bad Faith, Money Illusion, and Stories. I find especially compelling their suggestion that confidence and a “confidence multiplier” ought to be added to standard policy-multiplier models and find intriguing their speculation that confidence may be “contagious” and be model-able as an epidemic. My biggest complaint about the book, in fact, is that while they talk about such a thing they don’t actually propose the form of these adjustments (that point may be too academic for a popular book, but perhaps it will follow – or is already out there and I’m just unaware of it – in journal articles. Just because the standard models ignore behavioral factors doesn’t mean we can’t try and model these behavioral factors. Surely something between economics as pure science and economics as pure art is reasonable?). The authors go on in Part Two to discuss how such an approach to economics can help solve some of the classic conundrums: why depressions happen, why the labor market doesn’t clear, why personal savings is so arbitrary, etcetera. Some of the things they discuss in that section have been addressed by standard economics and the authors are just not happy with the answers…and they’re probably right.
In any event, this is a book worth reading, and it’s a fairly quick and easy read. You can find it on Amazon here
.
On Thursday the calendar has Initial Claims (Consensus: 460k from 472k). For 13 of the last 14 weeks, the economists have estimated too low compared to the eventually-revised number – on the June 18th week, the actual turned out to be 3k less than the consensus estimate. That is an amazing run of unrequited optimism about the economy, proving that economists don’t learn quickly. To be fair, the consensus estimate has risen from a low of 435k on the April 2nd week to the current 460k figure, so eventually economists will be in the right neighborhood.
The Treasury will issue $12bln in TIPS tomorrow. Dealers are very concerned about whether this issue will clear well, considering the low level of real yields (about 1.30% right now in the WI). They shouldn’t be. They should be concerned about the overall low level of yields (including nominal yields), but real yields are currently 41% of nominal yields, and haven’t been at an appreciably higher percentage since October. Put another way, the 10-year breakeven implied by TIPS and 10y nominals is around 1.72%, after having been as high as 2.43% as recently as April. That means that TIPS, while arguably expensive on some metrics, are still cheaper than they have been in a while. The auction may be sloppy, because dealers don’t have a lot of risk to take down paper like this, but I suspect the central bank bid will be pretty reasonable and the issue should clear up fine. I’d certainly bid for a tail.
Is Time On Our Side?
A week away, and nothing has really changed. The 10y yield is still around 3.84%. Stocks are still going up (although the Dow broke 11,000! Yay! By the way, when did anyone start caring about 11,000?). Greece is still in trouble, and there is still a rescue package for them. Really, this time. No, seriously. This time they mean it.
An important part of trading is figuring out whether time is on your side, or working against you. Right now, if you are a bond bull then time is against you. Every week brings billions in further supply. Every week that the data doesn’t start to roll over decreases the chances that we will have a double-dip recession and increases the chances that banks may begin to divest Treasuries in favor of making loans. Every week gets us closer to the day when the Fed hikes rates modestly, and the bond market overreacts. Every week brings us nearer to the day when some central banks start pulling back on liquidity, hurting all asset markets (and with some chance of a discontinuity in some of them).
To be sure, I don’t think that we need a strong economic recovery to produce higher interest rates. The monetary pressures on the global economy are all towards higher inflation, and those pressures will produce inflation at some interval. Right now, monetarists are selling bonds to Keynesians. All that economic strength (or just a pause in the sequential blow-ups) would do is cause those Keynesians to turn around and sell the bonds to…whom?
The market looks somewhat confused – except for equities, of course, where investors are often wrong but never in doubt. The zero-coupon inflation curve has a peculiar shape in that the curve of 1-year inflation forwards (1year inflation, 1 year forward; 1 year inflation, 2 years forward, etc) is upward sloping until 1-year inflation, 7 years forward. At that point, the curve projects 3.15% every year from the 8th year onward. Almost exactly (see chart below).

This is a rather peculiar shape.
I am not correcting here for convexity, but there isn’t broad agreement on which way that should bend the curve, anyway. I can’t decide if this illustrates that the market is pessimistic, that the Fed is going to let inflation slip up that high, or optimistic that the Fed won’t let inflation get out of hand. I rather suspect that investors aren’t sure either.
.
There are lots of reasons to be skeptical of the linear stock-market rally, but low volume isn’t one of them. An article I saw last week, during my vacation, (here) suggested that the rally has weak underpinnings because of the low volume. This is one of those times when the “art” of technical analysis is supposed to trump whatever science its practitioners claim for it. Volumes are lower, and will stay lower I suspect, because high-speed trading and market-making is being actively discouraged by regulators and the Administration generally. Most of the volume that we see these days – and one reason that volume has been losing its value as an indicator anyway – is scalping. If you lift the high-speed trader who in turn tightens the bid or lifts the better offer, double the volume trades although liquidity was only demanded once. This exaggerates the volume statistics. Moreover, the very low cost of trading, as reflected in tight bid-offer spreads, leads to more trading since it lowers the cost of hedging and makes more-frequent hedging more feasible. As bid-offer spreads widen, because of building momentum for the “Volcker Rule,” then volumes will naturally decline as a symptom of the lower liquidity. These are not per se bearish developments. Although I have argued that lower liquidity implies lower stock prices over time, by itself this is no reason to become bearish if you weren’t already.
.
I tend to use vacations to catch up on reading, as much as I can with two young children. And wow, did I read a great book last week. Richard Bookstaber wrote a book in 2007 called A Demon of Our Own Design: Markets, Hedge Funds, and the Perils of Financial Innovation
The specialists at the NYSE tried to elicit more buyers by dropping the price, but there was a limit to how much more buying interest they could attract. No matter how quickly the price was dropped, the decision making by the equity investors took time; unlike the twitch-quick futures pit traders, they made portfolio adjustments only after reasoned consideration. With their limited capital, the specialists were not willing to wait for the process to unfold, and their increasingly aggressive offers ended up backfiring. Prices dropped so violently that many potential buyers started to wonder what was happening and backed off completely. (page 20)
Bookstaber also has a number of observations about liquidity providers and the importance of liquidity providers that are very poignant today, as the Administration considers rules designed to make “proprietary trading” (also known as providing liquidity by substituting time for price) more difficult.
Liquidity providers provide a valuable economic function. Their business is to keep capital readily available for investment and to apply their expertise in risk management and market judgment. They look for instances of a differential between price and value, and as they trade to exploit that differential, they provide liquidity to the market. in short, they take risk, use their talents, and absorb the opportunity cost of maintaining ready capital. For this, they receive an economic return.(page 214)
In a very interesting analogy, Bookstaber argues that liquidity provision not only has direct economic value (look, he says, at the difference in price between two instruments that differ only in liquidity, like on- and off-the-run bonds, and you can see there is an economic consequence to illiquidity) but also a social value: “It provides economic freedom. It allows wealth to be accessed and used to take new opportunities.” And to demonstrate this, he reaches back to medieval England where there was no liquidity for wealth (because land could not be transferred).
Now, this book was written before the latest crisis, and as such it is well worth reading in light of what has happened and some of the knee-jerk responses that are resulting. In fact, he predicts some of those responses (although he figured they’d come after hedge funds, and instead they came after Wall Streeters themselves), but argues very persuasively for the importance of the economic function that these weasels provide. “But blaming hedge funds is a bit like The Simpsons episode in which a meteorite hits Springfield and the townspeople gather, shouting, ‘Let’s burn down the observatory so this never happens again!'”
In a nutshell, he argues that crises – such as the one that was about to happen when the book was published – stem from a combination of two factors: market complexity and tight coupling. Market complexity, which increases with more regulation rather than decreases, means that not only are there known unknowns, but there are unknown unknowns and, moreover, the market’s response to these unknown unknowns, when they happen, is not necessarily linear. And tight coupling means that there is no release valve; things happen too fast to figure out what to do next. In talking about crises, he draws an analogy to other disasters, like Chernobyl and the ValueJet crash in Florida a few years ago. It makes for compelling reading. I wholeheartedly recommend this pre-crisis book to anyone who is trying hard to understand the crisis in retrospect, and who thinks they know how to fix the problems at hand.
.
There is no important data out tomorrow: Trade Balance for Feb, Import Price Indices; Chairman Bernanke speaks in the evening on financial literacy, which is probably not market-moving anyway, but Richmond Fed President Lacker is going to be talking about the economic outlook. These speeches seem to move the market less than they once did, since we all figure that the Fed will tell us well in advance before they do anything, but there really isn’t much else on the docket. On Wednesday, we will get CPI…but I’ll talk about that tomorrow.
Saved By The Bell? Maybe Not.
It is on days like this that I realize just how little most of the investing world cares about fixed-income. To be sure, the big investors and the smart ones (despite popular opinion, there is some overlap between these sets, but perhaps not as much as we might like) care about bonds, and of course they should – and especially inflation-indexed bonds, since the investor’s fundamental goal is to maximize real after-tax wealth over time subject to risk appetite. But people still think stocks are the sexy asset. Evidence: CNBC barely bothered to broadcast today; it carried the Employment number and then turned away from news and toward “interest programming.”
Probably, no one will read this comment. My Friday comments never get read as much as comments the rest of the week, which is one reason I often delay publishing them until Sunday. In this case, however, I will be on vacation in the Cayman Islands come Sunday, and for the next week, so whether anyone reads it or not, here it comes:
The Employment data was not too far from expectations, especially when revisions are included (quite far from Deutsche Bank’s expectations, but not from most economists’). The Payrolls figure of 162,000 new jobs was pretty close to the ~180k consensus, and there were upward revisions to prior months. Now, while the headlines all weekend will trumped the strongest jobs growth in years, a fair reading of the numbers would temper enthusiasm somewhat. First, part of the jobs growth in the last two months has obviously been due to the hiring of Census workers, a temporary chore. In February and March combined, the Census Bureau added 63,000 workers. Moreover, it isn’t really fair to look at just March, which contained the weather snap-back, without considering February’s weather-dampened data. Averaging the two, net of Census workers, gives us a whopping 42k new jobs per month of underlying jobs growth. Certainly, that’s better than we had last year, but nothing to write home about – it’s still quite a bit less than the number needed to keep the Unemployment Rate stable over time. Indeed, the Unemployment Rate just missed an uptick, moving to 9.749%.
Internals to the data confirm the overall sense: this represents a modest, but very modest, improvement over recent trends. There is certainly nothing there that suggests the recovery is suddenly igniting in the way recoveries tend to. Normal recoveries, that is.
The bond market traded down on the number, fairly aggressively. What I read into that, despite the thin conditions, is that the bears are in control: no one seemed to want to dig into this at all to see if there was much to it (and there isn’t anything very exciting or surprisingly-strong, at least, to trigger such a move).
I am in the same camp. While I think the feeling that seems to be growing again that there are “green shoots” in this economy – maybe that happens every spring – are going to turn out to be disappointed, I am not bullish on bonds. As I have written here recently, I am bearish in the near-term as I think we’ll go through 4% on 10 year yields fairly easily now. The market closed with the 10y at 3.95%, so that’s not a big call – we may have gotten there today if the market hadn’t been scheduled to close at 11:00 ET! There are other support levels nearby, including a very big one that I think stands a decent chance of giving way. I have been using the chart below for years to argue that the secular bull market was still in place. Plotted are 10-year Treasury yields, monthly close, on a logarithmic scale (such long-term and large-scale moves usually need to be on log scale. The upper end of that channel? Right now, the line is at 4.14%.

The Big Test Comes Soon
As I said, there are some near-term support levels for the market, including 4% and that 4.14%. But we are also in a period that is very challenging for market bulls anyway. In 18 of the last 29 years, 10-year yields have risen in the 30 days following April 2nd, by an average of 14bps (the average includes the rallies as well as the selloffs. The average move, conditional on the fact that there was a selloff that year, was 32bps). See Chart below.

Tailwind To The Bearish Case
What is the driver, if it isn’t that there really are “green shoots”? Well, additional Treasury supply doesn’t hurt. But, while the recent plunge in the growth rate of money and credit numbers (see Chart below, source Bloomberg) may be good for inflation expectations in the long run…with a whole lot of caveats to that, by the way, which will make for a column another day…they are not very supportive of asset markets. Money’s gotta come from somewhere to buy assets.

If Assets Are Going Up, Where Will The Money Come From?
As noted above, I am out next week on vacation, and I will not be posting commentaries from the beach. I’ll return with something fresh to say. Maybe.
Beware Of Gifts Not Borne To Greeks
A month ago, in my column analyzing the January Employment report, I noted that there had been rumors that the EU would put together a bailout package for Greece over the ensuing weekend. Not much has really changed in the last month, has it? We are still talking about whether Greece will be able to defer its problems (no one really thinks that they are solvable in the near-term) long enough to prevent an acute crisis. Tomorrow German Chancellor Angela Merkel will meet with the Greek Prime Minister, but it appears to be mostly a photo op; according to an article in the online Wall Street Journal, Germany is not bringing the Greeks any gifts:
BERLIN (Dow Jones)–It is Greece’s responsibility to solve its budget problems on its own and Chancellor Angela Merkel will make this “very clear” in her meeting with Greek Prime Minister Georgios Papandreou Friday, German Economics Minister Rainer Bruederle said Thursday.
One thing that has changed, I suppose, is that we seem not to be worrying about Greece any more. The Nintendo Generation likes to see results quickly, or their attention drifts (that is one thing that politicians these days really count on!). No blowup in a month? Okay, move on to the next thing.
Global geopolitics is a “confidence game” in the original sense of the phrase: politicians play to be our confidantes and try and persuade us not to worry about little things. Little things like Greece defaulting, the tenability of the European Union, bank solvency, economic growth and inflation.
And so we hear the endless repetition of talking points designed to anesthetize us into believing that the talking points must be true if everyone is saying them, or (almost as good) to exhaust us into thinking that we don’t even care any more.
The Federal Reserve, once it commenced its Age of Openness, was destined to move one of two ways from that unsustainable (and mistaken) plateau: they could either become closed again, keep their own counsel and make decisions without needing to show everyone how unsuccessful they actually are at macroeconomic forecasting, or they could enter an Age of Persuasion, in which they attempt to actively influence economic outcomes by trying to convince economic actors to behave in the way that would be convenient to the Committee.
So today, Chicago Fed President Evans said he expects 3-3.5% growth this year with a “modest” decline in unemployment and stable inflation. He declares that the recession is over (albeit in a “narrow, technical sense”) and that while monetary policy cannot remain accommodative for too long, the end of accommodation is “probably quite a ways away.” The message is: don’t worry, things are getting better; please behave as if the recession is over and become more confident. Bond people: don’t worry about inflation, because we won’t remain accommodative for too long; equity people: don’t worry because inflation is stable and rates are going to stay low for a while anyway.
The Fed earnestly believes, we are led to think, that there can be no inflation with this large an output gap, and they want us to think so as well since “inflation expectations” play such an important role in their models. But if they really thought that inflation depended mainly on the output gap, then wouldn’t they be quite irresponsible to not print as much money as possible right now, since there is no downside? What restraint they have shown over the last year – and the growth rate of money aggregates has come way down from what it was during the crisis – is inconsistent with the expressed belief that the output gap dominates as a cause of inflation and that money is more or less inert. The truth is that they’re not sure (it isn’t settled science, after all), but if they behave as if they aren’t sure then how in the world are they going to persuade Congress that they should have the power they have? They need to at least appear assured of the efficacy of their policies.
These musings may appear a bit off-point, but a reading of Federal Reserve history makes it hard to conclude anything other than that the institution is very often feeling its way when making really big, important calls about how to manage the economy. The “science” of economics is still so new, and the difficulty of proving anything from noisy data so difficult, that it would be remarkable if the Fed had the powers that they actually represent that they have. This is all fresh in my mind because I recently finished reading The Federal Reserve And the Bull Markets: From Benjamin Strong to Alan Greenspan
“My view is that what is missing in Keynes’ general theory is a significant negative effect on the marginal efficiency capital from the types of actions that are implicit in very large fiscal stimulus. I can argue, and do indirectly through the hurdle rate of return, that substantial fiscal stimulus, working through inflation and a number of other things, sharply depresses effective private demand; while it may be expansionary in the short-run, it is not over the long-run and usually is counterproductive.” (citation is to Hargrove & Morley, eds, The President and the Council of Economic Advisers: Interview with the Chairmen)
(I quote that here mainly because a reader of this column said I didn’t understand Keynes when I said basically the same thing. I am not a fan of Greenspan but I imagine he understood Keynes.)
While I know a reasonable amount about Greenspan, I was delighted (and educated) by the deep historical research and analysis of Strong and Martin. The purpose of the book is to analyze these three Fed Chairmen, all of whom presided over lengthy equity bull markets, both in terms of their stated goals and in terms of their actions taken as Fed chiefs. It is remarkable how often these men railed about speculative excess but seemed powerless to know what to do with it or what their actions to restrain a runaway market might do in collateral damage to the economy. Moreover, the econometric modeling showed that Fed policy in terms of the policy rate itself responded only slightly to speculative excess: in the case of the Martin Fed, every 5% overvaluation in stocks produced a 14bps increase in the Fed funds rate; for the Greenspan Fed that was 18bps but their basic fitted model still indicated that policy was still too loose in 1999-2000 by some 150bps.
Again, the point isn’t that Chairmen are prone to let the stock market get overvalued, but that the Fed in general often isn’t sure what to do. This is why they really ought to keep their mouths shut and work it out behind closed doors; and it is also why observers should take everything they say that sounds definitive with a big shaker of salt. The Fed is really not worried at all about inflation while Unemployment is so high, we hear, although they may be concerned down the road a bit. If that is true, it is monetary malpractice because at the very least they ought to be worried about it. If it is false, then they’re just saying that to make us feel better. And that doesn’t make me feel better.
Now, I’m not saying that I could do a better job (or keep my mouth shut). But I think that I have a good respect for what I don’t know. For example, I have no idea what Payrolls will show tomorrow and I am dang glad I do not have to make a prediction. The consensus estimate is -50,000. But there are two large, indeterminate forces working at cross-purposes: the weather, which Goldman economists think could drop 100k from the number, and hiring for the decennial Census, which may add around 30,000. The important point is that whatever the usual variance we consider “normal noise” around the trend, it is significantly higher this month.
The January Employment report was pretty strong overall. The -20,000 jobs lost was worse than expectations, but the Unemployment Rate plummeted to 9.7% from 10.0% and, importantly, the decline came from a drop in the number of unemployed persons rather than from a rise in the Civilian Labor Force. This tends to give more confidence that the decline in the ‘Rate was at least partly real, which is probably why consensus expectations are only for a small bounce to 9.8%. Another decline in the ‘Rate, which I do not expect, would be serious news indeed. But the caveat to everything that we think we know from last month is that it was the January report, and subject to wider-than-usual error bars for that reason.
Personally, because of the recent decline in the absolute surveys I would be tempted to take the “under” on Payrolls and the “over” on the ‘Rate, but I have very low confidence in that guess and I wouldn’t even put a dollar on it.
Stocks today, with the 0.4% rally, moved the right direction technically, but are still within the range of the last three days. Neither stocks nor bonds, that is, are in a secure place where the market can take whatever the economic data throws at it. That is to say that the number will likely call the tune not only for the day, but probably for the next week, if it differs from expectations (as I said, there should be big error bars on the number but I don’t believe the market will respond cautiously). If the economists actually have gotten fairly close to the data, though, then perhaps it’s okay to turn one eye to the EU and see if anyone comes bearing gifts for the Greeks.
Of Oldster Welfare
Stocks attempted to add on to Friday’s rally, but the best of intentions wasn’t enough to do it in the face of bad momentum and bad fundamentals. The S&P declined 0.9%, with the Dow perhaps putting 10,000 in the rear-view mirror for now by trading to 9908. Yields also rose, with 10y futures declining 12 ticks…pressured, I am sure, by the debt supply this week.
The dollar continues to strengthen, and I am not sure I fully understand that. Of course, there is a knee-jerk response to exit positions in the Euro, and at the margin that makes sense to me since any bailing out of Greece would involve a lot of easy money, and any failure to bail out Greece would tend to weaken the union or raise the possibility of its dissolving altogether (this is not something I expect, in the reasonably near-term anyway). But selling the Euro to buy the dollar? With our deficit, our debt, our leaders’ studied insouciance when confronting the monumental task of putting the fiscal house back in order? Maybe it is true about the buck what Churchill once said about democracy: it’s the worst (currency unit) around, except for all the others.
But if that is true, then there are clearly alternatives to currency units that preserve wealth better. I am not a fan of physical gold, since it pays no dividend but implies storage and insurance costs, and tends to be subject to much greater tides of fad and fashion than less-lustrous metals, but commodities must be a consideration if people are running to greenbacks because it “sucks less” than paper currencies. Inflation-indexed securities in your domestic currency, which do pay interest, are a superior alternative although subject to the default option if your country doesn’t control its own scrip. Although real yields are very low, we’re talking about safe havens now and surrendering 0-1% in inflation-adjusted terms over the next year or two must warrant some consideration.
.
Another article today celebrated the “fact” that the unchanged $81bln quarterly refunding implies that the government can fund its much-larger debt this year without increasing auction sizes (and without the benefit of Fed buying, let us not forget). Let’s pretend for a second that we can somehow run the same auctions this year as last year…at least at the end of last year…with the same sizes, and yet raise more money. A very good article by Robert Samuelson today (“Big Government’s Big Shortfall“) notes that “By the administration’s estimates, that publicly held debt (the accumulation of all annual deficits) balloons from $5.8 trillion in 2008 to $18.6 trillion in 2020.” Let’s assume too, to be generous, that the government manages to have only 30% of that debt maturing in 2020 (even though, for a very long time, the percentage of marketable debt that has been maturing every year has not fallen below 34% – see Chart below, Source: Bloomberg).

Same Percentages But Bigger Debt Means Bigger Problem
That would imply that in 2020, the Treasury will need to fund the $1 trillion deficit they project for that year plus another $5.58 trillion of maturing debt, or about $25bln per business day. If 35% is rolling over, the numbers go to $30bln per day. Does anyone think that is sustainable, even on the generous assumption that the Administration’s numbers – which, remember, imply an uninterrupted decade-long expansion – are accurate? If we can’t do that in 2020, then sometime between now and then there will be a crisis. And the result of that crisis will very likely be that the value of those dollars changes markedly.
Because I mentioned Robert Samuelson today, I want to also mention a book of his that I recently finished reading. The title of the book is The Great Inflation and Its Aftermath: The Past and Future of American Affluence
I don’t agree with all of Samuelson’s explanations about what caused the inflation, nor all of his theses about the results, but it would be startling if, given a book of this depth and breadth on a topic I feel strongly about, I did. But his reasoning is very plausible and I think he lays out the hidden costs of inflation (as opposed to the direct costs that rapidly changing price levels cause) very well. Costs like the way society changed as a result of dealing with inflation. There are also, quite apart from the backstory about inflation, some very insightful nuggets that it would do us well to think about deeply right now, such as this one:
‘Capitalism’ is a term of art. There’s no precise definition, though there are some basic requirements. A capitalist system must permit private property, must tolerate relatively free markets and must endorse the social value of economic risk taking – meaning that people who take greater risks or who work harder can earn greater rewards. Up to a point, inequality is accepted as a necessary and desirable incentive for talent, effort, and innovation.
I hate to say it, but that doesn’t sound like any Western economy I know.
There is another little blurb worth thinking about, and he hits on some of the same themes in the column linked to above. In talking about certain entitlements, in particular Social Security and Medicare, Samuelson opines:
The fact that we haven’t made these and other changes says a lot about the welfare state. It is a profoundly conservative institution. It favors the past over the future. For recipients, the very act of receiving – or being promised – benefits creates a moral right to receive them, even if the original circumstances that justified them have vanished. Not by accident do we call these benefits ‘entitlements’ as opposed to the more straightforward term ‘welfare’…the self-serving vocabulary avoids the pejorative stigma of ‘welfare,’ which in America signals charity or a handout.
This is very insightful, and reminds me of some of the observation behavioral economics expert Robert Shiller has said. And it provides a brilliant place to start changing the debate about Social Security. Let’s first just past a bill changing its name to “Oldster Welfare,” and see how long it takes for some people to decide they don’t want it, or don’t feel it ought to be handed out to people who “don’t need welfare.” I think the national dialogue would completely change, maybe overnight. Let’s do it. You first.
.
Tomorrow, the market will absorb ABC Consumer Confidence and not much else on the economic calendar. Some more auctions, of course (1y and 3y securities)…what else is new? And folks on the Eastern seaboard will stampede grocery stores to prepare for the next wave of snowstorms, due to arrive tomorrow night and blow all day on Wednesday. And economic bulls will plot how that will somehow excuse any bad economic data over the next month, since after all I guess it doesn’t snow most winters. (???)
When Government Is Like A Box Of Chocolates…
I don’t know if it was Reagan who said it first, but he was the first person I am aware of who said that government’s approach to a problem is often “If it moves, tax it; if it keeps moving, regulate it; if it stops moving, subsidize it.”
This appears to be exactly what has happened in a number of cases recently, but we have discovered that the cycle doesn’t stop there but actually repeats. Financial companies have long been taxed and extensively regulated, but despite all of that earnest oversight, it turned out to be necessary to move to the “subsidization” round. Now, after extensive mollycoddling to rejuvenate the industry, the Obama Administration wants to tax the surviving and thriving companies – including those who have paid back TARP funds by issuing stock and borrowing heavily – to reimburse the country for all those recipients who are highly unlikely to ever repay the government (AIG, GM, etc).
The TARP recipients may not have taken the money originally if they knew that part of the terms included having to pay back not just their own loans, but everybody’s loans. Although, come to think of it, most of the TARP banks had no choice as the Treasury and Fed forced them to take money (to avoid “tainting” the ones who really did need it). The reasoning appears to be that some nebulous banking collective is what benefited from TARP, not just the specific banks in question, and now we must take “from each according to their needs,” as someone once said.
To boot, Vermont Congressman Peter Welch proposed today to copy the 50% tax on bonuses that the British and French are levying. So, rather than accepting the exodus of talent from those countries to our shores, we figure we’ll squeeze our guys too. Clever.
What is really damaging in all this, though, are not the policies in question but the increasing tendency for stochastic/spastic changes in rules.
I recently read a very good book, The Forgotten Man: A New History of the Great Depression
This is, of course, what happens when smart people are trying to steer the economy instead of letting the economy steer itself. There must be lots of mid-course corrections because no matter how smart Obama, Geithner, Bernanke, and friends are, they aren’t smart enough to understand the totality of the economy in all its dynamism. When they move this lever here, they realize that it creates a need to turn that knob over there, which further necessitates a button-push way over there. The economy naturally handles many of these things if left along, because businesses have financial incentives (if allowed to keep their gains for their shareholders) to handle those levers, knobs, and buttons that are their own specialty.
Now, whenever I think about volatility in any form I can’t help but think of options, as readers of my book will already know first-hand. One of the best non-financial uses of options theory I can remember hearing was when an old boss of mine, who was otherwise an ogre, explained why New York Knicks guard John Starks was a good player for a bad team but a bad player for a good team. Starks was a streak shooter, which is another way of saying his output in terms of points-per-shot was highly volatile. When he was on, he lit up the scoreboard; when he was off, as Knicks fans recollect to their sorrow, he could drag a team down in Game 7 of the NBA Finals. My former boss observed that on a bad team, this volatility was good because a “win” was an out-of-the-money option and an increase in volatility increases the delta of such an option. In other words, if you were unlikely to win anyway then Starks’ cold periods wouldn’t hurt, but his hot periods would cause you to win some games you wouldn’t have otherwise. However, on a good team that expected to win, a “win” was an in-the-money option and an increase in volatility decreases the delta. So the hot hand doesn’t often help (you were likely to win anyway), but the manos de hielo sometimes sinks you.
This is the key point to be drawn from options theory: if an option is in the money, then an increase in volatility lowers the delta (and the delta can be thought of roughly as the probability of winning); if the option is out of the money, then an increase in volatility raises the delta.
The extension of the option analogy to business may be clear. If the economy is collapsing (I mean, really collapsing), then trying a whole mess of things to stop the implosion of the financial system is arguably warranted, because survival is an out-of-the-money option. But in most cases, the financial/economic system works pretty well, and adding a lot of regulatory volatility to the mix runs the risk of taking that in-the-money option out of the money!
It occurs to me that I am make a presumption here, and that is that the financial/economic system works pretty well if left alone. That laissez-faire philosophy is typical of Republican (old style) or Libertarian thought – the system naturally works. But there are plenty of people who believe that the system doesn’t work if left alone; for example, it doesn’t distribute income “properly.” I suppose if you don’t grant my presumption, then it doesn’t necessarily follow that adding regulatory volatility is bad because even the economy of the mid-80s to mid-90s wasn’t doing what you wanted it to. If a rising tide does not in fact lift all boats, then it is necessary to erect boat lifts.
