Archive
Can’t Blame Trump for Everything
So much has happened since the Presidential election – and almost none of it very obvious.
The plunge in equities on Donald Trump’s victory was foreseeable. The bounce was also foreseeable. The fact that the bounce completely reversed the selloff and took the market to within a whisker of new all-time highs was not, in my mind, an easy prediction. I understand that Mr. Trump intends to lower corporate tax rates (and he should, since it is human beings – owners, customers, and employees – that end up paying those taxes; taxing a company is just a way to hide the fact that more taxes are being layered on those human beings). And I understand that lowering the corporate tax rate, if it happens, is generally positive for corporate entities and the people who own them. I’m even willing to concede that, since Mr. Trump is – no matter what his faults – certainly more capitalism-friendly than his opponent, his election might be generally positive for equity values.
But the problem is that equities are already, to put it generously, “fully valued” for very good outcomes with Shiller multiples that are near the highest ever recorded.
I think that investors tend to misunderstand the role that valuation plays when investing in public equities. Consider what has happened to the economy over the last eight years under President Obama: if you had known in 2008 that growth would be anemic, debt would balloon, government regulation would increase dramatically, taxes would increase, and a new universal medical entitlement would be lashed to the backs of the American taxpayer/consumer/investor, would you have invested heavily in equities? Yet all stocks did was triple. The reason they did so was that they started from fairly low multiples and went to extremely high multiples. This was not unrelated to the fact that the Fed took trillions of dollars of safe securities out of the market, forcing investors (through the “Portfolio Balance Channel”) into risky securities. By analogy, might stocks decline over the next four years even if the business climate is more agreeable? You betcha – and, starting from these levels, that’s not terribly unlikely.
I am less surprised with the selloff in global bond markets, and not really surprised much at all with the rally in inflation breakevens. As I’ve said for a long time, fixed-income is so horribly mispriced that you should only hold bonds if you must hold bonds, and then you should only hold TIPS given how cheap they were. Because of their sharp outperformance, 10-year TIPS are now only about 40-50bps cheap compared to nominal bonds (as opposed to 110 or so earlier this year), and so it’s a much closer call. They are not relatively as cheap as they were, but they are absolutely less expensive as real rates have risen. 10-year real rates at 0.37% aren’t anything to write home about, but that is the highest yield since March.
Some analysis I have seen attributes the large increase in market-based measures of inflation expectations on Mr. Trump’s victory. For example, 10-year breakevens have risen 20bps, from about 1.70% to about 1.90%, since Mr. Trump sealed the win (see chart, source Bloomberg).

I think we have to be careful about blaming/crediting Mr. Trump for everything. While breakevens rose in the aftermath of the election, you can see that they were rising steadily before the election as well, when everyone thought Hillary Clinton was a sure thing. Moreover, breakevens didn’t just rise in the US, but globally. That’s a very strange reaction if it is simply due to the victory of one political party in the US over another. It is not unreasonable to think that some rise in global inflation might happen, if Trump is bad for global trade…but that’s a pretty big reach, and something that wouldn’t happen for some time in any event.
In my view, the rise in global inflation markets is easy to explain without resorting to Trump. As the previous chart illustrates, it has been happening for a while already. And it has been happening because global inflation itself is rising (although a lot of that at the moment is optics, since the prior collapse of energy prices is starting to fall out of the year-over-year figures).
The bond market and the inflation market are acting, actually, like the Great Unwind was kicked off by the election of Donald Trump. We all know what the Great Unwind is, right? It’s when the imbalances created and nurtured by global central banks and fiscal authorities over the last couple of decades – but especially in the last eight years – are unwound and conditions return to normal. But if pushing those imbalances had a soothing, narcotic effect on markets, we all suspect that removing them will be the opposite. Higher rates and inflation and more volatility are the obvious outcomes.
Equity investors don’t seem to fear the Great Unwind, even though stock multiples are one of the clearest beneficiaries of government largesse over the last eight years. As mentioned above, I can see the argument for better business conditions, even though margins are still very wide. But I’m skeptical that better business conditions can overcome the headwinds posed by higher rates and inflation. Still, that’s what equity investors are believing at the moment.
*
A couple of administrative announcements about upcoming (free!) webinars:
On Thursday, November 17th (aka CPI Day), I will be doing a live webinar at 9:00ET talking about the CPI report and putting it in context. You can register for that webinar, and the ensuing Q&A session, here. After the presentation, a recording will be available on TalkMarkets.
On consecutive Mondays spanning November 28, December 5, and December 12, at 11:00ET, I will be doing a series of one-hour educational seminars on inflation. The first is “How Inflation Works;” the second is “Inflation and Asset Classes;” and the third is “Inflation-aware Investing.” These webinars will also have live Q&A. After each session, a recording will be available on Investing.com.
Each of these webinars is financially sponsored by Enduring Investments.
Brexit and Trump and Free Options
As the evening developed, and it began to dawn on Americans – and the world – that Donald Trump might actually win, markets plunged. The S&P was down 100 points before midnight; the dollar index was off 2%. Gold rose about $70; 10-year yields rose 15bps. Nothing about that was surprising. Lots of people predicted that if Trump somehow won, markets would gyrate and move in something close to this way. If Clinton won, the ‘status quo’ election would mean much calmer markets.
So, we got the upset. Despite the hyperbole, it was hardly a “stunning” upset.[1] Going into yesterday, the “No Toss Ups” maps had Trump down about 8 electoral votes. Polls in all of the “battleground” states were within 1-2 points, many with Trump in the lead. Yes, the “road to victory” was narrow, requiring Trump to win Florida, Ohio, North Carolina, and a few other hotly-contested battlegrounds, but no step along that road was a long shot (and it wasn’t like winning 6 coin flips, because these are correlated events). Trump’s victory odds were probably 20%-25% at worst: long odds, but not ridiculous odds. (And I believe the following wind to Trump from the timing of Obamacare letters was underappreciated; I wrote about this effect on October 27th).
And yet, stock markets in the two days prior to the election rose aggressively, pricing in a near-certainty of a Clinton victory. Again, recall that pundits thought that a Clinton victory would see little market reaction, but a violent reaction could obtain if Trump won. Markets, in other words, were offering tremendous odds on an event that was unlikely, but within the realm of possibility. The market was offering nearly-free options. The same thing happened with Brexit: although the vote was close to a coin-flip, the market was offering massive odds on the less-likely event. Here is an important point as well – in both cases, the error bars had to be much wider than normal, because there were dynamics that were not fully understood. Therefore, the “out of the money” outcome was not nearly as far out of the money as it seemed. And yet, the market paid you handsomely to be short markets (or less long) before the Brexit vote. The market paid you handsomely to be short markets (or less long) before yesterday’s election results were reported. And, patting myself on the back, I said so.

This is not a political blog, but an investing blog. And my point here about investing is simple: any competent investor cannot afford to ignore free, or nearly-free, options. Whatever you thought the outcome of the Presidential election was likely to be, it was an investing imperative to lighten up longs (at least) going into the results. If the status-quo happened, you would not have lost much, but if the status quo was upset, you would have gained much. As I’ve been writing recently about inflation breakevens (which was also a hard-to-lose trade, though less dramatic), the tail risks were really underpriced. Investing, like poker, is not about winning every hand. It is about betting correctly when the hand is played.
At this hour, stock markets are bouncing and bond markets are selling off. These next moves are the difficult ones, of course, because now we all have the same information. I suspect stocks will recover some, at least temporarily, because investors will price a Federal Reserve that is less likely to tighten and the knee-jerk response is to buy stocks in that circumstance. But it is interesting that at the moment, while stocks remain lower the bond market gains have completely reversed and are turning into a rout. 10-year inflation breakevens are wider by about 9-10bps, which is a huge move. But there will be lots of gyrations from here. The easy trade was the first one.
[1] And certainly not “the greatest upset in American political history.” Dewey Defeats Truman, anyone?
Math is Bad for Equities
In recent years, equities have been carried higher by several compounding effects: the growth of the economy, expanding profit margins, and expanding multiples.
These three things, by definition, determine equity prices (if we assume that gross sales are tied to economic growth):
Price = Price/Earnings x Earnings/Sales x Sales
When all three are rising, as they have been, it is a strong elixir for stock prices. Now, this explains why stock prices are so high, but the devil lies in predicting these components of course – no mean feat.
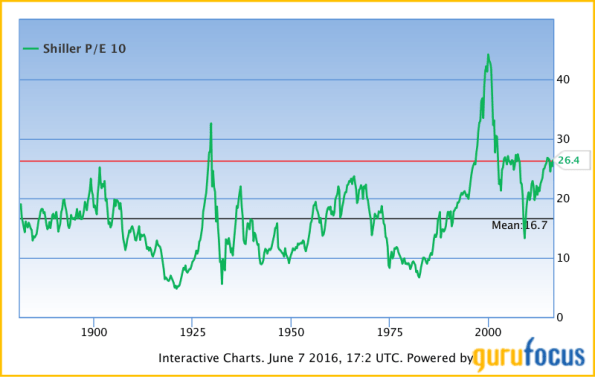
Yet, we can make some observations. It has been the case for a while that P/E ratios have been extremely high by historical measures, with the Shiller Cyclically-Adjusted P/E ratio (CAPE) roughly doubling since the bottom in 2009. With the exception of the equity bubble in 1999-2000, the CAPE has never been very much higher than it is now, at 26.4 (see chart, source Gurufocus). This should come as no surprise to anyone who follows markets regularly.
Somewhat less obviously, recently sales have been declining. However, on a rolling-10-year basis, the rise has been reasonably steady as the chart below (Source: Bloomberg) illustrates. Over the last 10 years, sales per share have risen about 2.85% per year.

Finally, profit margins have recently been elevated. In fact, they have been elevated for a long time; the 10-year average profit margin for the S&P 500 (see chart, source Bloomberg) has risen to 8% from 6% only a few years ago. Recently, however, profit margins have been receding.

Both the rise in profit margins and the current drop in them make some sense. Value creation at the company level must be divided between the factors of production: land, labor, and capital. When there is substantial unemployment, labor has little bargaining power and capital tends to claim a higher share. Moreover, labor’s share is relatively sticky, so that speculative capital absorbs much of the business-cycle volatility in the short run. This is ever the tradeoff between the sellers of labor and the buyers of labor.
I used 10-year averages for all of these so that we can use CAPE; other measures of P/E are fraught. So, if we take 26.4 (CAPE) times 7.84% (10-year average profit margin) times 1005.55 (10-year average sales), we get an S&P index value of 2081, which is reasonably close to the end-of-May value of 2097. That’s not surprising – as I said, these three things make up the price, mathematically.
So let’s look forward. Recently, as the Unemployment Rate has fallen – and yes, I’m well aware that there is more slack in the jobs picture than is captured in the Unemployment Rate, but the recent direction is clear – wages have accelerated as I have documented in previous columns. It is unreasonable to expect that profit margins could stay permanently elevated at levels above all but a few historical episodes. Let’s say that over the next two years, the average drops from 7.84% to 7.25%. And let’s suppose that sales continue to grow at roughly 2.85% per year (which means no recession), so that sales for the S&P are at 1292 and the 10-year average at 1064.15. Then, if the long-term P/E remains at its current level, the S&P would need to decline to 2037. If the CAPE were to decline from 26.4 to, say, 22.5 (the average since 1990, excluding 1997-2002), the S&P would be at 1736.
None of this should be regarded as a prediction, except in one sense. If stock prices are going to continue to rise, then at least one of these things must be true: either multiples must expand further, or sales growth must not only become positive again but actually accelerate, or profit margins must stop regressing to the mean. None of these things seems like a sure thing to me. In fact, several of them seem downright unlikely.
The most malleable of these is the multiple…but it is also the most ephemeral, and most vulnerable to an acceleration in inflation. We remain negative on equities over the medium term, even though I recently advanced a hypothesis about why these overvalued conditions have been so durable.
Roller Skating in a Buffalo Herd
The ECB fired its “bazooka” today, cutting official rates more into negative territory, increasing QE by another €20bln per month, expanding the range of assets the central bank can buy to now include corporate bonds, and creating a new 4-year program whereby the ECB will loan long-term money to banks at rates that could be negative (based on bank credit extended to corporate and personal borrowers).
My point today is not to opine on the power or wisdom of these policy moves. The main thing I want to observe is this: the inflation market is pricing in what amounts to success for global central banks, with consumer inflation averaging something between 1 and 2 percent per year for the next decade (a bit lower in Japan; a bit higher in the UK). Not only are inflation swaps prices much lower than would be expected from a pure monetarists’ standpoint – but options prices are also very low. The chart below (source: Enduring Investments) shows normalized volatilities[1] over the last five years for a 10-year, 2% year-over-year inflation cap. That is, every year you take a look and see if inflation was over 2%. If it was, then the owner of this option is paid the difference between actual inflation and 2%; if it was not, the owner gets zero. So you get to look ten times at whether inflation has gotten above 2%, and get paid each time it has.

The chart shows that whatever inflation is expected to be, the price to cover the risk that inflation is actually somewhat higher is very low. So, not only is inflation expected to be low, but it is expected to be not volatile either.
Look, we’re talking about bazookas, helicopters…does something not seem right about pricing in very little risk of screwing up?
Whether you believe my thesis in my freshly-released book What’s Wrong With Money?[2] that the likely course of inflation over the next few years is higher and potentially much higher, or you agree with those who think deflation is imminent, shouldn’t we agree that bazookas introduce volatility?
Central banks are attempting to do something that has never been done. Shouldn’t we at least be a teensy bit nervous, as they line up to perform the first-ever quintuple-lutz, that no one has ever landed one before? That no one has ever landed a commercial passenger jet on an aircraft carrier?
Uncertainty is supposed to lower asset values, all else being equal. So even if you think stocks at these levels are “fair,” in an environment with earnings and interest rates where they are now and projected earnings following a certain path, an increase in the volatility of those outcomes should lower the clearing price of those assets since the buyer of the asset (which has positive value) is also assuming the volatility (which has a negative value).
But the market also says that uncertainty right now is low. Yes, the VIX is well off its lows and seems to suggest greater short-term uncertainty (see chart below, source Bloomberg) – but I would argue that the long-term volatility of the economic fundamentals has rarely been this high.

Supposedly you can’t roller skate in a buffalo herd,[3] but we also have never tried to do it. There’s a reason we haven’t tried to do it!
But the Fed, and the rest of the world’s central banks, are not only roller skating in a buffalo herd – the world’s markets seem to be suggesting that investors are sure they’re going to succeed. Regardless of whether you’re optimistic about the outcome, I would argue it’s nearly impossible to be both optimistic and highly confident!
[1] This means something to options traders but can be glossed over by non-options traders. Essentially the point is that you can’t use a regular Black-Scholes model to price options if the strike and/or the forward can have a negative value!
[2] #1 on Amazon in “Economic Inflation,” thanks largely to all of you!
First Ballots are in on Results of Fed Tightening
It fascinates me how bear markets all feel alike in some ways. What I remember very clearly from the equity bear markets of 2000-2002 and 2007-2009 is that bulls wanted to bottom-tick the market at every imagined opportunity. Every “support level,” for the first half of each decline at least, saw bulls pile in as if the train were about to leave the station without them on it. Of course, the train was about to leave the station, but it was backing up.
Today, the S&P didn’t quite touch 1810 on the downside, basically matching the 1812 low from January. Bulls love double-bottoms. Of course, many of those turn out not to be double-bottoms after all, but the ones that are look very nice on the charts. So stocks rocketed off the lows, rising 25 S&P points in a matter of minutes after briefly being down 51. The rally was helped ostensibly by comments from the UAE oil minister, who claimed OPEC is ready to cooperate on a production cut. But that isn’t really why stocks rallied so dramatically; after all the news only pushed crude oil itself up about a buck. The real reason is that bulls are crazy maniacs.
They’re that way for a reason. If you are benchmarked against an equity index, it is very hard for an unlevered fund manager to beat that index in an up market. Once you subtract fees, and a drag from whatever cash holding you must have, you’re doing well to match the index since your limitation is (by definition of ‘unlevered’) 100% long.[1] Where a fund manager must beat his index is in a down market, by participating less than 100% in a selloff. But being an outperformer in a down market is less valuable since customer outflows are likely to outweigh the inflows if there is a serious bear market. Therefore, fund managers naturally fall into a pattern of scalping small selloffs for outperformance. But since they can’t really afford to miss being long in a bull market, there is a serious tendency to dive back in at any hint that the decline may be over.
So we get these entertaining, furious bear market rallies, which tend not to last very long. Of course, my entire premise is that this is an equity bear market, and I could be completely wrong on that. If I am, then ignore the prior paragraphs.
Where I am more confident that I am right is on the monetary policy side. Get this: since the Fed hiked rates, year-over-year M2 money growth has gone from 5.7% to…5.7%. Lest you think this anomaly (because tightening is supposed to involve a deceleration in money growth, right?!?), the 26-week growth rate in M2 has gone from 5.3% to 6.8%, and the 13-week growth rate from 2.9% to 7.3%. The annualized growth rate of M2 from mid-December to February 1st (the figure that was released today) is 11.2%. In other words, money supply growth is clearly not decelerating.
Now, in a traditional tightening, the Fed would restrict reserves and this would have the effect of reducing, or at least causing a deceleration in the growth rate of, M2 through the money multiplier. As a side effect, interest rates would rise but the point of tightening is to reduce the growth rate of money. Or, at least, it used to be.
With the Fed’s current operating framework, in which interest rates are moved around like magnets on a refrigerator to the desired level, there should be no meaningful effect on money supply growth. That’s not to say that money growth rates should accelerate (as they evidently have), merely that the growth rates should be stochastic with respect to authoritarian interest-rate manipulation. They may fall, or they may rise, but it should not be related to the Fed’s “tightening.” I’ve been saying this for a long, long time and the first evidence is in. The Fed’s rate hike has done nothing to reduce the growth rate of money, and therefore ought to do nothing to restrain inflation. Indeed, if higher interest rates follow from a series of Fed hikes – which they haven’t, but mainly because no one believes the Fed is going to hike again while their precious stocks are only 35% above fair value rather than 50% – then the expected effect would be for monetary velocity to rise and inflation to accelerate.
At this point, the Fed can thank the market that their moves haven’t accelerated the already-established trend towards higher inflation. But the clock is ticking. If the Fed does indeed hike rates next month, the bond market may start taking it seriously and start the rates-inflation spiral.
[1] Unless, of course, you’re adding alpha. But the universe of fund managers adds approximately zero alpha – slightly positive, and negative net of fees. Except whoever your manager is, of course. I’m sure he’s the best. Good job finding him!
Zigs and Zags
“The market,” said J.P. Morgan, when asked for his opinion on what the market would do, “will fluctuate.”
Truer words were never spoken, but the depth of the truism as well is interesting. One implication of this observation – that prices will vary – is that the patient investor should mostly ignore noise in the markets. Ben Graham went further; he proposed thinking about a hypothetical “Mister Market,” who every day would offer to buy your stocks or sell you some more. On some days, Mister Market is fearful and offers to sell you stocks at a terrific discount; on other days, he is ebullient and offers to buy your holdings at far more than they are worth. Graham argued that this can only be a positive for an investor who knows the value of the business he holds. He can sell it if Mister Market is paying too much, or buy it if Mister Market is selling it too cheaply.
Graham did not give enough weight to momentum, as opposed to value – the idea that Mister Market might be paying too much today, but if you sell your holdings to him today, then you might miss the opportunity to sell them to him next year for double the stupid price. And, over the last couple of decades, momentum has become far more important to most investors than has value. (I blame CNBC, but that’s a different story).
In either case, the point is important – if you know what you own, and why you own it, and even better if you have an organized framework for thinking about the investment that is time-independent (that is, it doesn’t depend on how you feel today or tomorrow), then the zigs and zags don’t matter much to you in terms of your existing investments.
(As for future investments, young people should prefer declining asset markets, since they will be investing for long periods and should prefer lower prices to buy rather than higher prices; on the other hand, retirees should prefer rising asset prices, since they will be net sellers and should prefer higher prices to lower prices. In practice, everyone seems to like higher prices even though this is not rational in terms of one’s investing life.)
We have recently been experiencing a fair number of zigs, but mostly zags over the last couple of weeks. The stock market is near the last year’s lows – but, it should be noted, it still holds 84% of its gains since March 2009, so it is hardly disintegrating. The dividend yield of the S&P is 2.32%, the highest in some time and once again above 10-year Treasury yields. On the other hand, according to my calculations the expected 10-year return to equities is only about 1.25% more per annum than TIPS yields (0.65% plus inflation, for 10 years), so they are not cheap by any stretch of the imagination. The CAPE is still around 24, which about 50% higher than the historical average. But, in keeping with my point so far: none of these numbers has changed very much in the last couple of weeks. The stock market being down 10%, plus or minus, is a fairly small move from a value perspective (from a momentum perspective, though, it can and has tipped a number of measures).
But here is the more important overarching point to me, right now. I don’t worry about zigs and zags but what I do worry about is the fact that we are approaching the next bear market – whether it is this month, or this year, or next year, we will eventually have a bear market – with less liquidity then when we had the last bear market. Dealers and market-makers have been decimated by regulations and constraints on their deployment of capital, in the name of making them more secure and preventing a “systemic event” in the next calamity. All that means, to me, is that the systemic event will be more distributed. Each investor will face his own systemic event, when he finds the market for his shares is not where he wanted it to be, for the size he needed it to be. This is obviously less of a problem for individual investors. But mutual fund managers, pension fund managers – in short, the people with the big portfolios and the big positions – will have trouble changing their investment stances in a reasonable way (yet another reason to prefer smaller funds and managers, but increasing regulation has also made it very difficult to start and sustain a smaller investment management franchise). Another way to say this is that it is very likely that while the average or median market movement is likely to be similar to what it has been in the past, the tails are likely to be longer than in the past. That is, we may not go from a two-standard-deviation event to a four-standard-deviation event. We may go straight to a six-standard-deviation event.
If market “tails” are likely to be longer than in the past because of (il)liquidity, then the incentive for avoiding those tails is higher. This is true in two ways. First, it creates an incentive for an investor to move earlier, and lighten positions earlier, in a potential downward move in the market. And second, in the context of the Kelly Criterion (see my old article on this topic, here), rising volatility combined with decreased liquidity in general means that at every level of the market, investors should hold more cash than they otherwise would.
I don’t know how far the market will go down, and I don’t really care. I am prepared for “down.” What I care about is how fast.
A Good Time to Remember
Some days make me feel so old. Actually, most days make me feel old, come to think of it; but some days make me feel old and wise. Yes, that’s it.
It is a good time to remember that there are a whole lot of people in the market today, many of them managing many millions or even billions of dollars, who have never seen a tightening cycle from the Federal Reserve. The last one began in 2004.
There are many more, managing many more dollars, who have only seen that one cycle, but not two; the previous tightening cycle began in 1999.
This is more than passing relevant. The people who have seen no tightening cycle at all might be inclined to believe the hooey that tightening is bullish for stocks because it means a return to normalcy. The people who have seen only one tightening cycle saw the one that coincided with stocks’ 35% rally from 2004-2007. That latter group absolutely believes the hooey. The fact that said equity market rally began with stocks 27% below the prior all-time high, rather than 32% above it as the market currently is, may not have entered into their calculations.
On the other hand, the people who dimly recall the 1999 episode might recall that the market was fine for a little while, but it didn’t end well. And you don’t know too many dinosaurs who remember the abortive tightening in 1997 in front of the Asian Contagion and the 1994 tightening cycle that ended shortly after the Tequila crisis.
Moreover, it is a good time to remember that no one in the market today, or ever, can remember the last time the Fed tightened in an “environment of abundant liquidity,” which is what they call it when there are too many reserves to actually restrain reserves to change interest rates. That’s because it has never happened before. So if anyone tells you they know with absolute certainty what is going to happen, to stocks or bonds or the dollar or commodities or the economy or inflation or anything else – they are relying on astrology.
Many of us have opinions, and some more well-informed than others. My own opinion tends to be focused on inflationary dynamics, and I remain very confident that inflation is going to head higher not despite the Fed’s action today, but because of it. I want to keep this article short because I know you have a lot to read today, but I will show you a very important picture (source: Bloomberg) that you should remember.

The white line is the Federal Funds target rate (although that meant less at certain times in the past, when the rate was either not targeted directly, as in the early 1980s, or the target was represented as a range of values). The yellow line is core inflation. Focus on the tightening cycles: in the early 1970s, in the late 1970s, in 1983-84, in the late 1980s, in the early 1990s, in 1999-2000, and the one beginning in 2004. In every one of those episodes, save the one in 1994, core inflation either began to rise or accelerated, after the Fed began to tighten.
The generous interpretation of this fact would be that the Fed peered into the future and divined that inflation was about to rise, and so moved in spectacularly-accurate anticipation of that fact. But we know that the Fed’s forecasting abilities are pretty poor. Even the Fed admits their forecasting abilities are pretty poor. And, as it turns out, this phenomenon has a name. Economists call it the “price puzzle.”
If you have been reading my columns, you know this is no puzzle at all for a monetarist. Inflation rises when the Fed begins to tighten because higher interest rates bring about higher monetary velocity, because velocity is the inverse of the demand for real cash balances. That is, when interest rates rise you are less likely to leave money sitting idle; therefore, investors and savers play a game of monetary ‘hot potato’ which gets more intense the higher interest rates go – and that means higher monetary velocity. This effect happens almost instantly. After a time, if the Fed has raised rates in the traditional fashion by reducing the growth rate of money and reserves, the slower monetary growth rate comes to dominate the velocity effect and inflation ebbs. But this takes time.
And, moreover, as I have pointed out before and will keep pointing out as the Fed tightens: in this case, the Fed is not doing anything to slow the growth rate of money, because to do that they would have to drain reserves and they don’t know how to do that. I expect money growth to remain at its current level, or perhaps even to rise as higher interest rates provoke more bank lending without and offsetting restraint coming from bank reserve scarcity. By moving interest rates by diktat, the Fed is increasing monetary velocity and doing nothing (at least, nothing predictable) with the growth rate of money itself. This is a bad idea.
No one knows how it will turn out, least of all the Fed. But if market multiples have anything to do with certainty and low volatility – then we might expect lower market multiples to come.
Walmart Traffic may be Down but Wall Street Traffic is Up
Walmart (WMT) didn’t have its best day today. The bellwether retailer forecast a profit decline of 6-12% in its 2017 fiscal year, in some part because of a $1.5bln increase in wage expenses; the stock dropped 10% to its lowest level since 2012 and off about 33% from the highs (see chart, source Bloomberg).

I mention Walmart neither to recommend it nor to pan it, but only because in the absence of news from WMT I would have been inclined to ignore the modest downside surprise in Retail Sales today; September Retail Sales ex-auto-and-gasoline were unchanged versus expectations for a +0.3% rise. But Retail Sales, like Durable Goods, is a wildly volatile number (see chart, source Bloomberg).

This was a bad month, but it wasn’t the worst month in 2015. It wasn’t even the second or third-worst month in 2015. Looking at a monthly figure, it is difficult to reject any null hypothesis; put another way, you really cannot discern whether +0.5% is statistically different from +0.0%. [I didn’t actually do the test…I am just making the general statistical observation.] Today’s data will tweak the Q3 forecasts a bit lower, but isn’t anything to be upset about. Except, that is, for the fact that Walmart is bleeding.
There is something else that is different about this decline, and really about this whole year. I have documented in the past the steady decline in equity volumes that has been occurring for almost a decade now. The chart below shows the cumulative NYSE volume, by trading day of the year, for 2006 through present. Note the steady march lower in volumes year after year after year. 2014 and 2013 were almost mirror images, so you can’t see 2014. But notice the thicker black line: that is 2015.
 Here is another way to illustrate the same thing. By year, here is the number of days that less than 1 billion shares traded in NYSE Composite Volume.
| Number of sub-billion share days | |
| 2005 | 4 |
| 2006 | 7 |
| 2007 | 7 |
| 2008 | 18 |
| 2009 | 35 |
| 2010 | 113 |
| 2011 | 166 |
| 2012 | 240 |
| 2013 | 246 |
| 2014 | 246 |
In 2015, we are on pace for a mere 228 sub-billion share days.
I guess by now my point is plain, but here is one more chart and that is the rolling 20-day composite volume for 2014 (lower line) and 2015 (upper line).

In general, volumes have been higher this year, but the real divergence began at the end of July, when the lines began to move away from each other more rapidly. The equity breakdown started on August 20th.
What does this all mean? Rising trading volumes while markets are declining suggests we should consider imputing more significance to what many are calling a correction but which may be the beginning of something deeper. There are re-allocations happening, and outright sales – not just fast money slinging positions around. Technically, this is supposed to put more weight on the “damage” done by this correction, and raise a bit of a warning flag about the medium-term set-up.
Incidentally, you can buy warning flags cheaply at Walmart.
Recession Won’t Be Fun…But Better than Last Time
Yesterday, I mentioned the likelihood that a recession is coming. The indicators for this are mostly from the manufacturing side of the economic ledger, and they are at this point merely suggestive. For example, the ISM Manufacturing Index is at 50.2, below which level we often see deeper downdrafts (see chart, source Bloomberg).

Capacity Utilization, which never got back to the level over 80% that historically worries the Fed about inflation, has been slipping back again (see chart, source Bloomberg).

Now, we have to be a bit careful of these “classic” indicators because of the increased weight of mining and exploration in GDP compared with the last few cycles. A good part of the downturn in Capacity Utilization, I suspect, could be traced to weakness in the oil patch. But at the same time, we cannot blithely dismiss the manufacturing weakness as being “all about oil” in the same way that Clinton supporters once dismissed Oval Office shenanigans as being “all about sex.” Oil matters, in this economy. In fact, I would go so far as to say that while historically a declining oil price was a boon to the nation as a whole (which is why we never suffered much from the Asian Contagion: the plunge in commodity prices tended to support the U.S., which is generally a net consumer of resources), in this cycle low oil prices are probably neutral at best, and may even be contractionary for the country as a whole.
Whether we have a recession in the near term (meaning beginning in the next six months or so) or further in the future, here is one point that is important to make. It will not be a “garden variety” recession, in all likelihood. That is not because we have boomed so much, but because we are levered so much. There are no more “garden variety” recessions.
Financial leverage in an economy, just as in individual businesses, increases economic volatility. So does operational leverage (which means: deploying fixed capital rather than variable inputs such as labor – technology, typically). And our economy has both in spades. The chart below (source: Bloomberg) shows the debt of domestic businesses as a percentage of GDP. Businesses are currently more levered than they were in 2007, both in raw debt figures and as a percentage of GDP.

Investors fearing recession should shift equity allocations (to the extent some equity allocation is retained) to less-levered businesses. But be careful: some investors think of growth companies as being low-leverage but tech companies (for example) in fact have very high operating leverage even if financial leverage is low. Both are bad when earnings decline – and growth firms typically have less of a margin of safety on price. I tried to do a screen on low-debt, low-PE, high-dividend non-tech companies with decent market caps and didn’t find very much. Canon (CAJ), Guess? Inc (GES) to name a couple of examples…and neither of those have low P/E ratios. (I don’t like to invest in individual stocks in any event but I mention these for readers who do – these aren’t recommendations and I neither own them nor plan to, but may be worth some further research if you are looking for names.)
On the plus side, economically-speaking, relatively heavy personal income taxation also acts as an automatic stabilizer. On the minus side, this is less true if the tax system is heavily progressive, since it isn’t the higher-paid employees who tend to be the ones who are laid off (except on Wall Street, where it is currently de rigueur to cut experienced, expensive staff and retain less-experienced, cheaper staff). Back on the plus side, a large welfare system tends to be an automatic stabilizer as well. On the minus side, all of these fiscal stabilizers merely move growth from the future to the present, so the deeper the recession the slower the future growth.
And, of course – there is nothing that central banks can really do about this, unless it is to make policy rates negative to spur additional extension of negative-NPV loans (that is, loans to less-creditworthy borrowers). I am not sure that even our central bank, with its unhealthy fear of the cleansing power of recession, thinks that’s a good idea.
There is some good news, as we brace for this next recession: while overall levels of debt are higher for businesses, financials, and households, the debt burden compared to GDP is lower for households and especially for domestic financial institutions (see chart, source Bloomberg).

Our banks are in relatively good health, compared with their condition headed into the last downturn. So this will not be a calamity, as in 2008. But I don’t expect it to only be a “mild” recession, either – as if any recession ever feels mild to individuals!
Contour Map
Let us begin with this: there is nothing inherently healthy about a series of +2% and -2% days within a range.
Having some grey hair (just a little!) is helpful in times like these because markets go through repetitive phases and it helps to have some historical comparisons to be able to guide an investor. At the same time, experience can be limiting if we try to force everything we are seeing into a particular historical comparison.
So, for example, I never view with anything but amusement the charts of day-by-day comparisons between this year’s market action with, say, that of 1929. Or, as another example I have seen: comparing a market to the Nikkei crash in the early 1990s. These are interesting an amusing market parallels, but there is no road map to markets. There is only a contour map.
The contours of this market are reminiscent to me of the end of the tech-led bull market in 2000. The valuation parallels are obvious, but I am not talking about that. In 2000, as the market crested in March and began to head lower, we started to have very large overnight moves – sometimes higher, sometimes lower – followed often by a sharp open, directionless trading during the day, and often a sharp move at the close. This was the signature of fast money, which tends to get more timid during the daylight but which enjoys monkeying about with buy and sell stops overnight. In general, as the market headed lower, it seemed like Mondays tended to be pretty good, and Fridays tended to be pretty bad as no one wanted the weekend risk. There was a lot of volatility, and some spectacular up days. But month after month, the market was more likely to end the month lower than it began.
I think we are in that mode again, although it is hard to tell if we have anything like that kind of bear market ahead of us. Certainly, we can make that point valuation-wise. Also, interest rates have much more room to move higher from here than to move lower. While I think the economy is slowing, and any Fed action is likely to be small, tentative, and probably delayed, my point is that interest rates are not likely to provide a following wind to valuations.
Indeed, while nominal interest rates are still locked near 2% on the 10-year note, real interest rates are near the highest levels in five years (see chart of 10-year real interest rates, source Bloomberg).

The flip side of stable nominal interest rates and rising real rates, of course, is declining inflation expectations. By our calculations, the market is currently implying core inflation to be below the Fed’s target for at least a decade. And this is despite the fact that, measured by median inflation, it is already at target.
I once believed that the Fed could not really control long-term interest rates, although at least in principle they can control Treasury rates like they did in WWII, by simply buying or selling whatever it takes to keep rates at their target (it was easier then, as the market was a lot smaller!). And I guess that, deep in my gut, I still believe that. But I must admit that the evidence that they can control nominal interest rates, at least in normal times (that is, when the weight of the market doesn’t strenuously disagree), is starting to look pretty strong. There is absolutely no rationale for 10-year nominal interest rates at 2% in an environment where real interest rates are 0.65%, current inflation is 2.3%, and there is a large amount of money in circulation – with no plans in place to drain it.
(For anyone claiming a fear of deflation, I just shake my head in disbelief. Choose: Do you want to be a monetarist, in which case you have to construct a case for deflation from 6+% money growth and money velocity that is already at levels below any previously measured; or do you want to be a Keynesian and explain how you get deflation with unemployment at 5.1%? The third way is hand-waving, claiming that large amounts of debt lead mystically to deflation. But large amounts of public debt have never led to deflation in the past, and there is no obvious mechanism for it to do so.)
My reading of the contour map suggests a market valley ahead. It is a deep valley, but the good news is that there is a mountain on the other side of it. There always is.
I may have the lay of the land wrong, but I have been over this ground before. Watch your step.
