Archive
Beware the Great Unzipping
It was a fitting conclusion to Friday the 13th when S&P, after the close of the markets for the week, announced a list of ratings downgrades for European sovereigns. There had been rumors throughout the day, and some leaks, but it wasn’t until 4:30ET on Friday that we saw the list in full. Key among the downgrades were Austria and France, which fell from the ranks of the AAA. This means that the ESM probably won’t be able to secure a AAA rating, which means its potential effectiveness (which was never likely to be enough anyway) declines, which means the ECB will need to shoulder more of the load. This they seem resigned to do, but we will have to see if it is going to be enough.
Also getting downgraded, in some cases to junk, were Cyprus, Italy, Portugal, Spain, Malta, Slovakia, and Slovenia. How far have Italy, Portugal, and Spain fallen that they are included in the same list of anything with Cyprus, Malta, Slovakia and Slovenia? Germany, as was expected, retained its AAA rating but somewhat surprisingly had its outlook upgraded to neutral. That seems wildly incoherent to me; unless the Euro breaks up almost immediately, there are too many drowning swimmers clutching at Germany. I cannot imagine she will not be dragged down too, eventually.
The downgrades are over (from S&P) for now, but there will be more in the future. S&P said France risks another downgrade if public debt and the deficit deteriorate further, which they almost certainly will. Note also that S&P didn’t even consider as a possible scenario the breakup of the Eurozone, which is incredible – at the very least, it is possible!
S&P tactically waited until after markets were closed before making the former announcement, so as to give investors time to absorb the information and to coolly consider their next moves rather than reacting off the cuff. On the basis of the ratings changes, there would likely be a modest decline in the markets on Monday (in Europe), but there were no major surprises here and now that the deed is done, there will presumably be an interval before the next downgrades. I was hoping that 10-year French real yields would still be up around 1.25%-1.5% when the downgrades happened, since a spread of 150bps over the U.S. seems adequate and 1.5% isn’t a horrible real yield. Unfortunately, after spiking over 2% in late November, those yields are now back slightly under 1%.
But for another reason, even if those yields rose back up I’d be reluctant to dive in until institutions are done selling their European sovereigns. Because while the weekend gave investors time to calmly consider their strategy and buy lists, it unfortunately also gave German Chancellor Merkel time to tell reporters that she’ll consider legislation to “bar institutional investors such as insurance companies from selling bonds when ratings were downgraded.” I’m not making that up. Let’s hope that comment was taken out of context, but if it isn’t clarified by Monday morning, I would assume most institutions would err on the side of dumping bonds they can still sell today, but may not be able to sell in the future. Honestly, I really think this must be a mistake. It’s the stupidest thing I’ve ever heard.
And that’s really saying something given the last year in Europe, isn’t it?
Talks in Greece aimed at reaching agreement on the conditions (effectively) for continued disbursement of the rescue funds were suspended over a dispute about what coupon the new Greek debt would carry. That is clearly a nonsensical point of dispute since there’s almost no chance the debt will be repaid no matter what the coupon. The only decision to be made here is whether Europe wants to flush another couple hundred billion Euros away in order to delay the default to a time that would be more convenient. The artificial argument here suggests to me that at least some of the bailout-providers have decided that throwing good money after bad in a Quixotic quest to prevent a default is not the best use of capital…financial or political.
Now, there’s no surprise here either. Greece is going to default, or equivalently they’re going to leave the EZ and redenominate the debt into printed drachma. I still think the markets rally when Greece announces that it is going to default. Perhaps there will be a knee-jerk dip first. The more delicate question is what will happen when she leaves the Euro.
The Eurozone crisis has moved into slow-motion, which suits everyone. As long as no country leaves the Euro, the crisis can probably be kept in slow motion with the aid of heaping helpings of money from the ECB. But, if Greece leaves the Euro – and I think it will – then there can no longer be any illusion about the inviolacy of the currency unit. The removal of that illusion could cause the situation to unzip rapidly since of course if Greece can/must exit, then surely Spain, Portugal, and some other countries can/must as well. And since the exit of Spain from the Euro is, I think, not at all priced into the market: that is where you could get a rather violent reaction on the unzipping (especially in thin, illiquid markets such as we have currently).
In the meantime, the raw economic data is not great, but also not disastrous. I don’t put any weight on the Initial Claims data at this time of year, and really for the next 2-3 weeks, so the rise in the figures this week don’t concern me. The sag in Retail Sales (-0.2% ex-auto, compared to +0.3% expected) matters, especially since it was December Retail Sales. It was the first negative print since mid-2010, and worth watching. Again, I don’t expect growth to implode here, but I also don’t think the aggressive hopes of equity investors will be realized either. That said, M2 was also up $85bln last week (over year-end), putting the 52-week rise to 10.8%…a new high. That money will go somewhere – some of it into asset markets, and some of it into product markets. It is hard to be short anything here, but as I noted the other day I can easily justify being long inflation!
Liability-Driven Investment for Individuals
I will have another comment out over this long weekend, and it may well mention the S&P ratings downgrades of most of Europe, which just hit the tape. However, I just learned that the Society of Actuaries finally published a paper of mine in their “Retirement Mongraph,” available here, and I figured I would mention it to followers of this blog.
Here’s my abstract:
To date, the financial literature has focused on very simple algorithms designed to improve the solution to the two-part challenge of determining the optimal portfolio asset-allocation strategy and determining the maximum sustainable withdrawal rate for retirees. Most research, for example the well-known “Trinity Study” of Cooley, Hubbard, and Walz, pursues the asset-allocation problem by maximizing long-run asset growth subject to a withdrawal rule and a given acceptable probability of remorse (a.k.a. shortfall). However, the Liability-Driven Investing (LDI) thought process improves the approach by seeking instead to maximize return for a given level of volatility of the portfolio surplus, rather than optimizing on the basis of the volatility of the assets themselves; by more closely matching assets and liabilities, the sensitivity of the strategy to unexpected returns, risks, and correlations is greatly decreased. I updated the Trinity Study to incorporate inflation-indexed bonds and then illustrate how the LDI thought process may be applied to individual investors.
Please let me know if you have any questions or comments!
How To Exceed Expectations (Or At Least Keep Up)
As we wait for something interesting to happen in the markets – or at least for some volume! – I thought I would write about a way that investors can, should they choose to, invest in a security that is directly linked to inflation expectations. Tomorrow there is useful economic data in the form of Retail Sales (Consensus: 0.3%/0.3% ex-auto) and Initial Claims (Consensus: 375k vs 372k last), although this last is subject to huge error bars because the weeks just before and just after the new year are very hard to seasonally adjust. Still, it’s data. Otherwise, the market continues to chop around with little volume and seemingly little conviction. It’s a good time to consider other approaches, so I am going to do that today.
With monetary policymakers in virtually every corner of the globe furious pumping liquidity into the world’s economies, it is no surprise that many asset markets are not cheap. Equities are expensive, although less so than they were last year; nominal bonds are terribly expensive. Inflation-linked bonds generally sport real yields below zero (out to 10 years) and insubstantial real yields beyond that. Commodities look cheap as a whole, but even though commodity indices are as diversified as equity indices many investors have a hard time putting a huge weight in commodities because of the sense that they are “risky.” Corporate inflation-linked bonds are doubly expensive, with real rates quite low and credit spreads tighter than they should be given the economic outlook. How then can an investor protect him/herself from the possibility of inflation moving higher?
I have been an advocate for commodity indices, of course, which tend to do well when real yields are low and in the early stages of inflationary surprises. But there is another way now that retail investors can fairly easily be long inflation expectations.
First, let me explain some basics. When we talk about nominal yields, such as normal Treasuries have, we recognize that they are made up of several parts. If I borrow money from you, you will first assess the real cost of money – how much more stuff do you want to have at the end of the loan, in order to convince you to defer consumption and lend me the money? That is the real interest rate. Second, you will evaluate how much less the dollars you receive from me at the end of the deal are likely to be worth, compared to the dollars you pay me at the beginning of the deal. This is an adjustment for expected inflation. There is a third adjustment, probably, that relates to the uncertainty of the real return when the nominal yield is fixed; this extra premium is called the inflation risk premium.[1] The Fisher equation is approximately:
y=r + i,
where y is the nominal yield, r is real yield, and i is expected inflation plus the risk premium. Because this latter quantity is what you need to realize if you buy an inflation-indexed bond with a real yield of r, in order to break even against a nominal investment that pays a yield of y, this is called breakeven inflation, or BEI.
This background is necessary to understand the following statement: TIPS are not “inflation-protected” in the sense that they do better when inflation rises. TIPS are real rate instruments, whose real price depends only on the real yield to maturity. The nominal value of a TIPS bond depends on the actual inflation realized over time, but this just means that a TIPS bond is immune to inflation. The real return of a TIPS bond depends only on the yield of the bond at purchase, if it is held to maturity.[2]
And so, a TIPS bond is just like a nominal bond in the sense that if its yield rises, its price falls. The Barclays Capital 1-10y TIPS Index returned 9.00% for 2011. That wasn’t because inflation was 9%, but rather it was mostly because real yields fell over the course of the year. The flip side is also true: if real yields rise, then TIPS will decline in value (although as I said, if held to maturity you will receive the real yield the bond sported when you bought it). And guess what will happen when inflation really picks up? You got it: real yields, along with nominal yields, will likely rise. While real yields should rise less than nominal yields in such a circumstance, it will not feel like “inflation protection” if your TIPS lose 9% when inflation is positive 4%.[3]
Now, I’m concerned about inflation, and while I think TIPS will beat nominal bonds handily over the next five years they may both have negative returns. I could simply short nominal bonds (and I have, via the TBF ETF), but if I am wrong – or if the Fed simply holds down nominal yields forever – that won’t produce the outcome I want. I would like to be long “i”, or inflation expectations. An institutional investor can do that by buying inflation swaps, or buying TIPS and shorting nominal bonds. A retail investor can buy a TIPS ETF (such as TIP) and short nominal bonds with a different ETF (such as TBF), but this is clunky, and since the durations may not match up well it requires a fair amount of work to get the right hedge. But there’s another way, which I will discuss in one moment.
Before I do, let me show one or two charts as context for what I have said recently. Quoting again from my week-ago comment,
It is incredible to me that with monetary conditions as accommodative, globally, as they have been in decades, inflation swaps are still nearly as cheap as they have ever been. That’s truly striking. What is the 10-year downside to a long inflation position from these levels? One-half percent per annum? Seventy-five basis points per annum? How low can inflation be over the next 10 years, especially with central banks apparently willing (and even anxious) to produce as much liquidity as is needed?
Let me provide a graphical answer to that question.
The chart below (source: Shiller and BLS) shows compounded 10-year inflation rates since the late 1800s.

Compounded inflation below 2% has been very rare since 1914, and the Fed is clearly leaning one way here.
I have drawn two lines on this chart. The vertical line indicates the date of the formation of the Federal Reserve; the horizontal line shows the current level of 10-year inflation breakevens (Treasury yields minus TIPS yields). Since the formation of the Federal Reserve, you can see that a 10-year period of inflation below 2% has been exquisitely rare, with the exception of the Depression when the Federal Reserve erred and tightened policy. So, if you are buying inflation below 2%, your realistic downside (especially with a Chairman who is acutely aware of the Fed’s failing in the Great Depression) over ten years is probably on the order of 50bps.[4]
The institution of the Federal Reserve created an institution whose purpose is to prevent deflationary depressions, and who has historically pushed prices higher – sometimes gently, and sometimes not so gently – over a long period of time. What may be surprising to see is how oftenwe have experienced periods of high inflation compared to episodes of tame inflation. While this histogram isn’t necessarily the purest way to address that question, since the periods overlap, it gives some sense for how frequent the “tails” of inflation are:
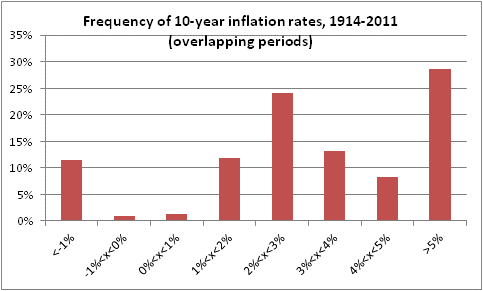
A frequency distribution breakdown of the previous chart (since 1914).
The maximum 10-year inflation rate was 8.8%, with about 30% of all observations above 5%. Note that these are not 1-year inflation numbers, but 10-year compounded inflation. The compounding matters. 2% compounded for 10 years is 21.9%. 8% compounded for 10 years is 115.9%.
This is what you’ll get if you own TIPS for 10 years. You’ll get the real yield of TIPS (currently negative out to 10 years) plus compounded inflation. If you think we can get 6% or 8% inflation, then the fact that the real yield is 0% instead of 1% isn’t that big a deal. But I would like to put on a trade that responds when inflation expectations themselves start to rise.
Deutsche Bank recently issued a pair of PowerShares exchange-traded notes (ETNs) that trade with the symbols INFL and DEFL. Information, and the prospectus, can be found at links here, here, and here. In full disclosure, I have bought some INFL for my own portfolio.
These instruments are an interesting way for retail investors to play for a potential increase in inflation expectations. The notes, which are issued by Deutsche and so are exposed to Deutsche Bank credit,[5] are designed so that they expect to rise $0.10 if inflation expectations rise 0.01% (1 basis point – I am here, and henceforward, speaking of INFL although the inverse holds for DEFL). So a 1bp rise in inflation expectations equals (if the security is at $50, as it is now) a 0.20% rise in the security’s price. Put another way, the buyer of INFL has roughly a 20 modified duration, which is pretty long for a bond-like instrument. The underlying index consists of 5-year, 10-year, and 30-year TIPS and short positions in 5-year Note, 10-year Note, and Ultra Treasury futures, in roughly the proportions TIPS are represented in the bond universe. The ETN also earns a T-Bill return and carries fees of 0.75% per annum.
The securities are supposed to maintain that 1bp=$0.10 relationship even as price rises and falls within some bounds, so that if INFL declines to $30, the modified duration rises to 33.
(Because this would eventually cause modified duration to head towards infinity as the price declines, the securities have a feature that causes the security to split if the price goes above $100 or reverse-split if the price goes below $25; however, the 1bp:$0.10 relationship would remain the same, so that if the price declines below $25 for a few days your modified duration will suddenly decline from 40 to 20; if the price rises above $100 your duration will go from 10 to 20. This is not necessarily a bad feature, since it means you will eventually get longer in a rally, but it isn’t analogous to normal convexity since with normal positive convexity you would get long in a rally, then less-long as price declined again. In this case, if price went to $100 and then reversed, you’d essentially have double the duration on the way down. So I suggest keeping a close eye on the ETN and being sure to adjust your exposure manually from time to time to remain within your risk tolerance. Having your exposure change via a split is also quintessentially unlike a normal equity’s behavior in a split, in which your exposure remains constant even though the number of shares doubles.)
There is a market-maker who presents orderly two-sided markets some $0.12 wide, or roughly 1.2bp on breakevens. That’s not bad at all – professional inflation traders don’t face markets much tighter than that. I don’t know the size commitment of the market-maker and have no direct knowledge of his dedication to maintaining these markets.
Are there warts to the structure? Sure. The weird ‘convexity’ is off-putting, although it can be managed. The float is currently smaller than I’d like (only $4mm each side at issue), although that’s true of any new ETF or ETN and I would expect it to increase over time. The use of futures instead of cash for the nominal position complicates analysis somewhat, although there is probably no easy way around it. There is an additional drag on return that comes from the financing of the long-TIPS position at LIBOR. Ordinarily, you would finance TIPS at the repo rate (about 20-40bps lower over time), and then you would earn a somewhat lower repo rate on the short Treasuries position. By selling futures, the repo rate earned on the bond short is embedded in the futures convergence, which makes it quite difficult to analyze the true total cost of the structure. The long-INFL investor earns T-Bills, plus implied repo on the futures position, minus Libor, minus fees. When T-bills are at zero and LIBOR at 0.20%, that plus the fees make the cost around 0.95% per annum. When T-Bills are at 1% and LIBOR at 1.30%, the net cost is essentially zero (1% + 1% – 1.30% – 0.75%). When T-Bills are at 2%, INFL should appreciate over time although that should be considered against your opportunity cost.[6]
Does Deutsche make money on the structure? Of course. But they make less they would with many structured notes, and these ETNs are, in my opinion, actually a useful way that retail investors can achieve a particular exposure. I don’t expect to hold this position until the ETNs mature, but with breakevens near 2% it is in my opinion a good way to bet on expectations rising over the next few months or years.
.
I appreciate that many of you have suggested to friends and colleagues that they follow this author – thank you very much! I also suspect that people you know may have concerns about inflation or be interested in learning more about inflation and hedging inflation, and that you can help them by introducing them to people who have something to say on the topic. I would appreciate your generous referral of these contacts of yours to our website, and would like to express my appreciation by sending a copy of my book, Maestro, My Ass!, to those of you who point people our way. (Please let your friends know that they should mention you when they fill out the contact form, so that I can know where to send my gift of thanks.) And thanks again.
[1] I say “probably” because although Fisher included the inflation risk premium in his work, it has never been clear to me why the provider of money would demand protection for the uncertainty of his real return while the user of money would not demand protection for the uncertainty of his real cost. To me, it isn’t clear which effect will dominate, and so I suspect it is entirely possible that the “inflation risk premium” can even be negative. We certainly see this phenomenon in some commodities futures curves. Anyway, since we can’t directly observe and separately trade the risk premium, it’s usually folded in with the breakeven.
[2] …unless there is sufficient deflation that the floor on the principal kicks in. This has never happened, but it adds a complexity to TIPS and requires that many statements about TIPS include the phrase “except if…”
[3] This fact leads some managers to make the false claim that “TIPS don’t hedge against inflation.” Of course they do. They hedge almost perfectly against inflation over the horizon from purchase to maturity. However, they do not hedge month-to-month or year-to-year inflation very well if they have a long time to maturity, because the short-term price change of the bond swamps the inflation accretion.
[4] Of course, past results are no guarantee of future returns. Anything can happen. 10-year inflation could go to -10%, or perhaps worse expectations could go to -10% even while inflation was rising, leading to a loss on the trade I’m about to mention. Consult your financial advisor.
[5] However, note that since the ETNs can be delivered in blocks to Deutsche on short notice, it is best thought of as short-term credit even though the notes themselves have a long maturity.
[6] I’m cuffing all of these relationships for the purposes of this column. The point is that right now the structure is about as expensive as it is going to be, and as rates rise INFL should have some positive net carry over time.
As We Snooze, We All Lose
Monday was another day of feeble volume in the markets, but at least today there was the excuse that there wasn’t any important economic data due out until Alcoa’s earnings announcement after the close (as expected, they lost money for the quarter but on better-than-expected sales). NYSE volume matched Friday’s paltry sum of around 675mm shares.
As the weak volume trend continues, it is growing more remarkable. It implies a lack of conviction, or indecision. How is this likely to resolve? Is it likely to resolve into conviction, and buying, or alarm/concern, and selling? My suspicion is that in the absence of a positive exogenous event, we are more likely to see weak longs get weak-kneed and equities to head lower.
But my personal conviction level on that topic is low. Volumes in other markets are also weak, so applying the same logic as I have just applied to equities would suggest all markets should head lower. While that is possible, it seems unlikely. It may simply be that we are moving to a ‘new normal’ (pardon the misappropriation of the expression) of lower volume and thinner market conditions. One market participant opined to me that the Fed’s recent announcement that it would substantially adopt the Basel III recommendations for bank regulations – it was expected that they would adopt some, but not all, of the restrictive regulations – has caused many banks to re-think the scale and scope of their U.S.-based operations and, in some cases, to pull back from business and market-making. This is not terribly shocking, except that the degree of this effect would be surprising if the current desiccation of volume continues.
Lower liquidity implies lower prices (there is a reason that they call it a ‘liquidity discount’), although probably not substantially in any particular asset class. But lower liquidity represents a loss of societal wealth and efficiency. Does this affect a retail investor? Yes, since it implies lower prices overall, but in terms of a noticeable effect on day-to-day trading, not much. But it will affect the retail investor through the return drag that larger mutual funds (for example) will experience. Large institutions already have complicated algorithms to efficiently enter and exit positions while minimizing market impact; less liquidity implies more market impact (which is a cost, although it shows up as return drag rather than a customer fee). None of this will cause retail investors to march on Washington, which is why it is being enacted even though society bears a cost for it.
Again, I don’t want to read too much into a few days of low-volume trading, but these are my thoughts as more of these days get strung together.
Heading into a potential crisis, by the way, is a bad time to be sucking liquidity (in the sense of transactional liquidity, not monetary liquidity) out of the market. Today Germany sold €3.9bln of 6-month TBills at a negative yield (-0.0122%); recall that happened in the U.S. in late 2008, so it’s not unprecedented. It is even rational: investors are taking a certain loss instead of some unknown probability of a substantial loss they might realize on bank deposits if a bank goes bust, especially if it goes bust in conjunction with a sovereign bankruptcy. The classic argument is that yields cannot be negative because cash has a zero yield, so the worst case is you hold cash. This works for you and me, but not Siemens or another huge company that doesn’t want to take hundreds of millions or billions of Euro notes. If such a company sees a 0.5% chance of losing 20% of the money they have on deposit, then they would happily own a German bill that yields as little as -0.10%. Or, if a company sees a 10% chance of losing 1% simply because their cash deposits are tied up in a bankruptcy and not accessible (or earning a return) for a while, the same reasoning applies. So it is not unthinkable that yields can be negative. It is, however, a harsh indictment on the state of the banking sector.
Speaking of Germany, a Barclays analyst appeared on CNBC today actually talking about the fact that inflation expectations are rising in Germany. He pointed to 5- and 10-year inflation breakevens and noted the chance of a ‘break higher’ in expectations. I don’t necessarily read this this chart (see below, source Bloomberg) quite as bullishly as he did, but it’s surprising to hear anyone talking about inflation in Europe these days, and no doubt inflation is not expensive, pretty much anywhere.
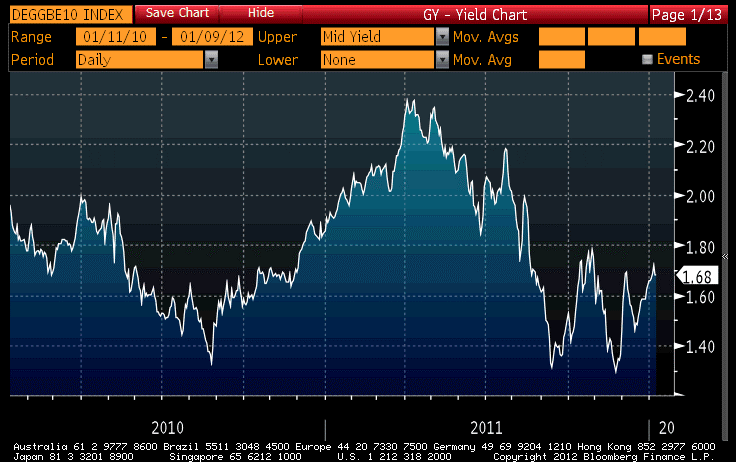
German 10-year breakevens. Certainly not expensive given the ECB's stance.
That’s not to say that I don’t think investors should be thinking and bracing for possible inflation. If there is a trade out there that looks relatively easy to me, it is being long breakevens. As I wrote last week,
It is incredible to me that with monetary conditions as accommodative, globally, as they have been in decades, inflation swaps are still nearly as cheap as they have ever been. That’s truly striking. What is the 10-year downside to a long inflation position from these levels? One-half percent per annum? Seventy-five basis points per annum? How low can inflation be over the next 10 years, especially with central banks apparently willing (and even anxious) to produce as much liquidity as is needed?
Commodities are still holding in, and that is one way to be long inflation. Commodity indices tend to have a high beta when inflation first begins to rise. However, one can also be long inflation expectations themselves. Institutional investors can do this through inflation swaps or breakevens, but retail investors can do this as well. On Wednesday, I will discuss a new exchange-traded security that allows investors to bet directly on inflation breakevens.
If you have not already done so, would you please help me gather some market information by taking a single-question anonymous poll, about your interest and/or willingness to buy certain kinds of hypothetical inflation-linked bonds linked to different things? The poll will take no more than two or three minutes, and I would really appreciate it. I’d also appreciate it if you would forward the poll link to your social networks and ask them to participate as well, since a bigger sample is usually better! The poll is here. Thank you very much!
Catching Up
On Thursday and Friday I was in Chicago, doing business but also attending the first day of the American Economic Association annual conference. Accordingly, I have a few things I need to catch up on in this article – but first, I want to point out something I observed on the agenda for the AEA. This is a very large conference, with literally thousands of economists (and other hangers on, like me) in attendance. There are roughly 500 sessions of around 2 hours apiece, and most of them consist of four speakers or paper presentations. So, roughly, there are maybe 1700-1800 papers presented at the conference.
Do you know how many I was able to find that involved research relating to inflation? The answer is zero or one, depending on whether you count “Internet Prices in the Great Recession,” which was a talk by the guys who developed the “Billion Prices Project” at MIT. What does that mean? I suspect it means that economists think inflation is a dead subject, with not much chance of becoming interesting, and/or they figure we already know everything we need to know about inflation. Neither could be more wrong, in my view.
There were still plenty of interesting sessions. One of the most-interesting and most-timely was a panel discussion by Peter Boone, Ken Singleton, and Carmen Reinhart (co-author of This Time Is Different: Eight Centuries of Financial Folly
Boone also predicted that “if the citizens of Europe decide they don’t trust the Euro, it will all collapse in inflation” (following the ECB’s large-scale purchase of bonds to save the market, which he said is really the only way out). He later pointed to Russia’s breakup as a good analogy, because each republic had its own central bank with the ability to print money. When people lost confidence in the ruble, the country ended up in inflation. Indeed, it was striking that all three discussants saw inflation, not deflation, as the likely result of an outcome that involved a Euro breakup and/or default. I will have more to report on this session sometime over the next few days…there is a lot to chew on.
.
So what happened while we were discussing sovereign default? Europe produced its first shudders of the new year. At a 12-month treasury bill auction on Thursday, Hungary failed to raise what it needed, even though it was offering almost 10%. The country was downgraded to junk by Fitch. The EU/IMF pushed back the schedule for Greek disbursements a full three months as they continue to negotiate the second €130 tranche of aid. The €5bln it was supposed to receive in December will instead show up in March, and the €10bln it was supposed to receive in March is now due in June. This is somewhat problematic because Greece has some big redemptions in the first quarter. But the bigger fear is that politicians in Europe are playing a dangerous game in trying to get a leg up on the negotiations.
Sovereign debt markets have not responded well to the turning of the calendar. French 10-year yields reached the highest level since the spike in November. Italian yields are back up over 7% (see Chart, source Bloomberg).

Italy isn't getting lots worse, but it is clearly not getting better either.
Meanwhile, Euro deposits at the ECB reached an all-time record of €455bln. In a way, this is good in that it implies the ECB hasn’t really been quantitative easing (yet) with its unprecedented provision of “unlimited” 3-year money. If the money is ‘stashed’ at the central bank, then what is happening in Europe is essentially what we saw in the U.S. with QE2 when the Fed paid banks to keep the extra liquidity in reserves. However, in this case banks explicitly borrowed at a higher rate for 3 years and then lent at a very low overnight rate. Why would a bank do this? Well, they might be just playing the yield curve, betting that rates will rise enough to turn a profit on the 3-year money, but I doubt that. They might be doing the equivalent trade, taking ECB money in lieu of raising overnight money that could be very expensive under conditions of stress; in that case, this exchange of 3-year money to overnight ECB deposits at a lower rate can be thought of as an insurance premium. Either way, the same issues apply to this transaction as applied to QE2: it is unclear how fast, or whether, this money leaks into the real economy; if it does, then the resulting inflation may be controlled or uncontrolled – and the ECB at that point will have nothing to do with it.
The key economic data point was the Employment Report, which was both better-than-expected and disappointing. It was better-than-expected in that the headline number was 200k, about 40k better-than-expected net of revisions, and the Unemployment Rate fell to 8.5% from a revised 8.7% last month. It was disappointing, though, because other jobs market data had given reason for optimism (not least, the 325k ADP number on Thursday, which I’d warned could suffer seasonal-adjustment issues). The participation rate is still at generational lows of 64.0%. And one of my favorite little-watched indicators, the number of people who are not considered in the labor force but nevertheless say they “want a job now,” remains at extremely high levels and is showing no signs of improvement (see Chart, source Bureau of Labor Statistics). So, while the jobs market is improving, it is too early I think to proclaimed it healed.
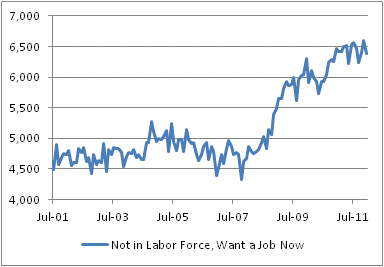
The employment picture is improving, but not enough for these guys.
While equity prices held Tuesday’s gains all the way through Friday, the volume story is beginning to get disturbing. Clearly, volumes weren’t low because investors were waiting to see Employment. Friday’s volume was actually the lowest of the week. It is very odd for an Employment day to be a low-volume day! The last time we saw NYSE composite volume above 1 billion shares, with the exception of triple-witching day on December 16th, was November 30th. Cumulative volume for the first four days of the year was 1 billion shares less than we saw during 2011’s first four days, and for comparison it was 4 billion shares less than the first four days of 2006 or 2007. This is not a healthy market, even if it did rise 1.6% in the first week. Maybe this is just part of the wall of worry it will climb, but if the army is storming the enemy position it would be more comforting if it brought a few more soldiers.
Inflation Swaps For The Long Run
After buying stocks ‘with both hands’ on Tuesday, investors went with a distinctly one-handed approach as stock indices ended mixed on even lighter volume. It is far too early to be deeply concerned about the lack of volume, but…it’s not too early to be a little concerned. Volume the first two trading days of 2012 is down 25% from the first two trading days of 2011, which itself was the lowest total in at least 5-10 years.
To be sure, there is little new information to warrant a shift of position in the new year if you were happy with your position in the old year. And the indices are still at the top of the ranges of the last five months, so perhaps investors are waiting for resolution before jumping on board. The more sinister interpretation is that Volcker rule restrictions are continuing to erode market makers’ ability to provide liquidity, as many of us have warned is a likely consequence of limiting market makers’ ability to ‘intermediate temporally’ by taking a position.
However, I suspect the quiescence is at least partly for the former reason. Website hits for my comment are down as well from the same period a year ago, which suggests fewer people are tuned in so far this year.
Commodities markets have enjoyed the beginning to 2012. Energy markets and industrial metals rallied today. Crude was only up a little, although there was a development that threatens to change the calculus for Iran. In Brussels, EU members agreed in principle on economic sanctions against Iran, crucially including an embargo on importing oil from that nation. If enacted, this significantly changes the balance of risks for Iran associated with closing the Straits of Hormuz. If they are not going to be exporting through the Straits, then there is much less economic cost to Iran to close the Straits. If they aren’t selling much oil anyway, then the actual act of closing the Straits carries only military risks – and perhaps not even that, if the regime doubts the determination of the White House. The EU still hasn’t put an embargo into place, and it may be implemented ‘gradually,’ but in my mind the probability of a conflict just went up meaningfully.
But again, it wasn’t just energy markets that rallied. And today, the dollar was stronger rather than weaker. Nominal interest rates rose again (10-year Treasuries now yield 1.99%), but TIPS rallied and inflation swaps increased as well. Moreover, it wasn’t just short-term inflation swaps, as would be the case if the market was pricing in a potential oil spike. 10-year inflation swaps are up about 10bps over 2 days to 2.365%. That’s still terribly low in the grand scheme of things, as the chart below (Source: Bloomberg) shows. Indeed, Fed officials cannot be blind to the fact that 10-year inflation expectations have only been appreciably lower in the 2008 crisis and in 2010 right before QE2 was ‘announced’ by Chairman Bernanke.

10y CPI swaps are much lower than average
It is incredible to me that with monetary conditions as accommodative, globally, as they have been in decades, inflation swaps are still nearly as cheap as they have ever been. That’s truly striking. What is the 10-year downside to a long inflation position from these levels? One-half percent per annum? Seventy-five basis points per annum? How low can inflation be over the next 10 years, especially with central banks apparently willing (and even anxious) to produce as much liquidity as is needed?
On Thursday, the ADP report (Consensus: 178k from 206k) for December is the keynote release. Initial Claims (Consensus: 375k vs 381k) makes it a rare labor-market double, but Claims for the last week of the year isn’t a particularly useful figure and should be ignored. The Non-Manufacturing ISM (Consensus: -46.0 vs -47.5) rounds out the pre-Employment data. Of these, ADP is clearly the most important, but traders will prefer to be conservative in interpretation of any outlier points. This is partly because there is some evidence that ADP suffers seasonal-adjustment problems in December and partly because just last month ADP significantly exceeded estimates and Employment was right on target. In still-thin trading conditions, and only one day to wait to get the ‘real’ data, traders will prefer to avoid making bets on ADP.
.
I have a favor to ask readers. Would you be so kind as to take a single-question anonymous poll, about your interest and/or willingness to buy certain kinds of “different” inflation-linked bonds? It will take no more than two or three minutes. This is the link to the poll. Thanks in advance!
New Year’s Revolutions
If it’s January 3rd, it must be time to buy with both hands, right?
Markets leapt higher today, led by commodities. In December, managers evidently pursued a policy of buying what had worked (bonds, inflation-linked bonds) and selling what had not worked (commodities), but with a new year and a new P&L statement the money is springing back to where the opportunities are. And, while equities are not completely unattractive – they rallied today probably because that’s just what they do on Jan 3rd – in my view commodity indices are the most attractive, as I pointed out in my article “Long-Term Portfolio Projections Update” late in December.
To be sure, the increasing volume of saber-rattling in Iran helped put a bid in energy products. The Iranian regime warned U.S. warships to stay away from the Straits of Hormuz while Iran was conducting exercises, saying that they “will not repeat its warning,”while the U.S. responded that “deployment of U.S. military assets in the Persian Gulf region will continue as it has for decades.” Oil prices leapt more than $4/bbl to the highest WTI closing level since May of last year. But it would be a mistake to think that the movement in commodity indices was all about Hormuz. Agriculture was up more than 2%, Energy up 3%, Precious Metals up 4%, and Industrials and Livestock up more than 0.7%. No commodity in the DJ-UBS index declined.
Manufacturing data was decent, both the ISM (which rose to 53.9 from 52.7) as well as purchasing managers’ indices from Italy, France, Germany, and the UK, which all exceeded – albeit slightly – expectations.
Let us not forget that all of these PMIs, with the exception of the US, are also below 50. And let us also not be tricked into thinking that strong equity markets indicate that all is well with the world. This morning, a spokesman for Greece went on television to say that if Greece and the Euro Zone don’t reach an agreement on the second tranche of the bailout (some €130bln, due in March) quickly, the country will fail. Specifically, Greece would leave the Euro:
“The bailout agreement needs to be signed,” he said. “Otherwise, we will be out of the markets, out of the euro. The situation will be much worse.”
Strikingly, investors ignored this suicide threat today, but I wonder if they can continue to ignore it interminably. If everyone truly believes what the banks are saying, that a Euro breakup would be the end of organized cellular life on this planet, then Greece basically can get whatever it wants. Frankly, right now Greece and Iran share strikingly similar positions. Both can probably do what they are threatening, and so there are three questions for economic or military policymakers. (1) Do we really think the consequences are so devastating as they say? (2) Will Greece/Iran be willing to accept the consequences of their own actions, if they choose that path? And (3) given the answers to those two questions, can we bear the risk of finding out? With Iran, the answers are probably ‘no,’ ‘maybe,’ and ‘yes,’ but I am not as sure of the answers to the same three questions with Greece. Moreover, my answers would very likely be different from those of economic policymakers in Europe!
And, speaking of policymakers, the main economic event for Tuesday was the release of the FOMC minutes from the December meeting. There were some interesting tidbits in these minutes, which isn’t always true. Bond investors blanched at this phrase:
With regard to the forward guidance to be included in the statement to be released following the meeting, several members noted that the reference to mid-2013 might need to be adjusted before long.
However, it isn’t clear from the minutes exactly what that means. It may mean that, as bond investors feared, the Fed will ‘adjust’ the reference by shortening it, but this seems unlikely in the context (and because it would weaken the credibility of Fed communications if ‘at least’ turned out to mean ‘at least, maybe’). It probably means that the FOMC figures they need to eventually change to a more-vague goal, or roll the guarantee forward in some way, lest they converge on mid-2013 and be confronted with the same decision at a period of much more significance. This is one of the reasons it was dumb to make the guarantee in the first place, but policymakers apparently didn’t fully think through the ‘exit’ step.
The Fed in early December remained quite cheerful about inflation:
Inflation continued to decrease relative to earlier in the year. Indeed, the PCE price index edged down in October… Consumer prices excluding food and energy also continued to rise at a more modest pace in October than earlier in the year.
Recall that October’s figure on inflation, which the FOMC had at the time, had been a downside surprise. This may have contributed to the Committee’s optimism. But subsequent data on November prices, after the FOMC meeting was completed, showed an upside surprise in core inflation. (I discuss the release in “The Inflation Trend Is Not Yet ‘Tamed’”.)
The FOMC was more than happy to extrapolate the stabilizing and decline in headline inflation, and the brief stabilization in core. This is bad science even though it passes for okay economics in some schools: since new data can only cause a rejecting of existing hypotheses, there is no reasonable way that a one- or two-month slowing in core inflation should have caused the FOMC such elation:
Most participants anticipated that inflation would continue to moderate…Indeed, some expressed the concern that, with the persistence of considerable resource slack, inflation might run below mandate-consistent levels for some time.
Fortunately, some intelligent people were in the room too, and pointed out the incongruity of expecting resource slack to lower inflation when it clearly hasn’t done that in the last couple of years:
However, a couple of participants noted that the rate of inflation over the past year had not fallen as much as would be expected if the gap in resource utilization were large, suggesting that the level of potential output was lower than some current estimates.
Policymakers saw a lot of risk from global financial strains, and “a number” of them saw that there may be a need to ease further. Again, all of this happened before the ‘surprising’ continuation in the core inflation uptrend was made evident, so the doves may be more hawkish now. Somehow, I doubt it though.
There was also much-anticipated development in the Fed’s “communication strategy” (I can remember when they didn’t really feel they needed communication, much less a strategy). The plan at present seems to be for Members of the FOMC to publish their projections of the Fed Funds rate along with their projections of growth and inflation in the four-times-annually “Summary of Economic Projections” (SEP). This is also a bad idea, but it’s going to happen despite the adroit observation of some participants:
Some participants expressed concern that publishing information about participants’ individual policy projections could confuse the public; for example, they saw an appreciable risk that the public could mistakenly interpret participants’ projections of the target federal funds rate as signaling the Committee’s intention to follow a specific policy path rather than as indicating members’ conditional projections for the federal funds rate given their expectations regarding future economic developments.
Yes, that’s just one way in which giving this additional information has more downside than upside, but it continues a long-standing trend at the Fed towards “openness,” which is perceived to be a good but no one ever seems to actually analyze the costs and benefits. (As an aside, it illustrates the power of words. If instead of saying ‘the Fed increased its commitment to openness’ I said ‘the Fed decided to show how well or poorly it forecasts by leaking those forecasts’, we wouldn’t automatically agree that is a good thing. But the current policy is only different in that a ‘leak’ is awkward and potentially damaging information that was not supposed to be released, and this is awkward and potentially damaging information that is supposed to be released.)
On Wednesday, there is only light data being released as the ADP report has been moved to Thursday. For all the fury of today’s 1.6% rally in stocks, it was the worst NYSE composite volume for the first trading day of the year in at least a decade. Last year, 166 trading days saw less than 1bln shares traded on the NYSE. The year before, there had been 113 such trading days; in 2009 only 35. In 2011, it wasn’t until February 14th that we had a day with volume as light as it was today. That probably means that volume will grow over the next few days. But it’s just not a great way to start off a year reaching to higher prices. Now, in 2011 stocks rallied for the first six weeks of the year, hitting a high for the first quarter in … hey, look at that!…the week of February 14th.
