Archive
Two Important Changes Coming to the CPI
There are a couple of potentially important changes to the CPI that will take effect in the next few months. It is worth thinking about how these will affect the data.
- Sometime in “Spring 2018,” the BLS will reweight the physicians’ services index, which includes consumer out-of-pocket, Medicare Part B, and private insurance reimbursements, to better reflect the current market weights of various payer types.
This matters, because the ACA (nee Obamacare) caused a large shift in where payments were coming from, and one effect of that shift was to obfuscate actual inflation in medical care. Because CPI only includes payments that consumers make, and not the ones that government provides (Medicare Part A, Medicaid), large changes in the coverage population and the significant change in deductibles caused Medical Care inflation to do things that really didn’t make a lot of sense. We know that total spending on health care grew sharply under Obamacare as Medicare, Medicaid, private health insurance, and out-of-pocket spending all rose, but medical care inflation as measured by CPI sharply decelerated over the last 15 months. It isn’t because health care is suddenly more affordable; it’s because large change in the way medical care is paid for was bound to cause large change in the measurement of medical care. It is likely that reweighting this index to current weights will cause better stability in this measure – but at a higher level than the recent 1.7% rate. Since Medical Care is the main thing holding down core PCE, this will likely make the optics worse over the next year (and see what I have already said about the optics).
- With January 2018 data, CPI for used cars and trucks will change from a three-month moving average to a single-month price change. The BLS says “This modification will result in an index that reflects price change closer to the reference period.”
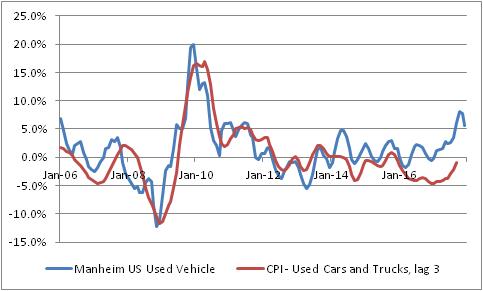
This matters, because as I’ve been pointing out over the last few months the CPI for used vehicles is quite a bit below where private surveys of used car prices suggest it should be. The recent rise in used car prices is happening largely because Hurricane Harvey removed hundreds of thousands of vehicles from the road, but the BLS measure has been lagging behind the private measure of these prices. This is one of those effects that is expected to make the CPI optics worse in 2018, and this change could make it worse, faster. If CPI measures of car inflation merely converge with the blue line below, it’s worth about 0.5% on core inflation. Moving to a 1-month, rather than a 3-month measure will make this more volatile, but also will make it converge more quickly. Indeed, it makes this month’s CPI report even more interesting and creates a chance for a significant surprise higher as soon as this month.
Global Inflation: the Worm Finally Turns
Approximately nine years ago, I founded a company specializing in developing new ways to invest in and hedge against inflation. I originally had two partners; one left after a few months and the other lasted a year before heading back to a Wall Street job. (I think leaving after 3 months of trying a startup was a little sporty, but I don’t begrudge the partner who stuck it out for a full calendar turn and then some.)
The last nine years have been a difficult time to be developing and marketing inflation expertise. While we conceived the firm as having strategic positioning on inflation protection – whether inflation is going up or down, inflation risk is always there to be managed…and we are all born inflation-exposed, and remain so unless we do something about it – I confess that I underestimated how hard of a pitch that would be to investors who haven’t seen core inflation above 3% for two decades. Unless you have a certain amount of grey hair, you think 3% is high inflation, but that’s not really high enough to damage most asset markets. So why bother?
But times, they are a changin’ back (as Bob Roberts famously sang). Average core inflation around the world is near the highest levels since the 1990s. The chart below shows the unweighted average of the US, Europe, Japan, the UK, and Chinese core inflation (using median for the US, which is a better measure). While the average of 1.7% or so is nothing to be terrified about, it also should be noted that there is nothing evident on the horizon that would tend to arrest this rising trend.

While money supply growth has been slowing gradually around the world, monetary conditions are not likely to seriously tighten until banks are no longer sitting on a mountain of excess reserves. In the meantime, higher interest rates will tend to cause money velocity to rise because velocity is the inverse of the demand for real cash balances – in English, that means that when interest rates are low, you’re happy to hold cash balances but when interest rates rise, cash becomes a hot potato to be invested, spent, or lent rather than sitting in cash. It is no coincidence that both global money velocity and global interest rates are both at or near all-time lows. However, interest rates seem to be going higher – seemingly nowhere faster than in the US, where the 5y Treasury rate has risen about 80bps in the last five months and is at 8-year highs. In turn, that means money velocity is very likely to rise, and any rise at all makes it harder to have an agreeable mix of growth and inflation.

You can subscribe to my live tweets on the monthly CPI day and see why, but not only is domestic inflation rising but the optics this year are going to be much worse for policymakers and investors focused on core inflation. In 2015-16, core inflation accelerated about ¾% to catch up with median CPI; this year the rise is going to be at least that much just from the effect of cell phones and cars. My point forecast for median CPI in 2018 – I hate point forecasts, but to illustrate that I’m mainly talking about optics in 2018 – is for an 0.25% acceleration in median CPI. But core CPI may rise a full percent because of the transitional pieces that are falling out of the y/y number. And that assumes that protectionist rumblings don’t get any louder than they currently are.
In 2015-16, breakevens actually didn’t respond much because investors didn’t believe in the underlying dynamics. They do today, as global inflation swaps (see chart below) are on the rise everywhere except in the UK, where the post-Brexit spike is fading some. Even in Japan! I don’t know where the flows will take us, but the combination of the general inflation uptrend, the optics, the flows, the fact that TIPS are still about 35bps cheap compared to nominal bonds (although down from about 100bps cheap 18 months ago), and the fact that gasoline prices are probably going to make headline inflation look even worse than core all come together to create the possibility of a pretty unfortunate spike in inflation markets. Unfortunate, that is, for owners of stocks and bonds.

Over the last nine years, I have spent a lot of time watchfully waiting, working on product development (this index launched last year by S&P, representing a tuition tracking strategy that we hope will result in new college tuition hedging products, is going to be one of our biggest successes), nurturing the slow growth of the firm, and positioning Enduring Investments to be relevant when inflation heads higher.[1] As the years have passed, I have written less frequently because there wasn’t much to say.
There is, now, starting to be more to say. Inflation is headed higher at least for now, and I am seeing more inquiry from investors curious about how to play it. You can expect to hear more from me, because what I am saying is more urgent than it was. And I’d like to hear from you, too…especially if we can help.
[1] And I should note that we are offering small interests in the firm itself to accredited investors, in a so-called 506(c) offering that is ongoing. Contact me if you are an accredited investor who wants to know more.
Why Commodities Are a Better Bet These Days
Don’t you want to follow my private Twitter channel, where these articles appear first and the only place you can get my real-time CPI report analysis on CPI day? You can do so for only $10 per month at PremoSocial here.
It’s been a long time since an article about commodities felt like ‘click bait.’ After all, commodity indices have been generally declining for about seven years – although 2016 saw a small advance – and the Bloomberg Commodity Index today sits 63% below its all-time high set in the summer of 2008. I’ve written before, quite a bit, about this absurdity of the market, represented in the following chart comparing one real asset (equities) to another real asset (commodities). The commodity index here is the Bloomberg spot index, so it does not include the drag (boost) from contango (backwardation).

This is the fair comparison for a forward-looking analysis. Some places you will see the commodity index plotted against the S&P, as below. Such a chart makes the correct inference about the historic returns to these two markets; the prior chart makes a more poignant point about the current pricing of stocks versus commodities.
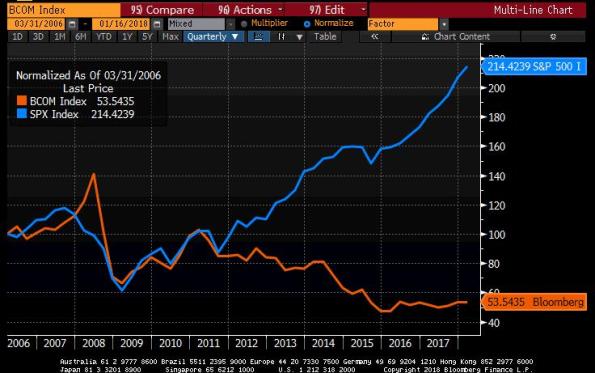
There’s nothing that says these two markets should move in lock-step as they did from 2003-2007, but they ought to at least behave similarly, one would think. So it is hard to escape the reasoning that commodities are currently very cheap to equities, as one risk-asset to another.
Furthermore, commodity indices offer inflation protection. Here are the correlations between the GSCI and headline inflation, core inflation, and the change in those measures, since 1970 and 1987 respectively.

Stocks? Not so much!

So, commodities look relatively cheap…or, anyway, they’re relatively cheaper, having gone down for 7 years while stocks went higher for 7 years. And they give inflation protection, while stocks give inflation un-protection. So what’s not to like? How about performance! The last decade has been incredibly rough for commodities index investors. However, this is abnormal. In a watershed paper in 2006 called Facts and Fantasies about Commodity Futures, Gorton and Rouwenhorst illustrated that, historically, equities and commodity futures have essentially equivalent monthly returns and risks over the period from 1959-2004.
Moreover, because the drivers of commodity index returns in the long run are not primarily spot commodity prices[1] but, rather, the returns from collateral, from roll or convenience yield, from rebalancing, and from “expectational variance” that produces positive skewness and kurtosis in commodity return distributions,[2] we can make some observations about how expected returns should behave between two points in time.
For example, over the last few years commodities markets have been heavily in contango, meaning that in general spot prices were below forward prices. The effect of this on a long commodity index strategy is that when futures positions are rolled to a new contract month, they are being rolled to higher prices. This drag is substantial. The chart below shows the Bloomberg Commodity Index spot return, compared to the return of the index as a whole, since 2008. The markets haven’t all been in contango, and not all of the time. But they have been in serious contango enough to cause the substantial drag you can see here.

So here is the good news. Currently, futures market contango is the lowest it has been in quite a while. In the last two years, the average contango from the front contract to the 1-year-out contract has gone from 15% or so to about 2% backwardation, using GSCI weights (I know I keep switching back and forth from BCOM to GSCI. I promise there’s nothing sinister about it – it just depends what data I had to hand when I made that chart or when it was calculated automatically, such as the following chart which we compute daily).

That chart implies a substantial change in the drag from roll yield – in fact, depending on your weights in various commodities the roll yield may currently be additive.
The other positive factor is the increase in short-term interest rates. Remember that a commodity index is (in most cases) represents a strategy of holding and rolling futures contracts representing the desired commodity weights. To implement that strategy, an investor must put up collateral – and so an unlevered commodity index return consists partly of the return on that particular collateral. It is generally assumed that the collateral is three-month Treasury Bills. Since the financial crisis, when interest rates went effectively to zero in the US, the collateral return has approximated zero. However, surprise! One positive effect of the Fed’s hiking of rates is to improve projected commodity index returns by 1.5-2% per year (and probably more this year). The chart below shows 3-month TBill rates.

I hope this has been helpful. For the last 5 years, investing in commodities was partly a value/mean-reversion play. This is no longer so true: the change in the shape of the futures curves, combined with rising interest rates, has added substantially to the expected return of commodity indices going forward. It’s about time!
[1] This is a really important point. When people say “commodities always go down in the long run because of increased production,” they’re talking about spot commodity prices. That may be a good reason not to own spot gold or silver, or any physical commodity. Commodity spot returns are mean reverting with a downward slant in real space, true. But a commodity index gets its volatility from spot returns, but its main sources of long term return are actually not terribly related to spot commodities prices.
[2] In other words while stocks “crash” downwards, commodities tend to “crash” upwards. But this isn’t necessary to understand what follows. I just want to be complete. The term “expectational variance” was coined by Grant Gardner.
Summary of My Post-CPI Tweets (Jan 2018 – Dec figure)
Below is a summary of my post-CPI tweets. You can (and should!) follow me @inflation_guyPV and get this in real time, by going to PremoSocial. Or, sign up for email updates to my occasional articles here. Investors with interests in this area be sure to stop by Enduring Investments or Enduring Intellectual Properties. Plus…buy my book about money and inflation. The title of the book is What’s Wrong with Money? The Biggest Bubble of All; order from Amazon here.
- 22 minutes until CPI. Not sure I am looking forward to this one. The little birds are all whispering that this is supposed to be high, and that concerns me.
- Not the economists: consensus forecast is for a reasonably high 0.24% on m/m core. But we drop off 0.22% from last December so the y/y won’t move much from 1.7% if that’s the print we get.
- Yes – there are lots of reasons this COULD be higher. Chief among them is the divergence between surveys of used car prices and the BLS cars index. Cars are 6.4% of CPI, so it matters. But PPI showed weakness in vehicles for another month. (I usually ignore PPI, though).
- ..it’s December, which means it’s crazy-seasonal-adjustment month. December is the only month of the year where you can confidently reject the hypothesis that there’s no seasonal (on headline CPI), as prices tend to fall. But there’s also a lot of volatility.
- Rents have come back to model, and home prices continue to rise, so decent chance that housing starts to contribute again here soon.
- What I fear is that some of the forecasts for a “surprise” higher are coming from the fact that the inflation markets have been rallying, so people are afraid “someone knows something.” Economists don’t ignore markets. But in this case I think it’s just year-end reassessment.
- …let’s face it, inflation bonds are cheap. About 50bps cheap at the 10-year point by my model. Commodities are cheap. And everything else is expensive. I don’t have to believe inflation is coming to swap out of stocks into commodities.
- Of note – inflation swaps have been rising in every major market recently. So there definitely is an undercurrent of inflation concern.
- Don’t fade the whispers! +0.3% on core. Actually 0.277%. But enough to put y/y up to 1.77%, rolling it to 1.8% rounded.
- Wow, 2 yr Tsy above 2% for the first time since September 2008!
- Last 12 CPIs. Try hard not to see an uptrend here. It’s an illusion caused by the low mid-year figures. But that said, this is highest in a while.

- Let’s see…Housing up slightly, Transportation up, no change in medical care (talking major subgroups here)…will be interesting to see where the wiggle is.
- Core services 2.6% vs 2.5% and core goods -0.7% vs -0.9% y/y. That’s the least goods deflation since last July. But it’s still deflation.
- Pulling in the micro data now. The BLS series is so rich. But while the sheet is calculating this is a good time to remind everyone that these figures are for DECEMBER so try hard not to get too excited. The breakdown will be more important to tell us if this is ‘real.’
- If you haven’t read Ben Inker’s piece in the latest GMO quarterly, arguing why inflation is a bigger risk for portfolios right now than recession, do so. Very good piece. “What happened to inflation? And What happens if it comes back?” https://www.gmo.com/docs/default-source/research-and-commentary/strategies/gmo-quarterly-letters/what-happened-to-inflation-.pdf?sfvrsn=5
- One more item of context before we dive deeper: Median CPI is at 2.3%. So we should be expecting something right around 0.2% per month if there’s no trend. The uptick from 1.7% to 1.8% is just catching up, mostly.
- OK on the breakdown. New and Used cars, 8% of core CPI, rose to -0.33% from -1.05%. As expected, and that’s a big part of the surprise.
- I say “surprise,” but it really oughtn’t be a surprise. Remember that Hurricane Harvey had a similar effect to Cash for Clunkers in terms of the number of cars removed from the road. The private car prices indices were showing this. BLS has a lot of catching up yet.

- Just lost power. Anyway. Wasn’t just used cars. Used cars went from -2.1% to -0.99% but new went from -1.08% to -0.53%
- Owners Equivalent Rent went to 3.175% from 3.124%, and primary rents from 3.675% to 3.689%. So housing back on track.
- Medical Care broadly went to 1.78% from 1.68%. Pharma went 1.87% to 2.37%. Other components pretty stable (in medical). Medicinal drugs (pharma) is about one fifth of medical care subindex.
- Wireless telephone services again steady. The jump will be fun when the plunge washes out. Right now it’s -10.19% y/y vs -10.24%.
- Wish I could post my chart of distributions of price changes. Left tail starting to move rightward a bit. Hopefully get power back soon. This is all on backup power to my pc. [Editors’ Note – I added it later, see below]
- Well, looks like power isn’t coming back on quickly. I will have to come back later with the median CPI estimate etc. Got most of the details out though.
- Bottom line is that the components we expected to start converging, did. Housing behaved. Medical care behaved. And so we moved towards the real middle of the distribution, around 2.3% or so presently.
- This shouldn’t be taken as an acceleration in inflation. This is just one (flawed) number converging with the better ones. Core inflation is going to head higher, but this isn’t convincing evidence that it is yet doing so.
- Having said that, in a couple of months the y/y comps start to get better so the inflation story will have much better OPTICS. And it’s optics these days, more than fundamentals, that drive markets. So don’t jump off the commodities or tips bandwagon. That trend will continue.
- Power’s back on! Of note is that Median CPI printed at 0.29%, the highest level since July 2008 (sound familiar? That was also true two months ago when it was 0.27%). So y/y up to 2.44% now.
- Yeah, I know I said don’t think of this was an uptrend. And it’s not; it’s an unwind of one-offs. But still, that’s gotta look scary.

- Better late than never. Here’s what I meant about the distribution moving right. Those two bars on the left were one bar before today. So you can see those components – largely cars and cell phones – are dragging down core relative to median.

- The rally in breakevens shouldn’t be terribly surprising – this chart shows it’s just keeping pace (and not even) with the turn back higher in median CPI.

- The market is NOT AT ALL ahead of itself in this sense.
This was certainly not the easiest time I have had with a CPI report, but that’s mostly because the power grid in this country is as brittle as glass. The story was actually not as much about screwy seasonal as I was concerned about. Actually, it was a fairly humdrum report in many ways, and that’s what is scary if you’re thinking we are in a “lowflation” period. The chart of Median CPI is interesting. Core inflation had risen mostly because car prices are starting to catch up with private measures of car prices – what remains in the gap between the red line and the blue line in the “Manheim” chart would add about 0.5% to core CPI – and housing stopped decelerating. But then Median CPI, which doesn’t care about the New and Used car prices since those are outliers, rose at the highest rate (m/m) in nearly a decade, and the Median-Core spread actually widened slightly this month. That means more core acceleration is ahead.
I mentioned that in a few months the year-ago comparisons will start getting easier. This month, we got 0.28% from core CPI versus 0.22% last year. But in Jan 2017, core CPI was +0.31%. That will be a hard comp to beat. But after that, Feb 2017 was +0.21%, March was -0.12%, April was +0.07%, May was +0.06%, June was +0.12%, and July was +0.11%. At the time, we mused “is the natural run rate for core really 0.5%/annum?” which was what those five months were averaging. That seemed very unlikely. Median CPI told us that wasn’t the case. Now, if core CPI merely averages a monthly 0.17% print from now until July, the y/y figure will be up at 2.20%. And if it’s 0.2% per month, in July we will be sitting at 2.42%.
I don’t think you want to fade those optics, even if you think we’re only going to get 0.15%. Perhaps the next month or two, because of the more-difficult comps, will take some wind out of the sails of the inflation bulls and offer better entry points. But the direction of travel looks fairly clear for the next six months or so. And that also means that the direction of travel for monetary policy is also likely set, to be at least as aggressive as the market is pricing. And, perhaps, the direction of travel for equity prices isn’t quite as clear as it currently seems.
And it bears repeating that this is going to be the case even if inflation is not actually in an uptrend, but just maintaining its current run rate around 0.2% per month (commensurate with median CPI at 2.4%/yr). If inflation is in fact turning higher – and there are some signs of that, though not as widespread as everyone seems to suddenly think – then it could be a lot uglier in 2018. As I said again above: don’t jump off the commodities or TIPS bandwagon yet. But…you might want to trim some of that nominal bond exposure!
Point Forecast for Real Equity Returns in 2018
Point forecasts are evil.
Economists are asked to make point forecasts, and they oblige. But it’s a dumb thing to do, and they know it. Practitioners, who should know better, rely on these point forecasts far more than they should. Because, in economics and especially in markets, there are enormous error bars around any reasonable point forecast, and those error bars are larger the shorter-term the forecast is (if there is any mean-reversion at all). I can no more forecast tomorrow’s change in stock market prices than I can forecast whether I will draw a red card from a deck of cards that you hand me. I can make a reasonable 5-year or 10-year forecast, at least on a compounded annualized basis, but in the short term the noise simply swamps the signal.[1]
Point forecasts are especially humorous when it comes to the various year-end navel-gazing forecasts of stock market returns that we see. These forecasts almost never have fair error bars around the estimate…because, if they did, there would be no real point in publishing them. I will illustrate that – and in the meantime, please realize that this implies the forecast pieces are, for the most part, designed to be marketing pieces and not really science or research. So every sell-side firm will forecast stock market rallies every year without fail. Some buy side firms (Hoisington springs to mind) will predict poor returns, and that usually means they are specializing in something other than stocks. A few respectable firms (GMO, e.g.) will be careful to make only long-term forecasts, over periods of time in which their analysis actually has some reasonable predictive power, and even then they’ll tend to couch their analysis in terms of risks. These are good firms.
So let’s look at why point forecasts of equity returns are useless. The table below shows Enduring’s year-end 10-year forecast for the compounded real return on the S&P 500, based on a model that is similar to what GMO and others use (incorporating current valuation levels and an assumption about how those valuations mean-revert).[2] That’s in the green column labeled “10y model point forecast.” To that forecast, I subtract (to the left) and add (to the right) one standard deviation, based on the year-end spot VIX index for the forecast date.[3] Those columns are pink. Then, to the right of those columns, I present the actual subsequent real total return of the S&P 500 that year, using core CPI to deflate the nominal return; the column the farthest to the right is the “Z-score” and tells how many a priori standard deviations the actual return differed from the “point forecast.” If the volatility estimate is a good one, then roughly 68% of all of the observations should be between -1 and +1 in Z score. And hello, how about that? 14 of the 20 observations fall in the [-1,1] range.

Clearly, 2017 was remarkable in that we were 1.4 standard deviations above the 12/31/2016 forecast of +1.0% real. Sure, that “forecast” is really a forecast of the long-term average real return, but that’s not a bad place to start for a guess about next year’s return, if we must make a point forecast.
This is all preliminary, of course, to the forecast implied by the year-end figures in 2017. The forecast we would make would be that real S&P returns in 2018 have a 2/3 chance of being between -10.9% and +11.1%, with a point forecast (for what that’s worth) of +0.10%. In other words, a rally this year by more than CPI rises is still as likely as heads on a coin flip, even though a forecast of 0.10% real is a truly weak forecast and the weakest implied by this model in a long time.
It is clearly the worst time to be invested in equities since the early 2000s. Even so, there’s a 50-50 chance we see a rally in 2018. That’s not a very good marketing pitch. But it’s better science.[4]
[1] Obligatory Robert Shiller reference: his 1981 paper “Do Stock Prices Move Too Much to be Justified by Subsequent Changes in Dividends” formulated the “excess volatility puzzle,” which essentially says that there’s a lot more noise than signal in the short run.
[2] Forecasts prior to 2009 predate this firm and are arrived at by applying the same methodology to historical data. None of these are discretionary forecasts and none should be taken as implying any sort of recommendation. They may differ from our own discretionary forecasts. They are for illustration only. Buyer beware. Etc.
[3] The spot VIX is an annualized volatility but incorporating much nearer-term option expiries than the 1-year horizon we want. However, since the VIX futures curve generally slopes upward this is biased narrow.
[4] And, I should hasten point out: it does have implications for portfolio allocations. With Jan-2019 TIPS yielding 0.10% real – identical to the equity point forecast but with essentially zero risk around that point – any decent portfolio allocation algorithm will favor low-risk real bonds over stocks more than usual (even though TIPS pay on headline CPI, and not the core CPI I am using in the table).