Archive
Two Important Changes Coming to the CPI
There are a couple of potentially important changes to the CPI that will take effect in the next few months. It is worth thinking about how these will affect the data.
- Sometime in “Spring 2018,” the BLS will reweight the physicians’ services index, which includes consumer out-of-pocket, Medicare Part B, and private insurance reimbursements, to better reflect the current market weights of various payer types.
This matters, because the ACA (nee Obamacare) caused a large shift in where payments were coming from, and one effect of that shift was to obfuscate actual inflation in medical care. Because CPI only includes payments that consumers make, and not the ones that government provides (Medicare Part A, Medicaid), large changes in the coverage population and the significant change in deductibles caused Medical Care inflation to do things that really didn’t make a lot of sense. We know that total spending on health care grew sharply under Obamacare as Medicare, Medicaid, private health insurance, and out-of-pocket spending all rose, but medical care inflation as measured by CPI sharply decelerated over the last 15 months. It isn’t because health care is suddenly more affordable; it’s because large change in the way medical care is paid for was bound to cause large change in the measurement of medical care. It is likely that reweighting this index to current weights will cause better stability in this measure – but at a higher level than the recent 1.7% rate. Since Medical Care is the main thing holding down core PCE, this will likely make the optics worse over the next year (and see what I have already said about the optics).
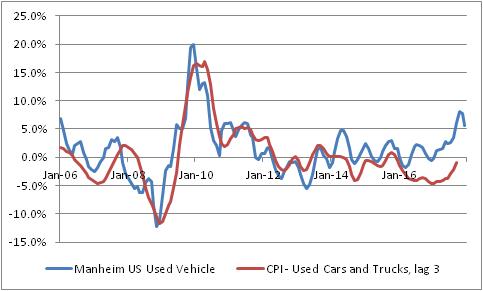
- With January 2018 data, CPI for used cars and trucks will change from a three-month moving average to a single-month price change. The BLS says “This modification will result in an index that reflects price change closer to the reference period.”
This matters, because as I’ve been pointing out over the last few months the CPI for used vehicles is quite a bit below where private surveys of used car prices suggest it should be. The recent rise in used car prices is happening largely because Hurricane Harvey removed hundreds of thousands of vehicles from the road, but the BLS measure has been lagging behind the private measure of these prices. This is one of those effects that is expected to make the CPI optics worse in 2018, and this change could make it worse, faster. If CPI measures of car inflation merely converge with the blue line below, it’s worth about 0.5% on core inflation. Moving to a 1-month, rather than a 3-month measure will make this more volatile, but also will make it converge more quickly. Indeed, it makes this month’s CPI report even more interesting and creates a chance for a significant surprise higher as soon as this month.
Summary of My Post-CPI Tweets (July 2017)
Below is a summary of my post-CPI tweets. You can (and should!) follow me @inflation_guy or sign up for email updates to my occasional articles here. Investors with interests in this area be sure to stop by Enduring Investments. Plus…buy my book about money and inflation. The title of the book is What’s Wrong with Money? The Biggest Bubble of All; order from Amazon here.
- quick CPI review: last 3 months have been -0.12%, +0.07%, and +0.06% on core CPI – that is, basically flat.
- three months before that were 0.22%, 0.31%, and 0.21%. Basically a 3% annualized rate. Which of these is “right”?
- Market has become convinced something around the current 1.75% average is “right.” But we’ve had big misses both sides.
- Consensus for today is for 0.2% on core, 1.7% y/y, but that’s a very narrow range. Basically 0.15% m/m gets both of those.
- If we get 0.16%, then y/y should round up to 1.8% y/y. If we get 0.14%, then m/m rounds down to 0.1%.
- Of course, recent months have shown us something wildly different is possible!
- core CPI 0.119%, again below consensus…y/y drops to 1.71%.
- This is closer to the summer lull we’ve seen recently. But still low. Here are the last 12 months of core CPI.

- That chart is weird, looks like there was a dramatic effect in March that’s wearing off. But it’s actually been a series of one-offs.
- Core services at 2.5% y/y, down from 2.6% (and down from 3.1% as recently as Feb). Core goods -0.6%, up from -0.8%.
- Core CPI ex-shelter was basically unchanged at 0.6% y/y, matching 13-year lows.

- Owners Equiv Rent was +3.23% y/y, Primary Rents 3.86% vs 3.85%. So the low print isn’t main part of housing.
- But housing overall – the major subgroup – decelerated to 3.02% from 3.12%. So that deceleration is elsewhere.
- Medical Care CPI was unchanged at 2.66% y/y.
- Pharma inflation 3.31% from 3.34%. Professional Services 0.58% from 1.0%. But hospital services 5.65% from 4.95%.
- This chart is physician’s services. I’m really curious about this.

- An optimist could say ‘this is b/c high deductibles under Ocare force consumers to negotiate aggressively with doctors.”
- Pessimist: “even if that’s true, it means fewer doctors tomorrow, ergo higher prices.” & where is this effect in hospital prices?
- I don’t see anything very quirky in these numbers unlike past months. OER still converging with our model.

- If there’s “nothing unusual,” it suggests underlying core rate is something near 1.5%. But inflation always on the way to somewhere.
- Four-pieces breakdown: Food & Energy

- Four-pieces breakdown: Core Goods. Still bumping along, but this will turn higher as USD weakens.

- Four-pieces breakdown: Core Svcs less Rent of Shelter. This continues to be The Story.

- Four-pieces breakdown: Rent of Shelter – as I said, ebbing but just because it was ahead of itself. Housing isn’t about to deflate.

- As @pearkes points out, core services ex-housing largely a medical story, and that’s likely temporary. Chart for CPI medical care:

- I find it ironic: if Ocare IS helping to contain health care, it’s b/c consumers negotiate harder when they don’t really have health care.
- …which would seem to run counter to the professed reason for the ACA, which was to increase coverage. Is it working b/c it’s not working?
- Enough CPI for today. Don’t forget to buy my book!
- Also, good friend just published a thriller: http://amzn.to/2um7vIi He’s a very engaging author if you like fiction.
It was just a few months ago that we worried about whether core inflation was about to accelerate past 3%. Then, we had a few months where some people (not me!) worried that we were suddenly plunging into deflation and core inflation was around 0%. The reality seems to be somewhere in the middle. The recent ultra-low prints are clearly the results of one-offs, but it also seems as if the ongoing upward pressures – for example, in housing – have come off the boil as well. Back when rents were surging, I was worried that our model was perhaps not capturing some other dynamic and that rents would run away to the upside; in the event, it was probably just noise.
So what is the true underlying dynamic? We have to remember that economic statistics are just experiments – samples of an unknowable distribution. And, since economic data is very noisy, it usually takes a lot of data to be able to say for sure that something has changed. Economists and other prognosticators are usually not so patient. We got a weak number, and we want to say right now that something fundamental has changed. It doesn’t work that way.
Inflation data are usually fairly stable (once you strip out food and energy), so a couple of surprising figures is often enough to signal a changing dynamic. But one curious aspect of the last year’s worth of core inflation data is that it has been very volatile – in fact close to being the most volatile in the last twenty years:

There are a couple of implications to that observation, but the key one here is that it means it’s harder to reject any particular null hypothesis when the data are all over the place.
So here’s the summary: the main contributor to lower core inflation that is difficult to shrug off completely is the abrupt plunge in medical care inflation. This also happens to be the category that is most difficult to measure, since most consumers do not directly pay for much of their health care…or, anyway, they didn’t until Obamacare led to dramatic increases in deductibles. But that change in who pays for health care makes it very difficult to disentangle what the price of health care is actually doing, as opposed to the quantity of health care consumed. Very, very difficult.
My suspicion, based on direct observation and conversations with professionals in hospital and practice management, is that there are indeed pressures to contain healthcare costs, part of which are being caused by the fact consumers are having to negotiate directly with doctors for care and part of which are the result of other institutional pressures, such as the effect of Medicare/Obamacare legislation on formulary negotiations. Does that mean Obamacare is “succeeding?” If the sole purpose of the ACA was to lower health care costs by reducing the consumption of health care – maybe it is, at least in the short run. Certainly, there is a lot of energy on the entrepreneurial side dedicated to finding ways to cut costs, and lots of inefficiencies that can be wrung out…and, if “angry consumers” is the impetus for organizations finally wringing out these inefficiencies, I suppose that’s not a bad thing.
As I said earlier, I think it’s too early and there’s too much noise to say that something fundamental has changed. Heck, a year ago I thought medical inflation was about to run away on the upside (and I wasn’t alone, as the Republican sweep of Congress attests). I am not about to be fooled in the opposite direction as easily. What I will say is that I have trouble believing that inflation in the cost of physicians’ services is going to go negative, or stay near zero for a long time. I could be wrong, but I suspect that part of the pendulum will start to swing back over the next six months.
Pre-Existing Conditions and Fire Insurance
When it comes to health care, I continue to be amazed at the utter nonsense that gets tossed about when the discussion comes to insuring pre-existing conditions. The problem seems to be that no one who understands insurance has anything to say about health care legislation, because the question of why you may not want to guarantee issuance of insurance at a given rate no matter what pre-existing conditions the patient has is really not hard to understand. Consider this little vignette:
Caller: Hi, I’d like to buy some home insurance, please.
Agent: Sure, I’d be happy to help with that.
Caller: Does the insurance cover loss from fire?
Agent: Of course. That’s just one of many coverages you get with our insurance. Can you tell me a little bit about your house?
Caller: It’s three bedrooms, two baths. Worth about $300,000. What will the insurance cost me?
Agent: It depends on a few more pieces of information I have to gather from you, but about <pause> $800 per year.
Caller: That sounds great. Sign me up. Do you need my credit card?
Agent (laughing): Just a moment, sir! I need to get more information to give you an accurate quote. Can you tell me about the condition of your home?
Caller: You mean, right now?
Agent: Um…yes.
Caller: It’s on fire.
Agent: Your house is on fire?
Caller: Yep. Can we speed this up a bit?
Agent: Sir, we can’t insure your house against fire if it’s already on fire!
Caller: Why not? Just because it’s a condition that existed prior to my call?
Agent: Well, yes.
Caller: That’s outrageous! I demand you issue me insurance!
Agent (after conferring with management): Sir, it turns out we can offer you insurance on your home…
Caller: See? I knew you could be reasonable.
Agent: …for $350,000.
See, here’s the thing. Insurance is based on the principle of distributing money in a pool of similar risks from insureds who don’t experience the insurable event to those who do experience the insurable event. If someone enters the pool who has already had the insurable event, it’s simply a transfer – there’s no insurance. Person A needs $100,000 in surgeries, and gets an insurance policy that costs $1,000. Where does the rest of the money come from? It doesn’t come from the insurance company, and I think perhaps people don’t understand that point (and Republicans are truly abysmal at explaining it). The rest of the money comes from other insureds. Consider this situation: rather than get private insurance, you and twenty of your fraternity brothers from college – all about the same age and health – decide to form your own mutual insurance network. Everyone agrees that if anyone gets sick, the whole group will pitch in equally to pay the medical bills of the sick person. Now, suppose one person says “can we take my mom in as well? She has early-onset dementia and was just diagnosed with lung cancer. She’d be glad to join the group and pay an equal share, because fair is fair!” Do you think it is fair that mom pays the same amount?
The insurance company makes money if the money they pay out is less than the money they take in, but they also stand to lose if they underwrite the risks poorly and pay out more than they take in. And insurance companies don’t systematically rip people off by underwriting policies super-conservatively. In fact, the evidence seems to be that insurance companies rather frequently fall prey to pressures to move more product, and underwrite policies too aggressively.
The social-justice question can be separated from the health care insurance question. If you feel that everyone should have their medical bills covered, no matter what, then create a federal umbrella program for high-risk insureds and pay for that program with taxpayer funds. That’s explicit: let the cost of health insurance cover the actual cost of health insurance, which involves conditions the risk pool doesn’t have yet, and represent the welfare or charity – because that’s what it is, of course, when others pick up the expense of those unable to pay – as exactly that. After all, the federal government offers flood insurance to landowners who can’t get insurance at a “reasonable price” because the land floods all the time; that is a similar welfare situation in which taxpayers have decided they are willing to foot the bill because it’s a social good that people live or build on the flood plain. (I’m not sure why, but that’s the import of the federal flood insurance program). So there’s precedent for the government taking over pools that are too risky for private markets.
Again, this isn’t rocket science and it isn’t hard to explain. Why doesn’t someone get on television and explain it? How about a commercial using my script?
Profits and Health Care: A Beneficial Connection
I usually try to avoid political commentary in this space, because it has become so personal to so many people. If I point out that a particular program of the “left” is smart, or cleverly put together, then half of my readership is annoyed; if I point out the same about the right, then half of my readership is angry. It doesn’t really make sense to waste article space except on those occasions when a policy has a clear effect on inflation over time, such as when the structure of the ACA made it clear that it would put upward pressure on inflation (as I pointed out in 2013) or in response to someone else’s flawed analysis of a policy, as I did last year when I tackled the San Francisco Fed for their weak argument about how the ACA would hold down inflation because the government would demand lower prices. Actually, there is no policy I have written about more than the ACA over the years – but again, this was economic commentary and not political commentary.
This article will be short, but different in that I am writing it to express frustration with the absolute lack of intellectual clarity on the part of the Republicans in making a particular argument that immediately impacts the debate over health care but also extends far into other policies. And, because the argument is simple, direct, and has tremendous empirical support, I couldn’t restrain myself. I expect this article will not be picked up and syndicated in its usual channels since it isn’t directly about economics or markets, but it needed to be said.
I’ve been stewing about this topic since Tuesday (March 14th), when I happened to catch part of the daily White House press briefing. Press Secretary Sean Spicer was asked a question about the President’s health care proposal, and tap danced away from the question:
Q Thanks, Sean. You mentioned the call with the CEO of Anthem Health. Can you tell me what this proposal of the President means for health insurance companies? Will their profits go up or down under the President’s proposal?
SPICER: Well, I don’t think that’s been the focus of the President’s proposal. It’s not about them, it’s about patients. But I think what it means for them is that they finally get to create more choice and more plans and allow people to choose a plan that fits them. Right now, they don’t have that choice. And, frankly, in more and more markets, companies like Anthem, UnitedHealth, Signa are pulling out — Aetna — because they don’t have the choice and because of the government mandate. I think what we want to do is allow competition and choice to exist so that they can offer more options for the American people.
Q But will those companies make more money under the President’s plan or less?
SPICER: I don’t know the answer to that. That’s not been the focus of what we’re doing now. And at the end of the day, right now they’re pulling out of market after market, leaving the American people with fewer and fewer choices. So right now it’s not a question of — from the last I checked, I think many of them were doing pretty well, but it’s the American people and its patients that are losing under the current system. So I think that there’s a way you can do a little of both.
Spicer’s response was the usual drivel that the Republicans have adopted when they run in fear from any question that includes the word “profits.” To summarize, the question was basically, “you’re doing this to throw a sop to fat-cat insurance companies, aren’t you?” and the answer was “we don’t think about that. No idea. Profits? Who said anything about profits? It’s about patients and choice. And, if anyone gets more profits, it wasn’t on purpose and we didn’t have anything to do with it.”
But this was actually a softball question, and the answer ought to have been something like this:
Q But will those companies make more money under the President’s plan or less?
BIZARRO SPICER: Well, I hope so. After all, the insurance companies want every person in America to have health care – which is the same thing that we want – because the more people they sell their product to, the more money they can make. The insurance companies want to sell insurance to every person in the U.S. The insurance companies also want costs to be lower, and constantly strive to lower the cost of care, because the lower that costs are, the more profit they can make in the short run. But they don’t want lower costs at the expense of health – clearly, the best outcome for their profits is that most people covered by insurance are healthy and so don’t require the insurance they’ve paid for. So, if we just get out of the way and let companies strive for better profits, we are likely to get more coverage, lower costs, and a healthier population, and that is the goal of the President’s plan.
The reason we don’t already have these things is that laws we have previously passed don’t allow insurance companies to offer certain plans, to certain people, which both sides want but which politicians think are “unfair” for one reason or another. Trying to create a certain preconceived Utopian outcome while limiting profits of insurance companies is what caused this mess in the first place.
If you want to beautify gardens in this city, does it make sense to limit the amount of money that gardeners can make? If you did, you would find fewer gardens got tended, and gardeners would not strive to make improvements that they didn’t get paid for. We can see this clearly with gardeners. Why is it so hard to understand with the companies that tend to the nation’s health? Next question.
For some reason, Republicans think that saying “profits are good” is the same thing as saying “greed is good” and leads to caricatures of conservatives as cigar-smoking industrialists. But while at some level it is the desire for a better material outcome – which I suppose is greed, but aren’t there degrees of greed? – that drives the desire for profit, we cannot dismiss the power of self-interest as a motive force that has the effect of improving societal outcomes. “It is not from the benevolence of the butcher, the brewer, or the baker that we expect our dinner, but from their regard to their own interest,” after all.
Of course, Republicans must also remember that profit without competition is a different animal. If an insurance company creates an innovation that lowers medical care costs, but does not face competitive pressure, then the benefit of the innovation accrues to the company alone. There is no pressure in such circumstances for the company to lower the price to the customer. But consider what happened to air fares after the deregulation of 1978, or to the cost of telephone service when the AT&T monopoly was broken up in 1984, as competition was allowed and even encouraged. Competition, and the more brutal the better, is what causes companies to strive for an edge through innovation, and it’s also what causes the benefit of that edge to eventually be accrued by the end customer. The government didn’t invent cell phones. Motorola did, in order to try and gain an edge against AT&T,[1] but until the telephone monopoly was broken up there were no commercial versions of the cell phone. The first cell phones cost $10,000 in 1983, about $25,000 in today’s dollars, but now they are ubiquitous and cost about 2% as much in real terms. But this didn’t happen because of a government program to drive down the cost of cell phones. It was the profit motive, combined with competition. All that government did was create the conditions that allowed innovation and competition to happen. And wouldn’t we like health care to be as ubiquitous and cheap as cell phones are?
This is not a hard thing to get right. It isn’t hard for people to understand. But for some reason, it seems incredibly hard for politicians to believe.
Note that nothing I have written here should be construed as an opinion about the President’s health care plan, which I have not read. My remarks are only meant to reflect on the utter inability of Republicans to properly convey the reasons that a different approach – one where the government’s involvement is lessened, rather than increased – would make more sense.
[1] The first cell phone call was made by the inventor, Martin Cooper at Motorola, who called his competition with it: the head of the cellular program at AT&T. According to him, he said “Joel, I’m calling you from a cellular phone, a real cellular phone, a handheld, portable, real cellular phone” and he said it got really quiet on the other end of the line.
How Obama Helped Trump Win the White House
At this writing, Presidential Candidate Donald Trump is trailing Hillary Clinton in most assessments of the political map. While it is much closer than the 6-point spread in the national polling indicates (if all of the “toss-up” states on Real Clear Politics flip to Trump, rather than to Clinton as they now lean, then Trump scores a fairly easy victory), the winner-take-all betting markets put Clinton’s chance of victory near 90%. To be fair, though, let’s remember that the betting markets had the Brexit vote failing with similar certainty, even though the polls were similarly close.[1]
The October surprises, which by now are no surprise, have had essentially no effect. The jaded and cynical US public yawned at tales of Trump’s peccadilloes and the shocking, shocking tale that Clinton may have padded her pockets by selling influence while in office. And so…it’s over?
Well, not so fast. While the public now dismisses as normal behavior the sorts of things that we would fire an employee for (or divorce a spouse for) if they happened to people around us, and seems content to elect a flawed candidate regardless of the outcome on November 8th, there is something that they do care about, and deeply: their own money.
It is incredible to me, since I am just as cynical as the rest of the electorate, that when the Affordable Care Act was passed the open enrollment date was systematically placed just a few days before Election Day. That was either great confidence (“this is going to be great! They’ll love us and vote for us!”), great hubris (“it doesn’t matter whether this works, the sheeple will vote for us anyway”) or great carelessness (“oh, rats, didn’t think of that”). Because we now know that over the next several days, millions and millions of Americans will receive letters explaining to them that their existing plan will be outrageously more expensive in 2017 – in some cases, premiums will double – or may not be available at all.
I suspect that a taxpayer in North Carolina, who sees his premium jump 40%, is going to suddenly take notice of the Presidential election and wonder which candidate is more likely to solve that problem. Now, before you write your hate mail to me, let me note and acknowledge a few facts:
- I am not voting for either of the two major party candidates. I’m no Trump stooge. I think they’re both awful candidates. This article is just a commentary on what I think will happen, not cheerleading for an outcome I want to happen.
- Some voters will not see any change in their premiums because their subsidies will rise an equivalent amount to the premium. But,
- Most people who are squarely in the middle class will not get these subsidies. On the calculator at https://www.healthcare.gov, I can see that a family of four in New Jersey, earning $45,000, should not expect to be eligible for a premium tax credit or other savings. According to the Pew Research Center, a family of four with a $45,000 pre-tax income is in the lowest 25% of New Jersey residents arranged by income.
- Furthermore, someone who continues to get a subsidy is not likely to be as motivated to go out and vote for a continuation of the status quo as a person who is seeing a 40% rise is motivated to go out and vote for change. So, this is likely to cause a major change in the degree of motivation for one party compared with the other.
- Many voters will, instead, get a letter that their existing plan will no longer be offered, and this too will cause angst and anger.
- Voters who are covered by an employer plan are not immune just because the “employer pays.” When an employer’s cost for employee insurance rises 40%, that employer will either lay off workers, make them cover more of their own premium costs, or hold down other costs…such as salary increases.
Simply put, unless you are living under a rock you are aware of these dramatic changes in insurance costs and coverage. If you’re one of the few lucky ones to be subsidized (and even more if you’re lucky to have a cheap plan that you wouldn’t have had to get at all before the ACA passed), then you’re probably going to like the current regime. You may even be grateful, and go out to vote your thanks. But this is a small (and expensive!) minority of the electorate. The vast majority is going to see painful and drastic changes in the health care landscape. And they’re going to see it right about now. Again, what is really amazing to me is that the program designers made November 1st the notification deadline for re-enrollment letters.
Aside from the effect on the election, which I think might be dramatic, we need to also think about the effect on the economy. The good news is that while medical care inflation is likely to keep rising, the large jump this year is possibly a one-off effect because the ACA is removing subsidies of insurance companies that previously caused insurance to look cheaper than it really was. But that won’t help this year’s politicians.
The large rise in premiums, incidentally, is also going to have a depressing effect on economic growth next year because it hits the middle of the income distribution the hardest. If Bill Gates sees his insurance costs go up 40%, it’s no big deal. But if Fred the plumber from Poughkeepsie sees his insurance costs go up 40%, he’s going to be buying less of something else that is discretionary. Cars, clothes, meals out perhaps?
The election is mere days away. If Trump wins, despite his every effort to make himself unelectable, he will have one person to thank most profusely: President Obama.
[1] Remember that the betting markets work like options – as time to maturity goes to zero, gamma at the strike price goes to infinity. That is, with no time left the value of the Clinton option – which, since it’s a binary option, is the same as its delta – goes from 100% if she wins by 1 vote in a state that puts her 1 electoral vote over Trump, to 0% if she loses by 1 vote in that same state. Six months ago, one vote would have no effect on option price; but if we are around the strike as we are now even small changes can have large effects on price.
Why Does the Fed Focus on a Flawed PCE?
On Friday, I was on Bloomberg TV’s “What’d You Miss?” program to talk about the PCE inflation report from Friday morning. You can see most of the interview here.
I like the segment – Scarlet Fu, Oliver Renick, and Julie Hyman asked good questions – but we had to compress a fairly technical discussion into only 5 or 6 minutes. As a result, the segment might be a little “wonky” for some people, and I thought it might be helpful to present and expand the discussion here.
The PCE report itself was not surprising. Core PCE came in as-expected, at 1.7%. This is rising, but remains below the Fed’s 2% target for that index. I think it is interesting to look at how PCE differs from CPI to see why PCE remains below 2%. After all, core PCE is the only inflation index that is still below 2% (see chart, source Bloomberg). And, as we will see, this raises other questions about whether PCE is a reasonable target for Fed policy.
 There are several differences between CPI and PCE, but the main reasons they differ can be summarized simply: the CPI measures what the consumer buys, out-of-pocket; the PCE measures not only household expenditures but also spending on behalf of consumers, including such things as employer-purchased insurance and some important government expenditures. As pointed out by the BEA on this helpful page, “the CPI is based on a survey of what households are buying; the PCE is based on surveys of what businesses are selling.”
This leads to two major types of differences: weight effects and scope effects.
Weight effects occur because the PCE is a broader index covering more economic activity. Consider housing, which is one of the more steady components of CPI. Primary rents and owners’-equivalent rent constitute together some 32% of the CPI and those two components have been rising at a blended rate of about 3.4% recently. However, the weight of rent-of-shelter in PCE is only 15.5%. This difference accounts for roughly half of the difference between core CPI and core PCE, and is persistent at the moment because of the strength in housing inflation.
However, more intriguing are the “scope” differences. These arise because certain products and services aren’t only bought in different quantities compared to what businesses sell (like in the case of housing), but because the two surveys include and exclude different items in the same categories. So, certain items are said to be “in scope” for CPI but “out of scope” for PCE, and vice-versa. One of the places this is most important is in the category of health care.
Most medical care is not paid for out-of-pocket by the consumer, and therefore is excluded from the CPI. For most people, medical care is paid for by insurance, which insurance is usually at least partly paid for by their employer. Also, the Federal government through Medicare and Medicaid provides a large quantity of medical care goods and services that are different from what consumers buy directly – at least, purchased at different prices than those available to consumers!).
This scope difference is enormously important, and over time accounts for much of the systematic difference between core CPI and core PCE. The chart below (source: BEA, BLS) illustrates that Health Care inflation in the PCE essentially always is lower than Medical Care inflation in the CPI.
 Moreover, thanks in part to Obamacare the divergence between the medical care that the government buys and the medical care consumers buy directly has been widening. The following chart shows the spread between the two lines above:
 It is important to realize that this is not coincidental, but likely causal. It is because Medicare and other ACA control structures are restraining prices in certain areas (and paid by certain parties) that prices to the consumer are rising more rapidly. Thus, while all of these inflation measures are likely to continue higher, the spread between core CPI and core PCE is probably going to stay wider than normal for a while.
Now we get to the most interesting question of all. Why do we care about PCE in the first place? We care because the Fed uses core PCE as a policy target, rather than the CPI (despite the fact that it has ways to measure market CPI expectations, but no way to measure PCE expectations). They do so because the PCE covers a wider swath of the economy. To the Fed, this means the PCE is more useful as a broader measure.
But hang on! The extra parts that PCE covers are, substantially, in parts of the economy which are not competitive. Medicare-bought prices are determined, at least in the medium-term, by government fiat. The free market does not operate where the government treads in this way. The more-poignant implication is that there is no reason to suspect that these prices would respond to monetary policy! Ergo, it seems crazy to focus on PCE, rather than CPI (or one of the many more-useful flavors of CPI), when setting monetary policy. This is one case where I think the Fed isn’t being malicious; they’re just not being thoughtful enough.
Every “core” inflation indicator, including the ones above (and you can throw in wages and the Employment Cost Index as well!), is at or above the Fed’s target even accounting for the typical spread between the CPI and PCE. Not only that, they are above the target and rising. The Fed is most definitely “behind the curve.” Now, as I have noted before in this space I don’t think there’s anything the Fed can do about it, as raising rates without restraining reserves will only serve to accelerate inflation further since it will not entail a slowing of money supply growth. But it seems to me that, for starters, monetary policymakers should focus on indices that are at least in principle (and in normal times) more responsive to monetary policy!
Obamacare, Monopsonies, and Inflation – Nice Try!
Recently, the San Francisco Federal Reserve published an Economic Letter in which they described why “Medicare Payment Cuts Continue to Restrain Inflation.” Their summary is:
“A steady downward trend in health-care services price inflation over the past decade has been a major factor holding down core inflation. Much of this downward trend reflects lower payments from public insurance programs. Looking ahead, current legislative guidelines imply considerable restraint on future public insurance payment growth. Therefore, overall health-care services price inflation is unlikely to rebound and appears likely to continue to be a drag on inflation.”
The article is worth reading. But I always have a somewhat uncomfortable reaction to pieces like this. On the one hand, what the authors are discussing is well known: healthcare services held down PCE inflation, and core CPI inflation, due to sequestration. Even Ben Bernanke knew that, and it was one reason that it was so baffling that the Fed was focused on declining core inflation in 2012-2014 when we knew why core was being dragged lower – and it was these temporary effects (see chart, source Bloomberg, showing core and Median CPI).

But okay, perhaps the San Francisco Fed is now supplying the reason: these were not one-off effects, they suggest; instead, “current legislative guidelines” (i.e., the master plan for Obamacare) are going to continue to restrain payments in the future. Ergo, prepare for extended lowflation.
This is where my discomfort comes in. The article combines these well-known things with questionable (at best) assumptions about the future. In this latter category the screaming assumption is the Medicare can affect prices simply by choosing to pay different prices. In a static analysis that’s true, of course. But it strikes me as extremely unlikely in the long run.
It’s a classic monopsonist pricing analysis. Just as “monopoly” is a term to describe a market with just one dominant seller, “monopsony” describes a market with just one dominant buyer. The chart below (By SilverStar at English Wikipedia, CC BY 2.5, https://commons.wikimedia.org/w/index.php?curid=13863070) illustrates the classic monopsony outcome.
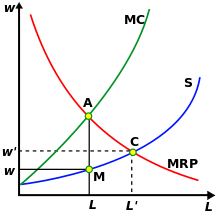
The monopsonist forces an equilibrium based on the marginal revenue product of what it is buying, compared to the marginal cost, at point A. This results in the market being cleared at point M, at a quantity L and a price w, as distinct from the price (w’) and quantity (L’) that would be determined by the competitive-market equilibrium C. So, just as the San Fran Fed economists have it, a monopsonist (like Medicare) forces a lower price and a lower quantity of healthcare consumed (they don’t talk so much about this part but it’s a key to the ‘healthcare cost containment’ assumptions of the ACA neé Obamacare). Straight out of the book!
But that’s true only in a static equilibrium case. I admit that I wasn’t able to find anything relevant in my Varian text, but plain common-sense (and observation of the real world) tells us that over time, the supply of goods and services to the monopsonist responds to the actual price the monopsonist pays. That is, supply decreases because period t+1 supply is related to the reward offered in period t. There is no futures market for medical care services; there is no way for a medical student to hedge future earnings in case they fall. The way the prospective medical student responds to declining wages in the medical profession is to eschew attending medical school. This changes the supply curve in period t+1.
Any other outcome, in fact, would lead to a weird conclusion (at least, I think it’s weird; Bernie Sanders may not): it would suggest that the government should take over the purchase and distribution of all goods, since they could hold prices down by doing so. In other words, full-on socialism. But…we know from experience that pure socialist regimes tend to produce higher rates of inflation (Venezuela, anyone?), and one can hardly help but notice that when the government competes with private industry – for example, in the provision of express mail service – the government tends to lose on price and quality.
In short, I find it very hard to believe that mere “legislative guidelines” can restrain inflation in medical care, in the long run.
Summary of My Post-CPI Tweets
Below is a summary of my post-CPI tweets. You can (and should!) follow me @inflation_guy or sign up for email updates to my occasional articles here. Investors with interests in this area be sure to stop by Enduring Investments. Plus…sign up to receive notice when my book is published! The title of the book is What’s Wrong with Money?: The Biggest Bubble of All, and if you would like to be on the notification list to receive an email when the book is published, simply send an email to WWWM@enduringinvestments.com. You can also pre-order online.
- whoopsie daisy! core CPI +0.3%.
- …actually +0.29%, so not just a barely-round-up thing. Y/Y t0 2.22%. Both comfortably above consensus.
- Next month, we drop off a +0.16% from last year so even a +0.20% print on core would push us to 2.3% in Feb.
- Core converging with median, as expected. Look at chart. What impression will it give FOMC?

- core services +3% from +2.9% y/y; core goods to -0.1% from -0.4%. least-negative in two years.
- I am not sure the core goods improvement can be sustained, yet, given lagged effects of dollar. Will eventually, though.
- dealers holding all those 30y TIPS from y’day auction feel better today.
- Cpi breakdown shortly. Taking unusually long to parse the data. Really need to optimize my database.
- OK! Housing 2.10% from 2.07%. Primary rents 3.71% from 3.68% and OER 3.16% from 3.14%. So housing isn’t the big story.
- Medical care: 3.0% from 2.58% y/y. As the mythbusters would say, “there’s yer problem.”
- Medicinal drugs 2.21% from 1.66%; Professional svcs to 2.08% from 1.92%, Hospital 4.32% from 3.96%.
- Medicinal drugs is what to watch going fwd. That’s in core goods & in 2015 fell from 5% to 1.7%
- motor vehicles +0.51% from +0.14% y/y. Also in core goods.
- Of interest – the fall in energy prices has reduced “food and energy” to 21% from 22.3%. So core is bigger.
- Core ex-shelter 1.47% from 1.29%…highest since 3/2013. I think @TheStalwart showed a picture of that earlier.
- This is less and less just a housing phenomenon.
- OK, good news is that it looks like median CPI ought to be about 0.18%ish, so y/y will inch back up to 2.5% but not jump to 2.6%.
- Also interesting is that the diffusion indices didn’t go wacky. So this number is not QUITE as bad as it seems at first blush.
- Still the overall trend is clear: housing and now core ex-housing inflation are headed higher.
- Still very hard for the Fed to ignore the core CPI chart. And PCE will be worse, because it is heavier in medical care.
- I think March just went back on the table for the FOMC.
So, here are the main takeaways from this month’s report:
First, inflation in medical care is coming back, and that is starting to blunt the deflation in other core goods. At this point, the question is whether medical care inflation goes back to what it was prior to the Affordable Care Act, or goes higher. Although I am a staunch opponent of Obamacare, and I believe it will drive costs higher overall, I think anecdotally there are some signs that the free market is working to correct some of the most egregious failings of the Act. So it may not be quite as bad as it otherwise would be. Still, it appears the temporary lull in medical care inflation is past us.
Second, the fact that medical care was a big driver in this month’s CPI report means the core PCE report will likely be worse, since medical care carries a much larger weight in core PCE. This is why core PCE has been weaker than core CPI for some time, but that will correct.
Third, and a related point: the lagging measures of inflation are catching up with median CPI. The chart below, which is really just an expanded version of the chart above, doesn’t have the updated median CPI, which will be released later today, but that line won’t look much different. And it doesn’t have the updated core PCE, which will be released next week. But you can see what is happening to core CPI, which is the middle line.

Fourth, core goods prices are not likely to suddenly explode higher. The delayed impact of dollar strength, while it will not drive deflation broadly, will keep a lid on core goods inflation for a while longer. However, the core goods part of CPI is the less important and persistent part, and services (driven by housing, but no longer just by housing) continues to accelerate.
Fifth, the Federal Reserve had been inching away from the expectation that they would tighten in March, due to weak global growth and domestic equity markets. I think that possibility just landed back squarely on the table. If folks don’t realize it today, they will realize it when core PCE “surprises” higher next week.
And all of this means that higher inflation remains in our future. The notion that deflation is some kind of existential threat makes as much sense as the notion that alien invasion represents an existential threat: possible, but not something that ought to keep us awake at night worrying. Inflation expectations do not drive inflation – it is the other way around. Inflation is headed higher, whether people – and the FOMC – expect it, or not.
Summary of My Post-Employment Tweets – Growl of Displeasure
The following is a summary and extension of my post-Employment tweets. You can follow me @inflation_guy (and tell your friends!)
- 175k +25k revisions, nice jobs figure. Oh, but Unemployment up to 6.7%. Love how these seem to always provide opposite surprises.
- One of my favorite labor charts. Want a Job Now, versus the Unemployment Rate:

- 1 way to add more jobs is to have em all work less. Is this an Obamacare effect since part-timers don’t count?
- …regardless, fewer hours worked –>lower output. Expect more downward revisions to Q1 growth ests. Q2 too, if this is ACA.
- If we all end up with jobs, but we’re all working only 30 hours per week, is that better than if only 93% have jobs, working 40?
It will be interesting over the next few months to see if the Hours Worked figures are weather-related (as will be claimed). I suspect that for the most part, they are not. Notice that if there was any weather effect over the last few years, it is not noticeable in the data (nor is it apparent in the unrevised data, incidentally). So, while this year’s weather was colder and snowier than usual, I am skeptical that this can account for more than a small downtick in the hours worked figures.
I rather suspect that the drop is more likely to be attributable to the definition of what constitutes a “full time worker” under the Affordable Care Act. And the question I asked rhetorically above is actually worth thinking about seriously because, looked at one way, the ACA is a jobs program: it will tend to cause businesses to cut back on full-time work and replace those people with more part-time work. The effect should be to cause the Jobless Rate to decline along with Hours Worked. But is that a good thing (because more people have some job) or a bad thing (because people who formerly had a full-time job now only have a part-time job)?
That’s a normative question, not a positive question. But I would think that one effect would be to push more people from what we think of today as “middle class” to lower-middle class, while perhaps raising some who were previously in poverty to be also lower-middle class. I don’t think this was one of the purposes of the law – because frankly, it doesn’t seem that much economic thought went into the design of the ACA – but it is interested to reflect on.
I don’t know what to make of the “Want a Job Now” chart. Let me explain that series, first. “Not in the Labor Force” implies that these people aren’t even looking for jobs, because if they were then they would be counted as unemployed. But, despite the fact that they are not looking, they would like to have a job and would take one if it was offered. While the Unemployment Rate is falling, almost as many people are in the “not in labor force but want a job now” category as were in that category at the beginning of 2011. Why aren’t these people looking?
A fair number of these workers, some 2.3mm of them, are described as “marginally attached” because they’ve looked for work in the last 12 months, and want a job, but haven’t looked in the last 4 weeks so that they aren’t counted as part of the work force. And those are the ones who are holding the category up (see Chart, source Bloomberg).
Some of those workers are not looking because they are “discouraged”, but that only represents about 750k of the 2.3 million or so in this category (and discouraged workers have fallen from about 1 million in 2011, so the decline is consistent with the Unemployment Rate).
So, we are left with a category of people who have looked for work in the past, and would take a job if it was offered, but haven’t looked in the last month. Or the month before. Or the month before. But, at some point, they had at least done a cursory search of the wanted ads.
I think the story of these “marginally attached” workers is worth studying. Are these structurally-unemployed people, who should be counted as such? Are they incentivized to remain out of the work force due to governmental benefits they receive? Or are they, and the decline in the labor force participation rate generally, telling us that the jobs aren’t coming back (or that the newly-created jobs are of lower quality than the old jobs)? I don’t know, but none of the answers is good. We want to see this number decline.
The story of the declining hours worked is potentially much more serious, though – partly because it is a new effect. The nation’s total output is number of employees, times average hours worked, times output per hour. If the number of employees is rising, but they’re working less, then unless productivity rises the total output (that is, GDP) won’t grow very quickly. This could be an early recession sign, or it could be a consequence of the ACA…or it could be a sign that the ACA is pushing a fairly non-robust economy towards the recessionary tipping point. Again, none of these things are good.
So, while the stock market roars its approval about this Employment number, I growl my displeasure. But this is normal.