Archive
Higher Interest Rates Can Lead to Higher Rents!
I don’t generally recommend particular researchers, although I’ll point to someone who has a sharp idea when it attracts my attention. In the latter category, I have to point to the latest from Jay Parsons – an article entitled “Could Higher Rates Re-Accelerate Rent Inflation? Maybe.”
It’s always useful to read out-of-consensus analysis. Reading the 122nd article about how AI is going to put us all out of work and cause spiraling deflation isn’t very useful. When it comes to forecasting housing and rent inflation, another regurgitation of the high-velocity rent indices that capture a tiny part of the people paying rent (only the people with new rent contracts), or that confuse the effect of interest rate increases on sales with the effect on prices, mostly just cause me to glaze over and skim past.
But this article is interesting, mainly because it highlights something that is universally true and yet almost-as-universally misunderstood. And that is the notion that higher interest rates cause disinflation by dampening demand.
I’ve written about this until I’m blue in the link – interest rates do not have any useful causal relationship on subsequent inflation. But the article from Jay Parsons lays out the reason very clearly, in the context of housing. It’s often proposed that interest rate increases affect the economy most directly through housing, because higher interest rates cause higher mortgage rates and higher mortgage rates cause less demand for housing, and less demand for housing causes less building, etc. The demand channel rules.
Except…that completely ignores the supply channel. This was one part of the enormous COVID policy mistake – yes, by shutting in consumers you crush demand. But that’s not deflationary because you’re also crushing supply. And when you flush lots of money in the system at the same time, well…the results were predictable. Parsons highlights this effect on the housing channel – low interest rates trigger lots of building, and high interest rates tend to impair building. That is, interest rates operate significantly on the supply side.
And that makes sense to me. If I am buying a house and I have to make a 30-year decision on an interest rate, then higher interest rates will definitely reduce the amount of home I buy. But the primary decision to buy a home is not generally based on interest rates…the amount of home may be. On the other hand, as a homebuyer I also know that my commitment isn’t 30 years. It’s as long as I remain in the home, at most, and if interest rates drop at all I know it’s very easy to ratchet my rate down. The interest rate I am paying today is the maximum rate I’ll ever pay (assuming we’re talking about a fixed rate, of course). I’m not saying that higher interest rates don’t impact the demand for homes. I’m just saying I don’t think it’s as huge as we have been led to believe.
On the supply side, though, the return on equity for a builder is (a) the margin per home, times (b) the number of times the portfolio of homes built turns over in a year, times (c) the leverage applied to the portfolio. Okay, that’s just the DuPont equation and it’s true for all businesses, not just builders. Higher interest rates slows sales, and increases the cost of leverage, so builders definitely respond negatively to higher interest rates. And they respond by building fewer houses.
Whether that turns into rent inflation in 2027 and 2028, we will have to wait and see. My landlord-cost model is already anticipating rent inflation reaccelerating some, but not getting out of hand. It’s nice to see someone deep in the housing market coming to the same out-of-consensus conclusion.
Going back to the more-general case: this is more widely true than is typically appreciated. Because all of us are consumers, but not all of us are manufacturers, and because Keynes focused lots more on aggregate demand as a driver of the business cycle, somehow people tend to gloss over the supply side. It’s fascinating. It is not at all intuitive to me that increasing interest rates should lower inflation, since increasing rates affects both supply and demand and which dominates is indeterminate. So it doesn’t surprise me to see no lead relationship between rates and inflation; what surprises me is that people are surprised by that. (Similarly, the idea that interest rates contain an ‘inflation risk premium’ that the borrower must pay to the lender is baffling. Both sides have inflation risk – one to higher inflation and one to lower inflation. So why does only one side get a risk premium? In my opinion the risk premium should sometimes be positive, sometimes negative, and I can’t reject the hypothesis that it should be indistinguishable from zero. But I digress.)
So don’t forget about the supply side. That also matters!
Inflation Guy’s CPI Summary (September 2026)
It’s time for another CPI report. The next couple of months after this one will be interesting, since the government shutdown really screwed up the October 2025 (which didn’t exist) and November 2025 (which used some odd assumptions about October) comps. But for now, we’re still calculating y/y over data that exists, so we have that going for us.
Last month, recall that we had an upside surprise but it was due to long tails (e.g., cell phone services). The Median CPI wasn’t too surprising, and it was actually a reasonably tame report. The Fed hiked anyway, which tells you that the hike was already baked into the cake – it isn’t like the Federal Reserve was unaware that the number was hot mainly for one-off reasons.
Or…maybe the aberration last month was on the low side? That’s what we wrestle with today. Consensus for September’s CPI was for +0.57% headline, due to rising-again energy prices, and +0.22% on core, and that was expected to push the y/y higher to 3.6% and 2.5%, respectively, with core inflation rising mainly on base effects.
Markets-wise, over the month inflation swap rates were down but Treasury yields were up. Yes, that implies real yields rose more than nominal yields! See my last comment posting for why the real yield rise is not that mysterious.

The actual number for September turned out to print hot. Headline was +0.649% m/m (3.7% y/y) and core was +0.335% (2.6% y/y). Here’s a chart of the last 12 core CPI figures:

Food and beverages was blessedly lower this month, but there was heat in housing, apparel, transportation (even without fuel), and recreation.

Core Goods prices: +0.74% y/y; core services +3.15% y/y.
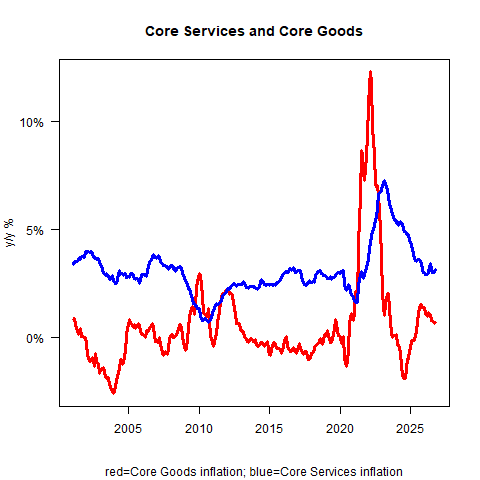
I don’t really love how core services appears to have arrested its decline. Some of that is still due to one-offs where commodity pressure is coded as services (e.g. airfares) but some, probably a lot, is legitimate pass-through.
There is at least some part of the explanation in rents and I don’t love how this next picture looks either. Rent of Primary Residence was +0.25% m/m, 2.78% y/y; Owners’ Equivalent Rent was +0.35% (3.28% y/y).

As I said earlier, last month the increase in core was less alarming because it was long-tail things while the main slow-moving things, like rents, were actually somewhat low. The low rent print last month now looks like a one-off. Primary rents were +0.17% in September and 0.25% in October; OER was +0.19% in September and +0.35% in October.
There was a fair amount of breadth here. Airfares were +1.16% m/m; Lodging Away from Home +2.04% m/m; Used Cars/Trucks +0.67% y/y; New Cars/Trucks +0.2% m/m. The persistent increase in Lodging Away from Home is interesting to me. This usually bucks and bobs and weaves but the last couple of months have been strong. Back in July it looked like the price level for hotels was going back into the range of the last few years; now it looks like it’s moving higher out of the range (see the price-level chart for Lodging Away from Home, below). Since wages and other costs of running a hotel are rising, I guess this shouldn’t be surprising.

Okay, here’s Median. My guess for the latest number is +0.282% m/m, moving y/y to 2.66% from 2.58%. That’s the wrong direction, and it’s going to continue as the base effects make it easier for a few months.

So, again: whereas last month the data was less concerning because Median was low, suggesting the rise was due to movements in the tail – this month it’s more concerning because Median jumped back up. This month’s Median CPI (or anyway, my guess about it), compounded 12 months, would be 3.4% y/y. Make a mental note of that for later.
None of the big macro pieces of CPI look especially cheerful. For new readers: these four pieces are all roughly a quarter of the CPI. In most-volatile to least, those pieces are Food & Energy, Core Goods, Core Services less Rents (aka Supercore), and Rent of Shelter.


Indeed, I don’t really see a lot of mitigating factors in the data to what looks like a pretty ugly number. I suppose you can argue that core ex-housing rose to only 2.04% y/y from 1.98% y/y. But that was still +0.29% m/m. It’s encouraging I suppose thatis core goods category is ebbing still, but remember – to get to 2% target inflation, you really need core goods to be deflating and it’s not getting there as fast as people hoped. (Personally I don’t think it’ll get very negative at all for a while. It will eventually, but deglobalization will be an upward pressure on this just as globalization was a downward pressure.)
I want to show where rents are against our model, again. Partly, that’s because I love this chart but also as a reminder that while m/m rents rose a lot this month and were soft last month, in the grand scheme of things they’re doing what we expect them to do. Do note that next year, there’s some upward pressure coming.

Continuing to talk shelter: I should note that existing home prices (see below) are only +1.3% y/y. Some forecasters use lagged home prices to drive their rents model. (This works when inflation is low and stable but we find building up from landlord costs is more accurate.) But this is your periodic reminder to keep home sales separated in your mind from home prices. As mortgage rates go higher, sales lag. However, the first principal component of home prices is the overall price level. Even if there was a big surplus of homes, real prices can fall (as they are now, with prices rising less than inflation) but nominal prices are unlikely to decline much if at all in an environment of 3%+ general inflation.

Let’s look at some broader distribution issues. Here’s one way to look at the gosh-we-aren’t-getting-there problem. This is the weight of CPI components that are inflating greater than 3% y/y. Since the Fed started the mad money-printing experiment, most prices have been rising faster than 3% y/y. That peaked a few years ago, but…seems to be leveling out above 50%.

And here is the Enduring Investments Inflation Diffusion Index, which says much the same thing – the underlying inflation dynamics are settling in, but at a level higher than the Fed would like it to be. These dynamics suggest median inflation should be headed back to the mid-to-high 3% range over the next year or so.

For a long time, I’ve said Median was tracking to end up in the “high-3s, low-4s” after the dip (mostly from rents and the shutdown mechanics) took us lower. That forecast now seems a little high, but mid-3s on Median is still worlds higher than almost anyone has been forecasting. Bottom line is – we’re not placidly settling back to 2% on core PCE.
Now, this is going to drastically raise the market odds of a Fed hike just like the Payrolls report drastically lowered them. I really don’t think the FOMC is swayed that dramatically from one data point to another. Or at least, I hope not. The underlying story has been the same for quite a while now – inflation is still gradually ebbing from the very high levels caused by rapid money printing during COVID, as (and because) money growth has slowed. The solution is a smaller Fed balance sheet and slower money growth, not higher interest rates, but there is still a vast contingent of people who think that growth, and expectations thereof, is the cause of inflation and therefore higher interest rates are needed to cool growth. Heck, the Nobel prize for economics was just awarded to a guy (Woodford) who is the poster boy of New Keynesianism, and who says the rate rule and expectations are what cause the price level (despite all the data indicating they don’t).
That being said – more data like this will certainly indicate that the Fed’s job isn’t done yet (in case you thought it was!) The only question is what the Fed does about it. Warsh has plainly indicated he wants to shrink the balance sheet and give less primacy to rates, but the last vote of the FOMC shows he doesn’t feel he has enough pull yet to do it his way. Going forward, the traditional FOMC is likely going to have to balance the question of slowing economic growth at the margin, versus sticky price pressures. The right answer near-term is ‘wait and see,’ and it’ll depend on whether the jobs figure is worse than the inflation figure. It’s probably as simple as that. I don’t have any insight on the jobs data. But I don’t think the inflation data are going to be helpful for a while.
Enduring Investments Capital Raise
For 17 years, Enduring Investments has done one thing: manage money against inflation. We’re the only firm built exclusively around inflation-related mandates — retail separately managed accounts and a private inflation-tracking fund among them.
We’ve opened a capital raise to fund our next phase of growth.
This offering is open to accredited investors, and as required under SEC Rule 506(c), we verify accredited status as part of the process.
If you’re interested in learning more, email partner@enduringinvestments.com and we’ll send our Advance Opportunity Summary and pitchbook.
