Archive
Inflation Guy’s CPI Summary (October 2026)
It’s October and we finally get to close the window on one of the weird CPI chapters. The consensus for today’s number, going in, was for +0.27% on headline and +0.22% on core – but there are no equivalent y/y figures because one year ago there was no CPI report thanks to the government shutdown. So the BLS is not going to report year-over-year for anything, because the denominator doesn’t technically exist.
For those of us who look at the distributions, and typically use annual changes or something like that, we have a couple of choices; we can use 11 month or 13 month changes, or calculate y/y on an interpolated value (or, for headline, maybe use the fallback value the Treasury used for TIPS). The important thing to remember is that whatever method you use, there’s some extra uncertainty with any analysis that leans on y/y figures because you actually have two unknowns, not one, today. It’s probably not a huge deal, but in case I quote a y/y figure today you should know that I’ll be using an interpolated figure from last year…and just know that I know that I’m doing that.
Now, we may also be in a different kind of window. For several years, CPI was the important release every month. Then, it went through a period when it was roughly equally important to the monthly Payrolls report. Going into 2027, it feels like at least early in the year it might be resuming a high level of importance again because of things like rents which show some signs of re-accelerating, and also a higher degree of concern in central banking circles about energy pass-through to core. But that’s really more of a 2027 story, unless today is an upward surprise, with the CPI figures from this month and next month being in some kind of window of ‘don’t really care about this yet’.
Having said that, next month at this time we will have CPI futures to trade once again. Kalshi is re-launching CPI futures and core CPI futures – not binary event contracts, but institutional-quality linear, margined futures – on December 8th. I am helping Kalshi with this and the spec is based on one I developed with Allan Levin in 2012 or so. I’ll talk more about them in this blog over the next month, but if you’re an institutional client who trades inflation (buy side or sell side), you’re probably going to want to be involved in these contracts and you should reach out to me on Bloomberg or otherwise. I’ll introduce you into the onboarding flow at Kalshi.
Another window we are in, of course, is the post-election ‘lame duck’ period for the current Congress. By well, the modest losses for the Republicans which cause a significant flip in control of the House and Senate have been (over) analyzed everywhere and that’s not my jam so I won’t focus on it here. But it does leave a little window during which the Fed might act and have it not look like they’re targeting either party. Not that they need to raise rates, and not that they should care at all about the political landscape, but we need to keep in mind that the bar for a tightening is probably kinda low right now.
Weirdly, though, the inflation and rates markets are screaming that such a move is unnecessary. 10y nominal interest rates are down about 30bps over the last month, with about 20bps of that coming from real yields and the balance of course from inflation expectations. The short end of the curve has seen inflation expectations abruptly crater, thanks to the energy market’s abrupt realization that crude oil appears to no longer be much impeded leaving the Straits of Hormuz, although gasoline and especially diesel prices remain high thanks in part to the Ukraine/Russia conflict.

The swing since this time a year ago is marked – longer inflation expectations are down a smidge, but the curve is now upward-sloping rather than downward-sloping.

Yee-haw! Sure would be nice to be able to hedge those short inflation expectations, wouldn’t it?!?
So here we go…
Headline inflation +0.35% m/m; core CPI +0.296%. That’s obviously a lot higher than expectations. It sure would be nice to have CPI futures to trade. Oh, wait! As of December 8th, we will!

This is just not very soothing, it is? There will be immediate chatter about raising rates, but raising rates won’t help unless you shrink the balance sheet and money growth. But more on that later. Here are the m/m, y/y (remember, denominator is interpolated), and prior y/y for the 8 major subgroups.

So it does not appear to be a big shelter story. That’ll probably be the story in 2027. Put a pin in the Medical Care number for now.
Core Goods was +0.97% y/y and core Services +3.4%.
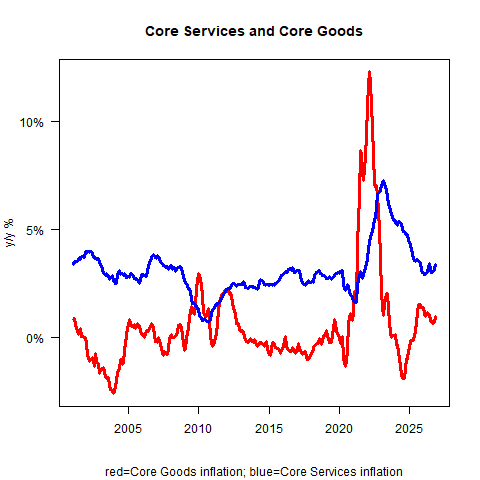
Recognizing the y/y figures are all based on interpolation, it’s still uncomfortable to see core goods and services both hooking higher. Especially because on the goods side tariffs are contributing nothing since they aren’t changing. And by the way Used Cars was down this month so it isn’t that usual suspect.
The Fed just published a very timely piece, entitled “The Effect of Oil Prices on Core Inflation: Recent Evidence from the Advanced Economies.” I stopped reading when I got to the words “augmented Phillips curve,” which is a concept so discredited by now that I judged the paper not worth finishing even if the conclusion might be intriguing. I present it for anyone who can power through it to see if you can glean anything interesting and useful. There’s certainly some common sense there, but I don’t know that there’s been a major change; I suspect rather that they probably found that when inflation was low and stable you couldn’t see any pass-through. Anyway, life’s too short to spend it on the augmented Phillips curve.

Primary rents were +0.2%; Owners’ Equivalent Rent +0.32% m/m. Again, be careful of the y/y figures above, and the m/m aren’t egregious, but if this trend is even leveling out and worse, reversing then we’re not getting to 2% soon.

My model had the ‘bottom’ in y/y rent inflation not happening for a few months, so I thought that this was a 2027 story (maybe in another way as well – see my comments at the end). Today’s figure puts us right back on the model. Either way we aren’t looking at a major acceleration in rents. But if you want inflation lower, you can’t have the biggest piece (between Primary and OER) going higher.
But if you want inflation lower, and rents are the reason, then why would hiking rates help? Heck I just discussed this on my blog a week ago. https://inflationguy.blog/2026/10/27/higher-interest-rates-can-lead-to-higher-rents/
I did notice that CPI for Baby Food was +5.1% NSA, which is something we haven’t really worried about since the aftermath of COVID. Not really sure why there. In general, the Food category was a bit buoyant (+0.45% m/m in the table above). Food at home was +0.44% (SA) and Food away from home was +0.52% y/y, so that’s not great. But again, does hiking rates lower food prices?

Yeah, that’s not great. Since I’ve already rolled through a bunch of the usual suspects, and not found any weird tail, I was thinking this might be a broader shift. Now, this is just my estimate; we’ll find out in a couple hours what the actual number is (and my calculation has the median category being one of the regional OERs, which means I will be wrong I just don’t know in which direction…but won’t be a huge miss). Note that last April’s jump was a known one-off due to the rent sample rotating out the zeros from the shutdown. Today’s jump was not expected. If my number is correct, it would be the highest Median (other than that technical one-off) since October 2024. What is it about Octobers?
I don’t usually show all four of the ‘four pieces’ charts of CPI, but this time I will because all four are hooking higher. Again, grain of salt time because the y/y figures have an interpolated denominator. The increase in Supercore at lower left is the most concerning piece for now.

Only two core categories in the Median calculation declined at a monthly rate that annualizes to more than 10% (well, smaller than -10%) – Used Cars (-14%) and Car and Truck Rental (-51%). Not really sure why Car and Truck Rental had such a large month/month decline, but it’s only 0.1% weight. But again, this isn’t a story about the tails: on the >10% side, we just have Public Transportation (+27%, 1.5% of the basket), Jewelry and watches (+19%), Footwear (+13%), and Recreation (+10%, and it’s 5.2% of the basket). But Median doesn’t move because of the tails.
The pop in the various medical care subcomponents is the most interesting thing to me. m/m NSA increases: Medicinal drugs +0.42%. Medical equipment and supplies +1.45%. Professional Services +0.43%. Hospital and related services +0.70%. Health insurance declined, and will be a drag for the next year, but health insurance in the CPI is a residual and not closely related to anything we would see when shopping for health insurance. (Still, it will help weigh on core CPI, and on Supercore CPI, slightly over the next year).

Interestingly, the Enduring Investments Inflation Diffusion Index didn’t do anything special this month. But it already has been saying that we should be expecting a re-acceleration, and maybe we’re getting it.
The bottom line here is that … this is not a pretty report. And people are going to be screaming for a 50bps rate hike when the Fed meets in December. Maybe the Committee will deliver it, but since the election is behind us the political ardor they would have had to do that has cooled some. But as I argued before, rate hikes will make any housing inflation worse, not better, and can’t really affect food or, honestly, much of anything. Yes rate hikes affect demand, but they also affect supply.

If you want to lower inflation, lower money growth. It’s back to about 6% and still accelerating. The balance sheet is what Warsh correctly complains about, and it’s time to stop increasing it and start shrinking it again.
In 2027, there is another effect we might have to start considering. Socialist wins is various big cities across the country mean that we’re likely to see rent freezes and various other forms of price control as a way of ‘bringing down the cost for ordinary Americans.’ While price controls do not lower actual inflation – they just move price effects into quality, and into availability, and damage long-term supply as with housing – they do lower measured inflation at least in the short run. If you freeze rents in LA and NYC, you’ll bring down the rent inflation number, even if no one can find an apartment. It’s something to keep an eye on, and it of course runs counter (in the short run) to my model which suggests higher rents due to increasing cost pressures on landlords. On the demand side, some of the deceleration over the past year or two may have been due to the ex-migration of roughly 3mm illegal immigrants, taking a little bit of pressure off the housing stock. That demand side effect is probably basically done, given the election results (especially in the Texas Governor race).
So I think next year’s inflation story is going to have a lot to do with what happens to the balance sheet, what happens at the border, and what happens with price control measures. It’s going to be a banger of a year, as the kids say.
