Archive
Summary of My Post-CPI Tweets (May 2019)
Below is a summary of my post-CPI tweets. You can (and should!) follow me @inflation_guy. Or, sign up for email updates to my occasional articles here. Investors with interests in this area be sure to stop by Enduring Investments or Enduring Intellectual Properties. Plus…buy my book about money and inflation. The title of the book is What’s Wrong with Money? The Biggest Bubble of All; order from Amazon here.
- Happy(?) tariff day! With new tariffs imposed overnight, important to remember that the IMPORTANT effect on prices is not the near-term bump (which is small), but the fact that the disinflation of last 25y was possible because of trade liberalization.
- Also of course happy CPI day. We get the number in a few minutes. Here are a few pre-thoughts.
- Last month, core CPI was +0.148% m/m and 2.042% y/y, which both rounded down and looked like big misses.
- They weren’t really big misses, and at least some of that was due to a plunge in Apparel prices that was probably methodology-related (at least, that’s what the econs had anticipated so let’s take as an initial guess that they were right).
- Rents, the biggest and most important (and slow-moving) piece, were firm – firmer than I’ve been expecting in fact.
- But used cars was weak, along with Doctor’s services…along with Apparel, in general there was a lot of “left-tail stuff.”
- The left-tail nature of last month’s figure was illustrated by the fact that MEDIAN, the measure I focus on, was +0.27% to 2.85% y/y…another post-crisis high.
- Today, the consensus is for 0.2%/2.1% on core inflation. We would have to get something below 0.12% m/m to keep core from bumping to 2.1%, and any kind of firm number (>0.21%) could pop us back to a rounded 2.2%.
- That’s because last April was pretty weak. In fact four of the next 5 months were under 0.2% a year ago, so the comps will be easier for core.
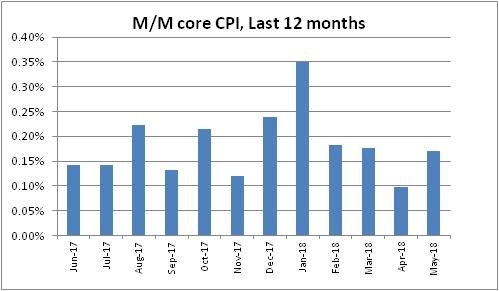
- Core CPI +0.14%, slightly weaker than expected but rounding down to 0.1% again. Y/Y was 2.07%, so it did round up.
- Soft-looking but as noted earlier, base effects made it hard to maintain a 2.0% on core.
- Last 12 m/m core cpis.

- OK, the number is stronger than it looks. Used Cars very weak, -1.31% m/m which is crazy. Doesn’t look anything like the private surveys. Apparel -0.76% m/m again, -2.9% y/y. That’s not an accurate depiction of what’s happening.
- Because mainly of those two pieces, core goods went to -0.2% from flat. With tariffs rising, that doesn’t pass the sniff test. Core services, though, rose to 2.8% y/y. Primary rents were +0.45% m/m, 3.76% y/y, and OER +0.33%.
- Rent of primary residence. This is surprising, but important.

- Here is OER. With the Shiller index softening, many had expected rents to follow. But chippy wages are helping to keep a bid here, for now at least.

- There’s a real problem using home price indicators to forecast rents, because your model for that was built over a qtr-century in which wages & inflation were low and stable. If wages rise, then maybe home prices will lag rents – but we don’t know because we haven’t seen it.
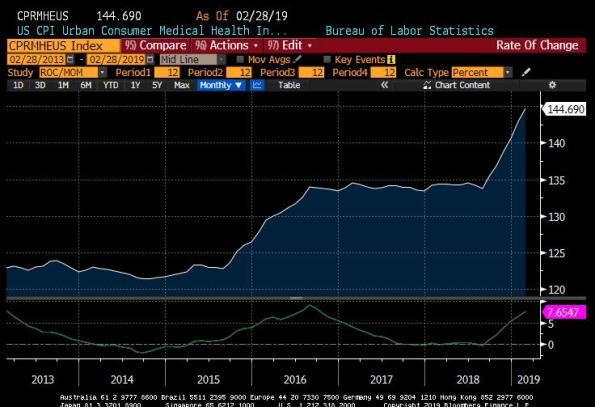
- OK on to other things. Medical Care rose to 1.92% y/y vs 1.72% last mo. Every month it’s something different m/m tho. It was Pharma. Then Doctors’ Services last month. This month Dr Svcs bounced a little but Hospital Svcs -0.46% m/m. And Hosp Svcs is lgst part of Med Care.
- Core ex-housing was unchanged at 1.1% y/y. That’s actually surprising considering the drag from apparel and used cars.
- I may have been wrong on Used Cars being very surprising though. Guess there must be some uncaptured seasonal issue because y/y actually rose (meaning last April was also awful). And this is right on model. So I retract my concern about Used Cars.

- Biggest category drops on the month: Men’s and Boy’s Apparel (again), Footwear, Processed Fruits and Veggies, and Used Cars and Trucks. Biggest rises: Motor Fuel, Lodging Away from Home, Jewelry and Watches, and Medical Care Commodities (pharma)
- I skipped ahead to look at my guess for Median. It’s going to be a solid 0.2%, although that will cause the y/y to drop to “only” 2.80%. At least, that’s my estimate…won’t be reported for hours.
- College Tuition and Fees at 3.86% y/y compared with 3.84% y/y.
- Health Insurance doing its health insurance thing again.

- I mean, on housing it’s not ALARMING how fast it’s growing. It isn’t way above our model or anything. It just looks bad compared to what people were expecting given the S&P Corelogic Case/Shiller index.

- In green is the case/shiller y/y. So you can see people why were expecting a slowdown in rents. But you can also see that…it’s not a very good fit.

- That’s not quite fair b/c there’s no lag incorporated…home prices lead rents by ~21 months, so really we shouldn’t even see that impact for a while. Here it is lagged. Still not a good fit though and at times (2011, 2014) the direction of shiller didn’t match even lagged.

- Just a quick market comment…here’s the median CPI vs 10y inflation swaps. It’s going to be very hard to get much more bearish on long-term inflation swaps unless we see SOME signs that inflation is ebbing. So far, no signs at all.

- Four pieces. First Food & energy:

- Next, core goods. Our model has this headed higher, although not huge – maybe 0.5% or 1.0%. Recent deceleration is unsustainable especially in a fractious-trade world.

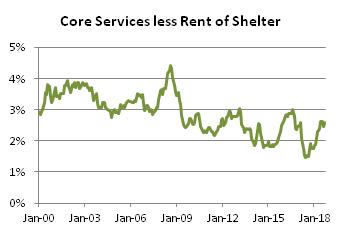
- Core Services less Rent of Shelter. No real change this month. If this is going to go up, it is going to be because medical care rises. To this end, it’s interesting that the previous spikes in Health Care Insurance (shown earlier) preceded spikes in other Medical Care.

- I wonder if the fact that Insurance is a residual means that when it is spiking, it means we’re just capturing prices in the wrong place until the survey catches up. Worth investigation.
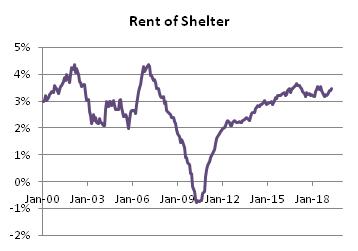
- Finally, Rent of Shelter. Clearly no disinflation here, yet.
- I think that’s good for today. Don’t forget to stop by my blog (http://mikeashton.wordpress.com ), though I must admit I’ve been slack recently in writing – but that’s because business is very exciting right now. A little tariff, a little MMT talk, and the phone rings.
The upshot of all of this is that core CPI continues to give a bad read on where inflation has been. Core tells us that inflation is ebbing. But the median category in fact has been steadily rising for several years. That doesn’t mean the inflation dynamic won’t roll over, but merely that so far it has not. The Fed’s concern that inflation isn’t getting to its target is misplaced, although ironically if they are able to restrain interest rates then the velocity dynamic means inflation is probably not far from peaking. But I don’t think we know that yet.
Summary of My Post-CPI Tweets (April 2019)
Below is a summary of my post-CPI tweets. You can (and should!) follow me @inflation_guy. Or, sign up for email updates to my occasional articles here. Investors with interests in this area be sure to stop by Enduring Investments or Enduring Intellectual Properties. Plus…buy my book about money and inflation. The title of the book is What’s Wrong with Money? The Biggest Bubble of All; order from Amazon here.
- CPI in under 10 minutes. Gentlefolk, start your engines!
- Start with the consensus: this month economists are calling core 0.18% m/m, and 2.1% y/y.
- Remember that last month, core was 0.11%, in a downside surprise driven by pharmaceuticals and autos, while Rents were actually somewhat bubbly again.
- However, Median inflation turned out to be 0.26%, pushing y/y to basically tie the post-crisis highs at 2.77%.
- That should lead you to suspect that there were some ‘tail effects’ last month that could be reversed this month. So that would make me marginally bullish this number, all else equal.
- Now, there’s talk about the fact that the BLS is changing its collection method for Apparel to use a direct feed from retailers rather than manual price-sampling.
- Some people think the change in the method of collecting Apparel prices should depress Apparel, but I’m not really sure why that would be so unless there was some systematic bias in collections pushing prices higher.
- If so, I’m not sure it’s showing. Apparel is -0.76% y/y. In any event, Apparel is only 3% of CPI so effect should be quite small. And apparel recently has been weak. So I’m not too worried about that. Famous last words, I guess.
- Core prints at 0.1%, 2.0% y/y. But that’s not as weak as it looks. It was actually something like 0.148%, whereas market was looking for 0.18% or so…y/y is 2.04%. So both barely rounded down.
- last 12 months’ core CPI chart. Just bumping sideways. We ought to be back to 2.1% y/y next month, as we drop off a weak April 2018 print.

- Well, trust the bow-tied set, I suppose. Apparel -1.94% m/m, -2.2% y/y. I guess those manual price checkers were pushing prices up, after all. (?)
- And CPI for Used Cars and trucks, second month in a row, weak at -0.38%. That’s lower than Black Book (which has been a much better fit than Manheim since last year’s methodology change) suggests it should be.

- But more importantly and lastingly – rents remained firm, with primary rents +0.42% m/m and OER +0.32% m/m. That keeps OER stable y/y and raises Primary rents to 3.68% y/y.
- Primary rents y/y. Not sure if this is an aberration because I don’t track market rents. Seems unusual for late in the cycle, but wage growth has been strong and supports this dynamic. But seems a bit strong.

- Pharma bounced, rising to -0.39% y/y from -1.19% y/y. But the downtrend doesn’t seem terribly damaged.

- Core ex-housing drooped a little bit, not surprisingly given the breakdown. Core ex-shelter is 1.10%, down from a 1.54% November high but still well above the 2017 lows of 0.53%.
- Interestingly, like last month where Used Cars fell and New Cars gained, the same thing happened this month. Used cars & trucks went to 0.44% y/y vs 1.11%; New cars to 0.72% from 0.29%. A little odd, but just wiggles.
- Although Medicinal Drugs re-accelerated slightly, Professional Services (doctors)) decelerated to 0.39% from 0.97% y/y, as did Hospital and related services (1.94% from 2.12%). As a result, Medical Care WOULD have decelerated but for Health insurance.
- Always worth a reminder: health insurance in the CPI is a residual, since CPI measures only the portion of medical care that individuals pay directly. But it rose to 9.06% y/y from 7.66%.

- Near and dear to my heart, the CPI for College tuition and fees continues to accelerate. 3.44% vs 3.00%. Why yes, funny you ask. We DID have something to do with creating the S&P Target Tuition Inflation Index. https://us.spindices.com/indices/multi-asset/sp-target-tuition-inflation-index …

- This chart is why we like to ignore core and focus on median. Clearly a lot of left-tail stuff going on.

- Primary rents y/y. Not sure if this is an aberration because I don’t track market rents. Seems unusual for late in the cycle, but wage growth has been strong and supports this dynamic. But seems a bit strong.
- So, having said that…my early guess at median CPI is for +0.27%, which would push median to 2.85%, clearly the highest since the end of the crisis. We will have to wait a couple of hours for the official figure.
- Four pieces. Not much change this month except in the last piece. Here’s Food & Energy.

- Piece 2: Core goods. Dragged down by used cars, pharmaceuticals. Our models have this still going higher so I think these are one-off effects.

- Core services less rent-of-shelter. Doctors, hospitals dragging this down. Be wary if Medicare-for-all proposals start to gain traction; if they do then I’d suspect doctors and hospitals would start to raise prices before their prices get fixed or cut.

- Part 4 is Rent of Shelter. I’ve been saying forever that we’re not getting deflation because this isn’t about to fall off a cliff. On the contrary, it’s actually moved above our ensemble model.

- So, here’s our ensemble model for OER. Primary rents are actually a [little] bit above our model. As you can see, we’re expecting a gradual slackening of rental pressures. BUT…

- …but our model based on income (not shown) rather than home prices is actually calling for higher rents. You can argue that higher wages have helped produce these higher rents.

- But if that’s the case, it means that when inflation is actually rising, looking back at home prices is NOT the right way to do it. Indeed, if the wage hypothesis is the driver then we’d expect to see a divergence in Primary and OER rents that leads shelter costs higher.
- ..there’s no real sign yet that primary rents are accelerating way past OER, but it’s something to keep an eye on if rent inflation continues to surprise on the upside.

- That’s all for now. Thanks for tuning in.
The upshot of today’s report is that while there are lots of small one-offs that are making sharp moves lower, and each of them has the potential to cause month-over-month mischief, the broad body of prices is remaining stable and/or edging higher. Regardless of what happens to apparel (Women’s and Girls’ Apparel, Men’s and Boys’ Apparel, and Footwear accounted for the three largest declines this month) or used or leased cars and trucks, housing costs appear to be moving higher.
It is early to be certain about this, but there have been anecdotes about faster rent growth in places and there are some signs (as in the rent chart above) that these pressures are diffusing more broadly. With strong wage growth, it wouldn’t be terribly surprising if there was more household formation (there has been, although not a huge amount) and more pressure on rents as people move up. How this resolves is key to the medium-term outlook. If higher wages help to push rents higher, and continue to put downward pressure on the number of existing homes available for sale (see below, source Bloomberg), then core inflation is simply not going to droop lower in the way the Fed expects it will. If, on the other hand, this is just a temporary rise, then the one-off declines in core inflation will eventually be joined by soggy rents and core will drift somewhat lower.
 Either way, I see little chance that core or median inflation will even remotely approach the lows from the last cycle, even if we enter recession later this year as I expect. To get there, housing would need to implode again and the dynamics are simply too healthy for that at the moment.
Summary of My Post-CPI Tweets (March 2019)
Below is a summary of my post-CPI tweets. You can (and should!) follow me @inflation_guy. Or, sign up for email updates to my occasional articles here. Investors with interests in this area be sure to stop by Enduring Investments or Enduring Intellectual Properties. Plus…buy my book about money and inflation. The title of the book is What’s Wrong with Money? The Biggest Bubble of All; order from Amazon here.
- About 6 minutes to CPI. Consensus calls for 0.2% on core. The last few have been 0.20, 0.23, 0.18, and 0.24.
- y/y core should stay at 2.2% after rounding – We are dropping off 0.174% and it would take a really weak figure to push y/y lower and a really strong one to make it round to 2.3%.
- Last month, one of the big drivers was primary rents. Pundits saw last month’s CPI as very strong; I thought it was only slightly above expectations.
- It’s surprising to see the forecasts at 0.2% on core, actually, given the narratives about how strong that inflation figure was, and how it came from Rents that many forecasters are bearish on. I thought we’d see 0.1% forecasts.
- So we’ll watch primary rents of course, but I still think the trend in core goods is an interesting one to watch. Last month y/y core goods reached the highest level since 2013. Just barely out of deflation, but with the trade situation that’s where we want to watch.
- So, here we go. Good luck all.
- Yep, there we go. Core CPI only 0.11%, making the y/y 2.08%. Just when pundits were finally thinking inflation could be a “problem,” and stopped forecasting weakness…we get weakness!
- Last 12. You can see why people were worrying if you cover the last bar. But the uptrend was not as big as it looked. And we’re really just bumping along in the 2.1-2.3% zone on core.


- There are some interesting crosscurrents in this number. Remember how I said Rents were strong last month? They were again this month. Y/Y Primary rents rose to 3.51% from 3.43%; OER went to 3.32% from 3.21%. Lodging Away from Home another jump.
-
These guys are gonna take all the fun out of live analysis. 🙂 https://t.co/P5Sd3M0YOG
— Michael Ashton (@inflation_guy) March 12, 2019
- Other Goods and Services were +0.54% m/m, which is a big jump for a catch-all category. Worth drilling deeper. Medical Care and Recreation had big drops.
- Core Goods dropped to 0.1% y/y from 0.3%. A significant contributor there was a decline in CPI-Used Cars and Trucks, which fell to 1.1% from 1.6% y/y. That’s not as big a deal as you think. But it’s big enough to matter at the margin in core goods.

- Our model has core goods rising a bit further, and you can see that even a simple look like a correlation with core import prices suggests we should see a bit more. And with tariffs, hard to think the dip in core goods sticks.

- I mentioned Used cars and trucks fell, but New vehicles rose to 0.29% y/y from 0.04%, reversing last month’s decline. Overall, used and new together (which is 7% of CPI!) fell to 0.49% from 0.92%.
- Now let’s look at medical care. 1.73% y/y from 1.90% for the broad category. Medicinal drugs fell to -1.12% y/y from -0.36%. Again, core goods. Actually I wonder what core goods ex pharma and cars must have been doing so core goods only fell to 0.1% from 0.3% y/y!
- Now this is really interesting. Pharma as I said was negative, and is continuing an amazing trend. But think this looks amazing?

- Here’s what the pharma looks like in terms of level. Medicine prices have peaked? Is the move to biologics, which tend to be cheaper, accelerating and causing this? Or…

- …or is this just another period like 2012-2013, when we had a temporary slowdown (driven by medicare if I recall) but then caught up? FWIW, my guess is that this slowdown represents a real evolution in care, though I don’t think we’ve seen the end of pharmaceuticals.

-
That could be part of it, definitely. https://t.co/olh1fW7N2z
— Michael Ashton (@inflation_guy) March 12, 2019
- Back to Medical Care: Professional Services fell to 0.97% from 1.16% y/y; Hospital and Related Services decelerated to 2.12% from 2.44%. This is helping hold down core services generally. But Health Insurance (which in CPI is a residual) rose smartly. Now 7.66% y/y from 6.46%.
- Here’s health insurance. Only 1.1% of CPI, which is one way you know it’s just a residual. CPI accounts for the increase in care costs mostly directly so this chart doesn’t show the full story of what’s happening in insurance. But it’s a cool chart.
- College Tuition and Fees rose to 3.13% from 2.93%. It has started to rise again partly because market returns were worse last year (60/40 was -2.4% and many other asset classes declined too).

- (When endowment returns suffer, tuitions accelerate. This is why we invented the S&P Target Tuition Inflation Index. https://us.spindices.com/indices/multi-asset/sp-target-tuition-inflation-index … )
- FWIW, Postage is +5.89% y/y. Not sure I would read a lot into that. 🙂

- Biggest declines on the month, with annualized rates of change: Car and Truck Rental (-57%), Jewelry and Watches (-34%), Leased Cars and Trucks (-18%), and Medical Care Commodities (pharma) (-11%).
- Biggest increases on the month, with annualized rates of change: Misc Personal Goods (52%), Men’s and Boys’ Apparel (50%), Infants’ and Toddlers’ Apparel (33%), Fuel Oil and Other Fuels (21%).
- This month we will again be reminded why looking at Median CPI matters. My guess at Median CPI is 0.26%, which would bring y/y back up to 2.78%. Won’t know for a few hours.
- Lest we think that inflation markets behave rationally…here are 10-year inflation swaps in red, against current median CPI. Calling for a lot of deceleration that we’re not seeing in the data yet.


- Core ex-shelter declined this month to 1.18% y/y from 1.39%. OK, so that’s one place we’re seeing deceleration. So you might say that inflation markets are betting on a serious deceleration in housing inflation.
- Well, we see a slowdown in OER, but not such a large one that long-term inflation swaps look fair.

- So for the cherry on top here are the four pieces charts. Each one is about a quarter of CPI, plus or minus, in order of least stable to most. First is Food and Energy.

- Second piece is core goods. Setback this month, but I’m not convinced that used cars and trucks are leading the way on this series at the moment.

- Core Services less Rent of Shelter. Here’s where the disinflationists need to make hay. And medical care inflation is helping them. Hard to see anything but a downtrend here at the moment.

- On the other hand, Rent of Shelter – the most stable component – continues to NOT COLLAPSE as some are expecting it to. Yes, shelter costs are outrunning wage growth. But not so much any more, thanks to accelerating wages.

- Actually, that wages/rents thing is a bit of a canard. Here is the Atlanta Fed’s Wage Growth Indicator vs Rent of Shelter. Wages have actually been keeping up fine with housing inflation. (& the increased cost of housing is one reason people are fighting for higher wages).

- In conclusion, until I think of something else: last month CPI wasn’t as strong as people thought; this month is isn’t as weak as people think. With interest rates soggy the risk of a serious inflation debacle in this stroke of the economic cycle is receding. However…
- …however, I do think that we are unlikely to see in the next recession anything like the dip we saw in the last recession. There’s a lot of good news in the figure right now. And when interest rates start to rise again, we’re going to see a higher high.
Summary of My Post-CPI Tweets (February 2019)
Below is a summary of my post-CPI tweets. You can (and should!) follow me @inflation_guy. Or, sign up for email updates to my occasional articles here. Investors with interests in this area be sure to stop by Enduring Investments or Enduring Intellectual Properties. Plus…buy my book about money and inflation. The title of the book is What’s Wrong with Money? The Biggest Bubble of All; order from Amazon here.
I usually post these the day of CPI but I was traveling and didn’t get to do so. These were my tweets in the immediate aftermath of the CPI report.
- About 15 minutes to CPI. Today’s stream-of-consciousness will be a little more relaxed since I’m at a conference in Florida at the moment!
- As for the number today, here are some thoughts.
- We’ve recently begun to see some reduction in pressure from truckload rates upstream. Not down, but rising more slowly. Bottlenecks in overland are easing somewhat. Higher prices are still passing through but less alarm about it.
- Housing price increases have also been slowing. Again, we’re talking second-derivative stuff; they aren’t falling nationwide. Rents are loosely related to prices, so I don’t think we’ll see much downward pressure there yet, but it’s a meme at the moment.
- Wage growth remains strong, but wages lag inflation so that’s not much illumination.
- There is decent momentum in some other categories, and…tariffs. Remember we don’t need tariffs to get worse growth/inflation outcomes than the last 20 years; we just need less forward progress on trade. And we have that for sure! (Again with the second derivatives??)
- I’ve been expecting an interim peak in median CPI later in 2019. It’s not here yet, and I might still be wrong about that and see it climb further. Inflation after all is a process with momentum. But that’s my current expectation.
- However, I ALSO don’t expect that when median CPI eventually turns lower that it will fall anywhere close to the prior lows. I think we’ve begun a long-term cycle of higher highs and higher lows in inflation.
- Now, money growth is picking up again, and higher rates over the last year imply higher velocity going forward. But globally we have more negative-rate debt, so that’s dampening. But the macro pressures on inflation remain to the positive side.
- For today, the Street sees 0.2% on core, dropping y/y to 2.1% because drop off a difficult +0.3% comp from last January. The January figure sees a number of interesting cross currents. I suspect there’s a smidge of upside risk to this number, but I have low confidence on that.
- We will see, in 5 minutes.
- ok, 0.24% on core CPI, a bit higher than expected and BARELY kept core from rounding lower to 2.1%, even dropping off the strong Jan 2018

- 15% is core to 2 decimal places y/y.
- Primary rents 0.31% m/m after 0.21%, but y/y still declined to 3.43% vs 3.47%. As I said, rents only loosely related to prices and rent slowing has still been only at the margin.
- Owners’ Equiv Rent was 0.27% vs 0.22% last, with y/y unchanged at 3.21%. So the big chunk of housing was reasonably strong. Actually Lodging Away from Home, which had a very large jump last month, had another decent rise this month. It’s only 0.9% of CPI but no “AirBnB” effect.
- So the macro interesting thing is that core services declined to 2.8% y/y, thanks to the gradually slowing housing I think, while core goods rose to 0.3%.
- That’s the highest core goods since 2013. Our models think this is headed up to 0.5% before flattening, but … tariffs. Our models don’t include them. This is the underlying pressure.

- OK, so Apparel is 0.11% y/y, basically unchanged. Jump this month, but that looks seasonal. Medical care declined to 1.90% y/y vs 2.01%. Recreation rose to 1.36% vs 1.14%.
- There was some chatter that a change the BLS made in how it accounts for quality change in some communications categories could drag down the CPI like cell phones did last year, but it’s a much smaller effect. Education/Communication was 0.31% y/y vs 0.21% last month.
- Sorry for the interlude…some tech glitch. Anyway…picking up. Education was 2.72% y/y vs 2.62% last month; Communication was -1.68% vs -1.76%. So the rise in Education/Communication was from both parts.
- Not so in Medical Care. Medical Care Commodities were -0.28% vs -0.50%; Med Care Services 2.45% vs 2.64%. So the overall small decline in Medical Care (1.90% vs 2.01% y/y) was basically entirely from the “Hospital and Related Services” category (2.44% vs 3.64%).
- The other Medical Care categories – medicinal drugs, Professional Services, and Health Insurance – all rose. But they were counterbalanced by the Hospital part.
- Median this month might be really interesting. Rough calculation suggests that a housing sub-category that Cleveland Fed calculates might be the median category so it’s hard to tell. But I think Median y/y will drop from 2.77% to 2.64%. Might even be worse.
- Core ex-housing fell to 1.39% from 1.51%. So, there’s definitely some signs of softness here even though Core Goods is providing upward pressure. Working on the 4-pieces breakdown now.
- Core ex housing chart. Sorry not too many charts today. Little harder to do remotely.

- OK the four pieces. For those new to this analysis, I break CPI into these four pieces, each roughly 1/4 of CPI (19%-33%).

- Here are the four pieces, from most-volatile to least-volatile. Part 1 is Food and Energy. Clearly holding down headline CPI but this is why we look through it. Look at that y axis!

- Part 2 is Core Goods. With the trade frictions, this is presently the most interesting piece. Even if the tariffs implemented by the Administration are dropped, we’ve still stopped the forward trade momentum of the last quarter century. So this bears watching.

- Core Services less Rent of Shelter. A lot of this is Medical Care, and while it looked like we might be breaking the long downtrend recently…maybe not so much.

- Finally, rent of shelter. Off the highs, but our models don’t have it dropping seriously. Housing prices still rising, albeit more slowly. And rents, while high relative to wages, are now getting a following wind from rising wages. I suspect this will meander.

- OK, that’s all for now and more than I expected from Florida. Stop by my blog at http://mikeashton.wordpress.com , or our company site at http://www.enduringinvestments.com . Have a nice day.
It seems, from reading the other post-mortems, that some people saw this as a very strong number. It really wasn’t…slightly stronger than expected. But I guess it depends on your state of mind coming in. I’ve thought the underlying run rate of core CPI was something like 0.22% per month, and with seasonal issues in January thought we’d be a touch higher than consensus. I suppose if you thought inflation was falling off a cliff you might have expected something much weaker. The composition, too, was solid but unspectacular. Again, if you thought rents were about to collapse then you were surprised that it was only down a little on a y/y basis. The core goods rise is important, but again – not unexpected.
So is inflation running “hot”? Well, if you think 2.2% is hot, I suppose so. But Median CPI also declined on a y/y basis, as have wages recently. Don’t get me wrong, I think inflation is still rising and probably will for most of this year. But it’s not shooting higher and if I were at the Fed and if I believed what they believed, I wouldn’t be alarmed by this number (I am not at the Fed and I don’t believe what they believe, for the record).
Summary of My Post-CPI Tweets (January 2019)
Below is a summary of my post-CPI tweets. You can (and should!) follow me @inflation_guy. Or, sign up for email updates to my occasional articles here. Investors with interests in this area be sure to stop by Enduring Investments or Enduring Intellectual Properties. Plus…buy my book about money and inflation. The title of the book is What’s Wrong with Money? The Biggest Bubble of All; order from Amazon here.
- A few minutes to CPI. Consensus 0.2%, 2.2% y/y on core, pretty much on the dot. That’s slightly lower on core than last month, which ALMOST rounded to 2.3%, but dropping off a strong Dec ’17. Remember Median is 2.82%, near the highs.
- it will be hard to get a ‘handle surprise’ on core CPI today. But watch Apparel, which has been weirdly weak despite tariff tensions. Used cars/trucks has been strong for a couple months and is due to be back normal, but not to “retrace” as it was too low before.
- In general, look at core goods, which last month went flat after a long time in deflation. And keep an eye on core-ex-shelter, which is near multi-year highs.
- 21% on core, 2.21% y/y. Basically a consensus number.
- Pretty stable last few months of core.

- Core goods 0.1% y/y, down from 0.2% y/y last month. Core Services unch at 2.9% y/y.
- Core goods right on schedule.

- OER 0.23% m/m, dropping y/y because of base effects back to 3.22%. Had been a y/y bounce last year because of those base effects but now pretty much back to trend. Primary rents 0.20%, 3.48% y/y, also down.
- Inflation bears will point at “Lodging Away from Home,” +2.74% m/m, and say that is an aberration. But it’s really just reversing a very weak recent aberration. Y/y up to 0.91%; had been -1.37%. So ignore those people.
- Pharma was weak, at -0.43% m/m and -0.58% y/y.

- Doctors services also remains fairly low. Hospital Services however accelerated to 3.67% y/y from 3.52% y/y. Overall, Medical Care was roughly steady at 2% y/y.

- Used Cars and Trucks was -0.18%, dropping y/y to 1.43% vs 2.30%. It was due to decelerate, and that’s roughly in line.

- Apparel is back to positive y/y, at +0.3% vs -0.6%, but that’s mostly base effects. Only very small rise this month. That continues to be a head-scratcher. I’d expect to see trade frictions show up in apparel quickly. But this is a Dec number, and so maybe stockpiling pre-xmas.
- Core ex-housing was 1.50% y/y, down slightly from 1.53% y/y last month. That remains near 5-year highs, but still waiting for the break higher.
- Core ex-shelter chart.

- By the way, if you have kids I hope they’re girls. In apparel, Boys’ apparel is +13.1% y/y…Men’s footwear is +4.3%…nothing else is over +0.5%.
- Recreation is a pretty small part of CPI (5.7%), but rose from 0.61% y/y to 1.16% y/y. Inflation in Cable and Satellite Services, Pets and Pet Products, and “Admissions” were the main culprits. Pets are “recreation?” I think of them more as Transportation. Or Food.
- Just kidding.
- College Tuition and Fees +2.7% y/y, up a small amount but continuing to run ahead of headline and core.
- Looks like a regional housing index will be the median category this month, which means my median guess isn’t as sharp. My estimate is 0.23% m/m, making the y/y 2.80% down from 2.83%. Median is a better measure of inflation trend since it ignores outliers.
- This is an important chart. It shows Median CPI (without today’s number, not out yet) vs 10-year inflation swaps. You can see how bearish the market has gotten recently. Some of this is oil but these are 10y swaps so that shouldn’t matter much.

- I almost forgot to mention that Wireless telephone services weakened again to -3.19% from -3.03% y/y. More interestingly, Land-line went to -0.02% from 0.46%. Even more interesting, land-line spending is only about a third as large as wireless. Here’s a chart of landline.

- Let’s wrap this up with the four-pieces charts. First piece is food & energy. Weirdly linear deceleration.

- The piece I think is a very important story going forward: core goods. Out of deflation and I think it’s going higher. This is where trade tensions are most important.

- Core services less Rent of Shelter…still look to be in a downtrend, mostly thanks to medical. If we’re going to have an inflation accident, it should also show up here.

- Rent of Shelter. Going nowhere fast. And that means you’re not getting deflation any time soon.

- Final thought: next month we drop off a +0.35% m/m from core (from Jan ’18), which means it is pretty likely we see a drop in core towards 2%. That makes a Fed hike harder. But then the comparisons get easier, as my 12-month m/m core CPI chart showed.
- Core is unlikely to drop below 2% any time soon, and in my view we’re likely to see 2.5% before 1.9%, and median inflation above 3% before long. But the Fed has a couple months’ reprieve before the choices get tougher.
- That’s all for today. Thanks for tuning in.
Today’s CPI number is an acceptable one for the Fed. Right on the screws, showing no unanticipated accelerations. But also, no decelerations! Next month, core should decelerate, but that is likely to be the last good news for a while on inflation. Now, there are some reasons to think that the upward trend on inflation might be ending sooner than I have thought, and I’ll get into those reasons over the next week or two. But for now, the story is that the Fed has some breathing room to stop and watch for a while, and avoid some critical Presidential tweets while seeming to be principled. The difficult test will come in a few months when inflation starts heading higher even while growth, and stock markets, head lower. It may well be that we have seen the last tightening for a while – if the Fed Chair were Bernanke or Yellen, they’d already be easing, but Powell seems to be made of sterner stuff (but read my prior post about whether there is a Powell put). However, it has been easy up until now, with growth strong enough to take some hikes, inflation heading the wrong direction, and rates below any semblance of neutral. The next year or two is where the Fed’s job gets difficult as they have to navigate crosscurrents.
Summary of My Post-CPI Tweets (December 2018)
Below is a summary of my post-CPI tweets. You can (and should!) follow me @inflation_guy. Or, sign up for email updates to my occasional articles here. Investors with interests in this area be sure to stop by Enduring Investments or Enduring Intellectual Properties. Plus…buy my book about money and inflation. The title of the book is What’s Wrong with Money? The Biggest Bubble of All; order from Amazon here.
- Been a while since I did a live CPI dive here. Thanks to all of those who voted with their dollars over the last year and supported my private CPI tweets. It wasn’t enough to make a commitment to it, so I’m back to occasionally doing it free on this channel. Hope it helps.
- I do it anyway for myself and Enduring Investments, so it’s not THAT big a deal to put it here if I happen to be in the mood. Anyway, hope you get some value. If so, think about whether I or Enduring can help your investment processes. Now for the walk-up.
- Consensus calls for about 0.18% on core CPI today, with the y/y rising to 2.2%. The bouncy PPI helps the mood although the PPI itself doesn’t have much forecasting power for CPI.
- in PPI there were clear freight and other upstream pressures though. We haven’t really seen much of this in CPI – no real trade/tariff effect yet e.g. Apparel is where I’d expect to see than and in core goods generally. But they’re still slightly in deflation.
- I think there’s some upward risk to used cars and trucks, but there was a big jump last month so we could get a retracement of that before another move higher next month, or continue the ‘catch up’ to private surveys this month. Hard to tell on a month-to-month basis.
- Lodging Away from Home took a dip last month and might be upside risk today. Medical Care is due to start rising again too. So in a minute, we will see!
- Slightly stronger core than expected…0.21% when they were looking for 0.18%. But pretty close.

- 21% on NSA core y/y.
- Let’s see. Core goods went up to 0.0% y/y from -0.1%, so that’s moving in the expected direction. Another big month from Used Cars and Trucks, +2.37% m/m after +2.62% last month. y/y now up to 2.30%. It was negative just a few months ago.

- Lodging Away from Home rose from -2.42% y/y to -1.38% y/y, as we got a small positive this month after a big negative last month. I’m still skeptical that hotel prices are in deflation but someone will yell “AIRBNB” loud enough like that’s an argument, so I’ll leave it there.
- Hefty lift in Primary Rents. +0.36% m/m, bringing y/y to 3.61% from 3.57%. That’s news because lots of pundits have been decrying the end of the housing market and therefore housing inflation. These aren’t necessarily the same thing.
- Apparel actually took another large fall m/m. This continues to make little sense in a tariffy world.

- Some of that is dollar strength, sure. But I’m still surprised.
- Medical was +0.37% m/m after -0.07%, so that came through as I expected/hoped. Y/y rose to 2.03% vs 1.71%. Both Pharma and Doctor’s Services rose nearly 0.5% m/m after declines last month. Interesting that despite this, and housing, core services were unch at 2.9% y/y.
- Core inflation, ex-shelter rose to 1.53%, almost at the 2016 highs (1.61%). The disinflationary impulses are deep in the rear-view mirror now.

- The Apparel breakdown is always so weird. Y/Y, “Boys’ apparel” is +11.9% while “Girls’ apparel” is -0.7%. Hokay.
- Brace yourself for a big jump in Median. Looks like the median category is a housing subindex so my estimate won’t necessarily be accurate but it won’t be LOWER than 0.28% m/m and my best guess is 0.33% m/m pushing y/y median CPI to 2.83%. Won’t know for a few hours yet.
- 83% if it happened would be basically back to the highs. So the question is, what’s keep Core Services from a bigger bounce if housing and medical care are both looking strong?
- Motor Vehicle Insurance? This is 2.4% of CPI.

- Health insurance rising again…we knew this was true on the wholesale level but seems to be coming thru retail as well. But CPI measures health insurance inflation in an odd way, too much to get into here.

- Oh no. Are you kidding me? Wireless telephone services -3% y/y down from -0.5%y/y last month. *smh* Here we go again?

- Currently triumph of hope over experience in stocks. This figure clearly puts the Fed squarely still in tightening mode. And I don’t expect any major easing of inflationary pressures soon.
- Kind of a good reminder of how out over their skis the inflation shorts are here. With Median at 2.7% or 2.8% after today, here’s the core cpi curve from inflation swaps (calculated by Enduring Investments). X-axis is years. Tremendous confidence that the Fed will win.

- Now, to be sure the hurdles for y/y core get higher over the next few months, with Dec ’17 at +0.24% m/m and Jan ’18 at +0.35% (remember that??), so core will probably not reach new highs until Q2. But there’s nothing here to give confidence that inflation is about to fall.
- Let’s do the four pieces. For new followers, these four pieces are each roughly a quarter (0.2%-0.3%) of CPI. The first and most volatile is Food & Energy. We don’t spend a lot of time on this. No forecasting power.

- Piece 2 is core goods, the smallest of these 4 pieces but the main thing that has kept inflation sedated over last half decade. Now out of deflation even with a strong dollar. Sustainable? In a de-coupling world, maybe.

- Core services, less rent of shelter. long downtrend still in place. This includes stuff like medical care, but also wireless services. Which really ought to have its own category I’m starting to think!

- Steadiest piece is Rent of Shelter. This is just coming back to model. No real upstream signs that this is about to roll over – it was just ahead of itself. Latest point is actually an up-wiggle.

- One more chart. The weight of the distribution of y/y changes. You can see the big bars for housing but the long tail. The bar at left is mostly food, energy, tech, and apparel at the moment. Without those categories, CPI is around 2.8%, right around median.

No real reason to wrap this one up – the numbers speak for themselves. Despite the weakness in energy, which is killing the inflation markets (since energy is most of the volatility in headline inflation, to which TIPS and inflation swaps are tied), prices in general continue to rise and if anything seem to be gaining a little steam even outside of housing. Housing inflation isn’t likely to move very far in either direction for a while from the current level, so the next movement in core or median CPI is going to come from core-ex-shelter categories like Medical Care (possibly looking up), Apparel (quite heavy), and other core goods like autos.
But there’s no reason whatsoever in these numbers to indicate to the Federal Reserve that it’s time to stop raising rates. To the extent that they begin to chirp about a pause, it’s because they want stock prices to go up (or, I guess, more accurately they just don’t want to be blamed for the bear market). Yes, growth is slowing but no formulation of the Taylor Rule is going to give a lot of cover to a decision to ease off of rate hikes when the policy rate is below the current rate of inflation.
Summary of My Post-CPI Tweets (October 2018)
Below is a summary of my post-CPI tweets. You can (and should!) follow me @inflation_guyPV and get this in real time, by going to PremoSocial. Or, sign up for email updates to my occasional articles here. Investors with interests in this area be sure to stop by Enduring Investments or Enduring Intellectual Properties. Plus…buy my book about money and inflation. The title of the book is What’s Wrong with Money? The Biggest Bubble of All; order from Amazon here.
- Only 20 minutes to CPI!
- This month, we are looking for something of a correction to last month’s terribly weak and surprising core CPI (0.08% m/m).
- Recall that last month, Apparel plunged -1.6% m/m – which seems at odds with a world of higher landed costs due to tariffs.
- The only way that would make sense is if BLS were backing out the tariffs from the retail prices, but this isn’t like sales tax – no good way to disentangle tariffs since some products have ’em and some don’t.
- So Apparel prices are due for a bounce. That’s well-understood out there in inflation land I think.
- The apparel plunge was the driving force pushing core goods to -0.2% y/y when it had gotten all the way up to 0.0% y/y the prior month. It’s hard to get a lot of inflation without core goods being positive!
- Other parts of core goods remain perky, such as Used Cars and Trucks. Probably some further gains due there.
- The core services component was also soft last month, as OER softened slightly (but it has a big weight) and medical care declined.
- I’m starting to get less confident that Medical Care will have a big upswing because of work I’m doing in pharma inflation. But at the same time, the y/y looks like it may have fallen too far too fast. And I don’t think doctors’ services +0.8% y/y makes a lot of sense.
- All in all, the odds I think favor a solid 0.2% or above. This would cause y/y core to reaccelerate from 2.19% back to the 2.3% range b/c we’re dropping off an 0.13% from last Sept. To get a 2.4% print on core, we’d need 0.29% or better m/m, which is a stretch.
- …but not out of the question if last month’s surprises are totally reversed.
- The bottom line I am really watching is core-ex-shelter, which has been rising and is the key to the next leg higher in inflation. Housing won’t carry the water.
- We’re down to about 12 minutes here before the number and one thing I want to add: more than recent CPIs this is likely a pretty important number for the stock market. Climbing CPI –> higher rates;stocks aren’t handling that well right now. A soft CPI is really good for stocks.
- Ordinarily equities ignore CPI, but maybe not today.
- One last point to make is that even with the weak month last month, core CPI is up at a 2% annualized pace over the last quarter. Median is at 2.5% annualized over the last 3 months. So we’re not talking deflation here.
- Another very soft CPI. 0.116% on core. As that is roughly in line with what’s dropping off from a year ago, y/y core stays about the same at 2.2%.
- First glance is that Apparel bounced but OER was weaker. If that’s true then this isn’t as weak as it looks.
- 2.17% y/y on core, down from 2.18%, so as I said basically unch.
- No doubt however that this is a huge relief to stocks. Even if it is stronger than it looks on the surface, it’ll help take the Fed off the relative boil (not like they’ve been crazy hawkish, just by recent standards)!
- Incredibly, the subcomponents are AGAIN being slow-rolled by Bloomberg and this time looks like that’s because the BLS is being slow releasing the data. Crazy. Someone get them a new laptop.
- Yayy! Finally getting data. So Apparel was +0.93% m/m, which raised y/y from -1.41% to -0.55%. Partial retracement and makes more sense. Only 3% of the CPI basket but a big move makes some difference.
- Ah, here’s the thing. There was a MASSIVE decline in CPI-Used Cars of -2.99% m/m. That’s completely absurd. It puts y/y to -1.47% from +1.25% in that category, pushes core goods from -0.2% to -0.3%, and dampened overall CPI.
- But it makes NO SENSE. Private surveys of used vehicle prices are still rising at around 4% per year. This is complete nonsense.
- Here’s the chart. Used cars had been closing the gap. Again, this is nonsense. And it’s a big enough category to matter some.

- Moving on…OER was only 0.18% m/m, pushing the y/y to 3.27% from 3.33%. Primary Rents were 0.24% m/m, 3.63% y/y up from 3.61%.
- The OER modest deceleration isn’t terribly problematic although home prices are still rising quickly enough that I wouldn’t expect it to get much slower than it currently is. Primary Rents still rising, which puts the cherry on that point.
- Lodging Away from Home plunged -1.01% m/mm, so the y/y dropped to 0.57% from 2.34%. Large moves in that index aren’t terribly unusual, so this isn’t an “AirBnB effect.” Will probably be reversed next month.
- Back of the envelope by the way (and I know I’m refusing to let cars go again) is that Used Cars cost about 0.075% on core CPI. Put that back and your 0.116% becomes 0.191% m/m…right on expectations.
- Medical Care remains weak. Pharma -0.19% m/m, but rises to 1.17% y/y from 0.77% because of base effects. Doctors’ Services 0.26% m/m, with y/y up to 0.46%..not exactly running away. And Hospital Services softened to 3.79% y/y from 4.17%.
- BUT, because of those base effects, Medical Care overall rose to 1.73% y/y vs 1.54%.
- doctors’ services:

- Forgot to update this chart, last 12 core CPI prints. Although, as I said, this one is bogus.

- Core ex-housing, even with the cars nonsense (he really just won’t let it go, will he??), accelerated to 1.38% from 1.34%. That’s still below the 1.5% hit in July, but we’d be just about there without those cars you know.
- Here’s core ex-shelter. If you think the Fed is “going crazy” tightening, it’s because of this. Right about in the middle of the last two decades’ range. But I think it’s heading up.

- All this talk about used vehicles…I should note that New Vehicles rose to 0.47% from 0.30% y/y. Placidly approaching the upper end of the range.

- For something completely different, there was a rise in Cable & Satellite television service this month after a long slide. That’s 1.5% of the overall CPI…about 3/4 the weight of used cars!

- So let’s see…m/m largest declines were …hey! Used Cars and Trucks #1, Footwear #2, and Lodging Away from Home #3. We’ve discussed two of those. Biggest gainers were Mens/Boys Apparel (retracement), Car & Truck Rental (splutter), and another couple of apparel categories.
- Now, here’s why I prefer Median CPI. It’s totally for months like this. Median this month ought to be around 0.22%, meaning y/y should be almost exactly unch at 2.77%. As always, my Median is an estimate, but it should be pretty good this month.
- And that’s the REAL story – inflation continues to motor along at about 2.8%, when measured using an index that isn’t perverted by inaccurate surveys of cars.
- So here’s the summary. Great number for stocks, because they don’t care about the details. It’s not really a soft number, though – all one category. Core goods at -0.3% really ought to be at 0.3% or 0.4% (see chart), and assuming it does converge there we’ll see core CPI resume.

- But you don’t really need Core CPI because Median is already telling you what you need to know: inflation is in the high 2s. The rebound from last year is over, and last few numbers have been basically flat around 2.8%.
- Same story in this chart, showing the weight of categories inflating faster than 3%. It’s pretty steady and has been for a while. This is why we were able to ‘look through’ the 2017 slowdown in core CPI. The middle of the distribution was stable/rising slightly.

- The key question for the next leg, up or down, is what happens to core goods. Housing, as I wrote recently, is not about to accelerate or decelerate in a MAJOR way. The next leg will have to come from other categories catching up.
- With a following wind from clearly-rising wages and “protection” from offshore price competition, this seems very probable. Ergo, I expect Median to be over 3% in the next quarter or two. We’re not talking hyperinflation, but it’s going to keep creeping higher.
- People sometimes ask me, “don’t you think the Fed knows how to look through the CPI to see what’s really going on?” The answer is no, I do not. I’ve yet to find a Fed person who gets very down and dirty with the data in a way that’s illuminating (as opposed to a wonky model).
- OK, to wrap this up let’s look at the four pieces charts and tell the story (for new followers: these four pieces are each around 1/4…actually 0.2-0.33…of overall CPI). First, Food & Energy.

- Next, Core Goods. Already discussed. This should be, and will be, higher.

- Core Services less Rent of Shelter. A lot of this is Medical Care Services and I’m less bullish on that than I have been. It would help the bull-inflation story to see this above 3%, but I’m just not sure it can get there in short order.
- Finally, Rent of Shelter. It’s probably a bit below where it should be, but as I recently wrote it’s not going to be doing anything dramatic here for a while.

- That’s all for today. I just want to conclude by saying that it is a NATIONAL EMBARRASSMENT that we can’t accurately measure the behavior of used car prices. Not to put too fine a point on it.
Summary of My Post-CPI Tweets (July 2018)
Below is a summary of my post-CPI tweets. You can (and should!) follow me @inflation_guyPV and get this in real time, by going to PremoSocial. Or, sign up for email updates to my occasional articles here. Investors with interests in this area be sure to stop by Enduring Investments or Enduring Intellectual Properties. Plus…buy my book about money and inflation. The title of the book is What’s Wrong with Money? The Biggest Bubble of All; order from Amazon here.
- OK, 15 minutes to CPI. Here goes.
- Last mo, we had an 0.17% on core m/m, exactly on expectations but after a weak 0.10% in April.
- The Dec/Jan 0.24%/0.35% seem far away, but even farther away are the 0.14%s of last June and July. That is, comps remain relatively easy.
- Really no big surprises last month. Still haven’t seen core goods acceleration or any sign of tariff effects. Core ex-housing is rising but still quite low.
- In fact, I think the big story going forward, not this month per se but for the balance of the year and 2019, is what happens to core goods prices. With trucking prices rising aggressively, tariffs up and globalization down, I’d expect to see movement there.
- In that vein, keep an eye on Apparel, which though small is an important signal on core goods.
- This month, economists are looking for 0.18% on core, pushing y/y JUST BARELY to 2.3% with rounding. The consensus nailed it last month.
- My thesis is that we should be seeing more core inflation than that going forward. So far, that thesis has been unrewarded but I really didn’t expect a whole lot to come through until the second half. This first half was just catching up from base effects of 2017.
- You can see that median is basically back on the slow uptrend from 2014-15-16-17. Inflation will keep rising. The only question (which would be a scary outcome) is whether it accelerates past that former trend into a new self-feeding inflation cycle. No sign of that yet.

- Just 5 minutes til showtime.
- 16% m/m on core, just barely pushing y/y to 2.3%, 2.255% to three decimals on the NSA core index…
- Bloomberg being really slow posting subcomponent info.
- Here’s the last 12 core CPIs. Certainly nothing seems terribly alarming here on the surface.

- OK, Bloomberg. Gonna scrape the data myself. BRB.
- Breakevens are unimpressed. 10y breaks were +1 before the number, mostly a reaction to the energy plunge and rebound, and are +0.5 now. But sometimes takes a bit for people to dive into the numbers.
- ..so we see Used cars and trucks are +0.72% m/m, yay! Finally some movement. Still -0.66% y/y, so not showing the inflation of the private surveys. Private surveys have noted some shift in used car composition, and it may be that the BLS just isn’t correcting for that.
- Owners’ Equivalent Rent was +0.25% m/m for the second month in a row, but that caused y/y to decelerate to 3.37% from 3.41%. That’s interesting because last month the rise in OER was a big chunk of the rise that we got so…something else was moving this month.
- Primary Rents also decelerated, to 3.58% from 3.63%. That’s actually lower than the y/y has been for a while as this continued to decelerate. But it’s not going to collapse while housing prices continue to boom.
- Medical Care accelerated further, to 2.45% from 2.38% y/y. That’s not as big a jump as last month, but it’s the right sign. Still low. Pharma retreated a bit but doctor’s services picked up the slack.

- Apparel dropped on the month, pushing y/y down to 0.6% from 1.4%. So canary on core goods is still chirping.
- Bloomberg still hasn’t updated the core goods and core commodities figures…odd. Anyway, they’re -0.2% on core goods (tiny acceleration) and 3.1% on core services (tiny acceleration) on a y/y basis.
- Lodging Away from Home, which surged last month to 4.4% y/y, plunged to 1.6% y/y this month.
- Core ex-shelter rose to 1.41%, highest since mid-2016. That’s still low, but it’s what we want to watch along with core goods. It hasn’t been above 2% since 2012. Hasn’t even been close.

- This is interesting…wireless telephone services inflation is positive. It’s not like that NEVER happens but this time we might go higher. After you go to infinite data…how do you improve quality dramatically? And it’s quality that drives this series lower.

- Core goods’ rise is encouraging for inflation…but still a ways to go before it gets to +1%. However it’s on model at the moment.

- Will have the four-pieces charts in a moment. But while I’m waiting on the calculator…this month’s data is interesting because it was not housing. Some of the rise in core was due to new and used cars rebounding, but not enough to offset the deceleration in housing. >>
- That may mean that inflation is broadening to more categories outside of the ones that have been driving inflation for a while. Core ex-shelter’s rise is something to watch. That’s what inflation actually looks like – it’s not dramatic, and not isolated in a few categories.
- inflation markets are tres unimpressed. 10y breakevens now down on the day.
- We’re not really seeing a broadening in this diffusion measure, so it may just be that the left-tail deflationary stuff is going away. A tightening of the distribution, that is.

- OK four pieces. Piece 1: Food & Energy. Good for owners of TIPS, but mean-reverting so we mostly ignore for forecasting.

- Core goods, Piece 2, I’ve already shown. Rising and will keep rising.

- Piece 3: Core services less rent of shelter. Starting to look interesting. The 3% level is key.

- Piece 4: Rent of Shelter. Still elevated. It’s done the heavy lifting on inflation for a while and probably won’t do much more for a while. Continued acceleration in core will rely on ex-shelter core services, and on core goods. Both of which seem to be rising.

- Bottom lining: Once again, no big surprises here and nothing that will alter the Fed’s trajectory. But the underlying pressures here are pretty clear and show no signs of waning. We are not going to gently converge on 2% core PCE.
- What I said at the beginning remains the key question: are we just going back to the rising – but slowly rising – inflation trend from 2014-2017, or will we start to accelerate above that trend?
- Acceleration above that trend would be very concerning, unless it was caused by one-offs (like cell phones and other one-offs caused the 2017 departure on the downside). It would indicate that inflation has moved into a self-reinforcing phase.
- I suspect that’s where we are headed. But so far, the evidence that we are there doesn’t exist (there’s no contrary evidence either – it’s just unknown at this point).
- Early look at median…my estimate is 0.23% m/m. If I am right, this takes the y/y to 2.80%. This will be really dramatic!
Summary of My Post-CPI Tweets (June 2018)
Below is a summary of my post-CPI tweets. You can (and should!) follow me @inflation_guyPV and get this in real time, by going to PremoSocial. Until the end of June, you can get $9.99 off (one month free, or a discount off the already-discounted annual plan) by using code “tryme”. Or, sign up for email updates to my occasional articles here. Investors with interests in this area be sure to stop by Enduring Investments or Enduring Intellectual Properties. Plus…buy my book about money and inflation. The title of the book is What’s Wrong with Money? The Biggest Bubble of All; order from Amazon here.
- 27 minutes to CPI! Here are my pre-figure thoughts:
- Last month (April CPI) was a big surprise. The 0.098% rise in core was the lowest in almost a year, rewarding those economists who see this recent rise as transitory. (I don’t.)
- But underneath the headlines, April CPI was nowhere near as weak as it seemed. The sticky prices like housing were stronger and much of the weakness came from a huge drop in Used Cars and Trucks, which defied the surveys.
- Medical Care and Apparel were also both strong last month.
- Now, BECAUSE the weakness was concentrated in a small number of categories that had large moves, median inflation was still +0.24% last month, which drives home the fact that the underlying trend is much stronger than 0.10% per month.
- The question this month is: do we go back to what we were printing, 0.18%-0.21% per month (that’s the 2 month and 6 month avg prior to last month, respectively), or do we have a payback for the weak figure last month?
- To reiterate – there were not really any HIGH SIDE upliers to potentially reverse. Maybe housing a touch, but not much. To me, this suggests upside risk to the consensus [which is around 0.17% or so and a bump up (due to base effects) to 2.2% y/y].
- I don’t make monthly point forecasts, but I would say there’s a decent chance of an 0.21% or better…which number matters only since it would accelerate the y/y from 2.1% to 2.3% after rounding. So I agree with @petermcteague here, which is a good place to be.
- Note there’s also the ongoing risk each month of seeing tariffs trickle through or trucking pressures start to diffuse through to other goods prices. Watch core goods.
- So those are my thoughts. Put it this way though – I don’t see much that would cause the Fed to SLOW the rate hike plans, at least on the inflation side. Maybe EM or something not US economy-related, but we’d have to have a shockingly broadly weak number to give the FOMC pause.
- Starting to wonder why we even both with an actual release. Economists nailed it, 0.17% m/m on core, 2.21% y/y.
- That’s a 2.05% annualized increase. Which would be amazing if the Fed could nail that every month.
- Core goods accelerated to -0.3% from -0.4%, so the jump there hasn’t happened. Core services moved up to 3.0% from 2.9%. That is the highest core services since Feb 2017, but not absurd.
- still waiting on core goods acceleration…

- Used cars and trucks again dropped sharply. -0.89% after -1.59% last month. That’s m/m. The y/y is -1.68%. Again, that’s at odds with all of the private surveys and is a big disconnect. I can’t explain it.
- Owners’ Equiv Rent put in another solid month +0.25% m/m, up to 3.41% y/y. Starting to get a bit ahead of our model again.

- Large jump in lodging away from home, 2.93% m/m. That takes the y/y to 4.29%. LAFH is only 0.9% of CPI, but that’s an outlier that will probably come back next month.
- Medical Care scored a solid 0.2%, accelerating to 2.38% y/y.

- Pharma (3.73% vs 2.65%), Doctor’s Services (0.55% vs 0.31%), and Hospital Services (4.74% vs 4.49%) all accelerated.
- Apparel was flat on the month, but that moved y/y up to 1.4% vs 0.8%.
- Neither stocks nor breakevens care about this figure. Summer has set in. It used to be that the summer lull was a couple of weeks in August. Then it went to all of August as the US mirrored Europe. Now it pretty much starts in June and lasts until Labor Day.
- I forgot to mention Primary Rents, by the way. They actually decelerated to 3.63% y/y from 3.70%, which takes some the sting out of a potential OER reversal. The Primary Rents move was countertrend so it should also retrace next month. But only 1/3 of the weight of OER.
- The Primary Rents move does tend to reinforce the message of our model, that OER is a tiny bit out over its skis. However as that chart illustrated, it can diverge a bunch from our model.
- Biggest m/m declines were in Car and Truck Rental and Public Transportation (what’s up with vehicles??), followed by Mens and Boys’ Apparel. I’ve mentioned Used Cars and Trucks. Household Furnishings also weak.
- Biggest m/m increases are the aforementioned Lodging Away from Home, Infants and Toddlers’ Apparel, Motor Fuel, and Medical Care Commodities (mostly Pharma).
- All of the median categories are Rent and OER subcategories which are hard to get a read on, but median should again be mid-0.2s, probably 0.26-0.27% m/m pushing y/y to nearly 2.7% on Median CPI! Last mo was highest since 1/09; this would be highest since 2008.
- This is median BEFORE today’s figure, which will come later. And I could be wrong about it.

- Core ex-housing, something worth watching especially since housing seems back in an uptrend, rose to 1.29% from 1.21%. That’s the highest since Jan 2017, but it hasn’t been higher than 1.61% since early 2013. Right now can still claim it’s a housing story.
- Putting together the four-pieces charts.
- Still not much action in inflation markets. From the swap curve: US #Inflation mkt pricing: 2018 2.2%;2019 2.2%;then 2.3%, 2.4%, 2.4%, 2.4%, 2.5%, 2.5%, 2.4%, 2.5%, & 2028:2.5%.
- Four Pieces: Food & Energy first. Roughly 21% of CPI.

- Core Goods, about 19% or so of CPI. Rising very slowly. If core inflation is to reach ‘escape velocity’ this needs to rise a fair amount. Tariffs will help that, eventually.

- Core services, less rent of shelter. About 27% of overall CPI. Lot of medical care here, which as we expected has been pulling this higher. Again, for CPI to reach escape velocity you’d want to see this above 3%.

- And the big kahuna, housing, about 1/3 of overall CPI. Had a steady run-up, got ahead of itself and came back to model, and now is accelerating again. Housing indeed looks tight, and this should continue especially if wages continue to accelerate.

- Diffusion look at inflation is still pretty dull. Slightly less than half of all categories of CPI are accelerating faster than 3%. But that’s been very consistent between 40% and 50% (obviously at ~50%, median CPI would be at 3%).

- OK, last overall point. May was an easy hurdle to get an acceleration in y/y, as May 2017 was only +0.08. June and July of last year were both +0.143%, so again we should see more acceleration. Y/y core CPI should be at 2.3% next mo & hit 2.4% in Sept just on base effects.
- …that’s merely assuming 0.2% per month from core CPI, which is between what TTM core says it is and what median stays it is. If we print just a smidge above 0.2% per month we could hit 2.5% in November. Again, that’s assuming no big acceleration in underlying pressures.
- I happen to believe there ARE some underlying pressures so I think we’ll hit 2.5% sooner than that and median will press 3%. Nothing super alarming for the Fed, but somewhat discomfiting. The real test will be once we hit Dec and Jan and those hard comps.
- That’s all for today. Thanks for tuning in, and thanks for subscribing to the modestly-priced premium channel. I really appreciate your voting with your dollars in this way!
Breakevens eventually did care a little bit, rising a tick or so. Market-wise, today’s number continues to do two things. First, it doesn’t really give any reason for the Fed to arrest or delay its current plans to gradually hike overnight rates. There was no surprise here – this is still all very much in the realm of base effects as we drop off the strange deceleration from last year. Second, there’s really no reason for interest rates in the US to stay below 3%. In an expanding economy with accelerating inflation which is already at 2.2%, or 2.7% on median, a 3% nominal yield makes little sense. Real yields, and nominal yields, are too low. So, honestly, are breakevens…inflation swaps are showing forward expected inflation rates of no more than 2.5% out for many years, even though median inflation (and headline inflation!) is already above that level. You have to have a great deal of faith in an untested hypothesis – the idea that inflation expectations will be ‘anchored’ and overwhelm any effects from tariffs, actual production bottlenecks, and monetary largesse, to keep inflation low and steady – to be actively shorting inflation at these levels, and if you’re buying Treasuries at yields below 3% you are actively betting on inflation declining.
If it seems a strange time to be making that bet, I agree with you. But market sentiment is clearly biased in favor of a belief that the weather will always be sunny and warm and that neither inflation nor commodities will go higher, or equities or bonds lower, from these levels. The contrary evidence about inflation, anyway, continues to build and to my mind it requires an increasing effort of will to ignore that evidence.
Summary of My Post-CPI Tweets (May 2018)
Below is a summary of my post-CPI tweets. You can (and should!) follow me @inflation_guyPV and get this in real time, by going to PremoSocial. Or, sign up for email updates to my occasional articles here. Investors with interests in this area be sure to stop by Enduring Investments or Enduring Intellectual Properties. Plus…buy my book about money and inflation. The title of the book is What’s Wrong with Money? The Biggest Bubble of All; order from Amazon here.
- OK, 20 minutes to CPI. Let’s get started.
- Although chatter isn’t part of the CPI, it’s interesting to me as a CPI guy. The chatter seems less this month than last month (maybe because of two readings <0.2%). I guess no easy ‘cell phone story’ to latch onto.
- Last month there was of course that talk about cell phones, and the jump in core did excite breakevens…a little. 10y breaks now at 2.18%, highest in 4 years. But, as I recently pointed out, You Haven’t Missed It.
- Consensus expectations this month are for 0.19 on core or a little softer. Y/Y will rise to 2.2% if core m/m is 0.13 or above. Outlier of 0.23 would move us to 2.3% and be a surprise to many.
- Average over last 6 months is 2.56% rate. I saw a funny article saying ‘but that’s due to cell phones.’ Of course, the m/m rate is not due to cell phones dropping off from March of last year. Median CPI is at 2.48%. So this is not the new normal. It’s the old normal.
- No one is much more bullish than expecting an 0.2% every month…that’s a 2.4% annually; most economists see that as something close to the high of sustainable inflation. But again, that’s the old normal. It just seems new because it has been a LONG time since we’ve been higher.
- They’re wrong on that! Just not sure how soon this all comes through.
- So last month, in addition to the bump in core services y/y (because of cell phones), core goods also moved to -0.3% from -0.5% and -0.7% the prior mo. The lagged weakness in the dollar, along with the rise in goods prices caused by trucker shortages, should be showing up here.
- Lodging Away from Home took a big y/y jump last month, but it’s a volatile category with a small weight. It’s usually an excuse to people who expected something different on the month.
- I continue to watch medical care, which is important in core services. Doctor’s services still showing y/y inflation as of last report, but both Doctors Services and Hospital Services rose last mo.
- 15 minutes until the number!
- Buying in the interbank market for the monthly reset (for headline) is 250.68.
- Very weak number. 0.10% on core CPI. y/y ticks up only slightly, to 2.12% from 2.11%.
- Last 12. Surprising. Note that last April was 0.09% so might be some seasonal issue with April. Sometimes Easter plays havoc, and Easter was early. But that’s usually more a Europe thing.

- Massive drop in CPI for Used Cars and Trucks. -1.59% m/m, taking y/y to -0.9 from +0.4. That’s odd – very different from what the surveys are saying.
- The Mannheim Survey actually ticked UP this month.

- I don’t usually start with Used Cars & Trucks but that jumped out. That’s 2% of the CPI so not negligible.
- OER m/m was 0.33% vs 0.31% last mo. y/y rose to 3.36% vs 3.26%. Lodging away from home was 0.74% m/m, following 2.31% last mo. And Primary Rents accel to 3.69% y/y from 3.61%. Housing strong.
- Medical Care 2.21% y/y vs 1.99%. Also strong. Apparel 0.77% vs 0.27%. Recreation 0.27% vs 0.61%, and “other” a little softer. But wow, could this all be used cars? It looks like a strong number on the internals.
- 10-year Breakevens are down 2bps. But I think they’re going to come back. This doesn’t look like the weak print we saw at first. Although I’m still drilling.
- CPI Medical. Should keep rising.

- That’s driven by physician’s services, out of deflation. hospital services still trendless around 4.5%

- But don’t let them tell you this is unusual. It’s a large jump for OER to be sure, but housing prices continue to accelerate higher. Not at all surprising to see rents and OER stop decelerating.

- here’s OER vs our model.

- The Housing major subcategory didn’t rise very much, because Household Energy was weak.
- Also interesting is CPI Apparel, 0.77% y/y…highest since a burp in Jan-2017 but it hasn’t been sustainably above that level since 2013. However, weak dollar shows up here, and conflict with China?
- College Tuition stable at 1.90%. I can’t stop staring at the Used Cars number. It’s like a…well…car wreck.
- Wireless telephone services almost back inflating again!

- Biggest declines on the month, in core categories of weight>1%: Public Transportation, then Used Cars & Trucks, then New Vehicles, then Recreation.
- Biggest gainers: Women’s & Girls’ apparel, Household Furnishings and Operations. Not many upside outliers, in other words.
- And folks, that means Median isn’t going to be as soft. My early guess is 0.22, bringing y/y to virtually match last February’s cycle high at 2.58% or so. That’s what’s really going on. Median category is housing so could be + or – small from my est.
- Breakevens 1.25bps off the lows. It’ll probably keep going. This is not a weak number in my view.
- Even CPI-leased cars decelerated. Someone hates cars this month.

- Today’s report is brought to you by the Young & Restless.
- Four pieces charts. Food & Energy flat

- Core goods actually dropped a tenth. Culprit…I dunno…maybe CARS?!?

- Core services less rent of shelter…stable at 2.32% y/y

- And the big story on the upside – and less shocking than cars – rent of shelter.

- Now, the core CPI figure – and the fact that the main upward move was from housing, which is underrepresented in core PCE – means the Fed has less urgency to tighten faster, for now. Median tells a different story.
- This month, we rolled off an 0.09% from April 2017 and replaced it with an 0.10%. Next month, we will roll off an 0.08% from May 2017. And the next two months after that are 0.14%. Ergo, core will keep rising.
- Should have gotten to 2.2% on core this month, and didn’t thanks to CARS. But will next month, and 2.3% the month after that, and 2.4% a month or two after that.
- Markets are just about discounting CURRENT inflation (the chart shows CPI swaps, which aren’t biased lower like breakevens, and Median through last month). But still not discounting FUTURE inflation and no tail-risk premium to them either.

- US #Inflation mkt pricing: 2018 2.2%;2019 2.2%;then 2.4%, 2.4%, 2.5%, 2.5%, 2.4%, 2.4%, 2.5%, 2.5%, & 2028:2.5%.
- That’s all for now. Thanks for tuning in!
Today’s CPI report was a strong number masquerading as a weak number. The core figure was polluted by a large one-off move lower in inflation for cars – a move that is, moreover, not evident in private surveys. The fact that this is a one-off caused by an outlier was driven home a few hours later by the Cleveland Fed, who calculated the Median CPI at +0.24%, which pushed the y/y median CPI to 2.60%. That’s the highest level since January 2009, and it underscores that we are really seeing acceleration beyond merely retracing the cell phones and other one-off moves from 2017. On the upside of today’s report was housing, which took a surprising jump higher. But what was surprising was not the rise, but the magnitude of the jump. Housing prices continue to rise, and the rate of increase has been accelerating. There is no question that rising housing prices tend to pressure rents higher, and so the direction is not a one-off. Arguably, the one-month movement was “too much,” but it may have been retracing prior softness as well. The movement in rents took the series away from our model a touch, but there’s nothing saying our model is the “right” answer!
But the right answer overall is that inflation is accelerating. Some of this was simply baked in the cake as easy comparisons cause the y/y number to rise. But not all of it. The question going forward is whether inflation crests here, between 2.2%-2.4% on core CPI and 2.5%-2.7% on median, or carries further. My belief is that it has further to run.