Archive
Summary of My Post-CPI Tweets (November 2021)
Below is a summary of my post-CPI tweets. You can (and should!) follow me @inflation_guy. Or, sign up for email updates to my occasional articles here. Investors, issuers and risk managers with interests in this area be sure to stop by Enduring Investments! Get the Inflation Guy app in your app store! Check out the Inflation Guy podcast!
- It’s #CPI Day again. And it’s official, this is now the MOST WATCHED economic number of the month. It’s crazy to think that if you had told me two years ago that we would be pushing 40-year highs on #inflation in 2021, I’d have thought you were mad.
- Amazingly, economists’ predictions for today’s figure would take headline inflation to 6.8% and core to 4.9%. The month/month forecast for CORE is actually 0.5% – an amazing testimony in itself.
- Some economists are ‘getting religion.’ The last couple of numbers have been shocking (especially last month’s). The September CPI released in Oct was only 0.24% core, but it was broad.
- The October CPI released last month was 0.599%, AND it was incredibly broad. Median CPI rose 0.57% m/m – by far the largest increase since 1982. Not even close.

- So this month, people aren’t looking for retracements in an outlier. There’s nothing much to retrace. Indeed, it looks like we might get another push from autos.
- Used car prices in the CPI rose 2.5% m/m last month; it could be 4% this month. It COULD even be more than that.

- New car prices have also risen 1.3% in each of the last two months. With used car prices skyrocketing, it’s hard to imagine new car prices flattening out. So from autos, you could contribute 0.2% to core, if they play to chalk.
- Rents have also been jumping. Unlike Used Cars, only the timing was surprising. I thought it would take longer after the end of the eviction moratorium to see 5% rates of increase and more, but here we are. Both OER and Primary rents were +0.42%-0.45% each of last two months.
- If that repeats, it adds another 0.16% or so to core. So then you just need to find price increases of 0.14% from everything else in the core categories, to get to your 0.5% forecast. So it’s not a big reach.
- Lots can go wrong in any month, of course, which is why I try not to overanalyze the number pre-snap. But 0.5% doesn’t seem wildly off as a baseline guess, to me. (The inflation swaps market sees more like 6.9% on headline, so upside risk.)
- The bottom line is this: although next month we may get some drag from gasoline thanks to the sharp fall in wholesale prices at the end of November, we’re still very likely to hit 7% on headline and will certainly exceed 5% on core over the next few months. That’s amazing.
- It gets more amazing: Because of easy comps from last year, averaging 0.06% on core for Dec, Jan, Feb, it doesn’t take a lot of imagination to get y/y core to 6% by the end of Q1. Then it should recede…but it’s not going back to 2%.
- So to put it bluntly, inflation right now is not aiming for the 5 o’clock news. It’s aiming for the history books.
- Why is this happening? Simple: too much spending, too fast, financed with newly created reserves. Period. The shortages result from getting incomes back above pre-covid levels before we were ready to provide the goods and services to the people waving dollars.
- Going forward it is hard to see how this resolves easily. There are still many more people not in the workforce than there were pre-pandemic…but more income, by a lot. Demand>supply, and financed by 12% money growth.
- Moreover, one final thought and a h/t to Barclays for their chart of the HH index. The Herfindahl–Hirschman Index is a very widely-used (especially in antitrust) measure of market concentration. Over the last few decades, it has risen precipitously, meaning more concentration.

- When market power is concentrated, so is pricing power. And those mega-firms that now dominate just about every niche in American life have re-learned that price increases can stick in this kind of environment. Who can blame them? You build market power for exactly this moment.
- It’s hard to unscramble this egg. So hang on to your juevos, number in a few.
- Cents and Sensibility: the Inflation Guy Podcast
- inflationguy.podbean.com
- As a reminder, I will have a summary of all my tweets at https://mikeashton.wordpress.com sometime mid-morning and then I plan to put out an Inflation Guy podcast (https://inflationguy.podbean.com) sometime today.
- Yawn. CPI as-expected. Just a soothing 6.4% annualized pace of core. 0.53% m/m,

- Core was actually VERY close to printing 5.0%. Using the seasonally-adjusted numbers you’d get 4.96%, which would round up. NSA numbers give you 4.93%. Doesn’t matter; will be over 5% next month.
- So, highest headline inflation since 1982, highest core since 1991, with more to come on both.
- Running through the usual suspects: Used cars were 2.50%. That’s less than I expected. There’s still make-up there next month, believe it or not.
- Owner’s Equivalent Rent +0.44% again this month. Primary Rents +0.42% again this month. Eerily steady at a high level. This month, Lodging Away from Home was +2.98% m/m. Consequently, the Housing subgroup was +0.52% m/m, 4.8% y/y.
- I mentioned Used Cars; New Cars was 1.13% (seasonally adjusted) m/m. Car and Truck Rental +1.1% m/m. Airfares this month (a “Covid category”) +4.75%
- So with airfares, lodging away from home, used and new cars, motor vehicle insurance (+0.66% m/m)…doesn’t look like this wave of COVID is doing much to hold down prices.
- An eye on Medicinal Drugs is warranted. y/y it’s back to flat. Doctors’ Services also up smartly this month, 4.26% y/y. Hospital Services down m/m but still 3.5% y/y.

- Overall, Core Goods rose to 9.4% y/y, with Core Services up to 3.4% y/y.
- Interestingly, two of the eight major subgroups declined m/m: Recreation, and Education/Communication. And we still got 0.5% on core!
- Here are core goods and core services. Supply chain still an issue for goods. Core services the highest since 2008, and will go higher still thanks to rents.

- Core inflation ex-housing back up to 5.72% y/y. It was higher in June at 5.81%. But otherwise…back to early 1980s.
- So let’s see. Only category that declined at a faster than 10% annualized rate was Jewelry and Watches (-20.5% annualized m/m).
- The list of categories >10% annualized growth. Excluding the 6 food/energy line items there: Mens/Boys apparel, public transport, lodging AFH, Used cars, Women’s/Girls apparel, New cars, Motor vehicle parts/equip, misc personal goods, car/truck rental, tobacco,househld frnishings
- Looks like the median CPI category will be an OER subindex, which gets separate seasonals, so hard to forecast exactly but another 0.44% m/m or so from Median pushing it up to 3.5% (just my early guess).
- Median m/m. One exhibit in the ‘broadening’ argument.

- Once again, not a lot of huge outliers here. Although November and December numbers get harder to tell because the seasonal adjustments are more important (e.g. lodging away from home, negative before SA but strong after SA).
- Why did Recreation decline? Well, thinks like “admissions”, photographic equipment, cable/satellite television service all declined. So the cake we are supposed to eat is at least getting cheaper.
- Fascinatingly, 10-year breakevens are down HARD, -4bps on the day to 2.45%. With core pushing 5% and rising. Wonder what kind of number folks needed to stay long??
- Here are the Four Pieces. Food & Energy. Near multi-decade highs as well. And it’s not just energy – there are ripple effects in fertilizer and therefore food. The Food subindex itself was +5.82% y/y.

- Core Goods – here is where the supply chain argument is most-salient. Obviously cars are in here and a big part of it. But not all of it! it will come down, but all the way to zero? I have my doubts. And…not soon.

- Core services ex-shelter. Still the best news out there. Medical care not unreasonable. Mind you, this would have scared me two years ago, but right now it looks soothing compared to the other charts.

- And the part that was the most-predictable (but took an amazingly long time for people to catch on to): rent of shelter. This has another 1% or more to go, at least. And it’s a big chunk of CPI.

- The distribution of price changes by CPI component weights. Less of a distribution than a splatter, at the moment. Not much going up less than 3%!

- And let’s put numbers on that. Only 20% of the consumption basket has risen LESS than 3% over the last year.

- Almost double the weight of the categories slower than 3%? The categories faster than 4%.

- Lastly, the Enduring Investments Inflation Diffusion Index reached a new record high. The inflation pressures now are broader than the deflation pressures in the Global Financial Crisis.

- So wrapping this up…what does this mean for the Fed? In the Old Days, the Fed by now would have already tightened a bunch. Currently, we’re talking about reducing the amount they add in liquidity, maybe a little faster. And possibly raising rates in 2022. That is, UNLESS…
- …unless stocks drop like a stone. And honestly, it’s not really clear to me that the government would care to see much higher interest costs on the debt. Only way Japan has survived its mountain of debt is that is it almost interest-free, after all.
- But maybe the hawks will storm the Eccles Building and the Fed will not only raise rates, but also slow money growth (these were once tightly connected; now not so much, and it’s the money growth part that matters not the interest rate part). We can hope.
- In a recent podcast, “How Many Swallows Make a Spring”, https://inflationguy.podbean.com/e/ep-12-how-many-swallows-make-a-spring/ I expressed my opinion that once the peak is in, the valley for inflation won’t be as low – because we have semi-permanently moved the distribution.
- So we’re not looking, in late 2022, or in 2023, to get core inflation back to 2%. It’s just not going to happen unless housing collapses (which could happen – lots of weird things could happen – but we don’t base outlooks on what weird things COULD happen).
- IMO, we’re now in a land of 3%-4% core, maybe if we’re lucky it’s 2.5%-3.5%. Getting it back to 1.5%-2.5% will take strong leadership (HA!) and a long time.
- Recently, 10-year inflation breakevens reached 2.78% – matching the all-time highs (since TIPS were issued in 1997) from 2005. If you think about breakevens in the same way you think about TS…
- So, as I wrote last month, you haven’t missed this trade yet. https://inflationguy.blog/2021/11/18/you-have-not-missed-it/
- Thanks for tuning in. I’ll have the collated summary of these tweets up on my blog within a half hour or so, and will drop a podcast summary of it later. Retweet, call, click, visit, like, upvote, forward, or whatever the kids say these days.
The wonderful thing about December trading is that none of the market moves need to make sense. As I write this, stocks are up and inflation breakevens are down. It’s almost as if high inflation that didn’t actually surprise is somehow helping the ‘transitory’ story. Breakevens act as if the Fed is about to be aggressive and suck liquidity out of the system. But if that’s true, then it’s weird that stocks are higher because an elevated discount rate, with the stock market at record multiples, cannot be a good thing.
There is one way that those moves could be consistent, and that’s as if investors now believe that the inflation spike will indeed be transitory, and that the Fed won’t need to do anything after all. If it was all about some supply bottlenecks that will shortly resolve themselves, and the party can continue, then it would make sense to push inflation expectations lower and also not deflate stocks.
But to be clear, there is absolutely nothing in today’s number that would give any shape to that fantasy. For the third month in a row, the inflation figures were high and the price increases were spread across a very wide variety of categories. There is no one-off to point to. Used Cars adds something – but we haven’t yet seen the peak in that – and that rate of change will eventually ebb. At the same time, other categories are showing new life. This is a much more dangerous look than it was in the first half of 2021, when we expected broadening but it was still believable that “COVID categories” could be the main story. That story is dead and buried. This is not about the pandemic any longer; it is about policy response to the pandemic. It is almost entirely policy error. I will show again the picture from last month, which sums it up. Supply has done what supply usually does following a recession – if anything, it has recovered faster than usual and is back to trend. It’s demand that is far above normal, and that’s not an accident and it isn’t due to COVID. It is a policy error, and it will take many tears (and maybe many years) to reverse.

Summary of My Post-CPI Tweets (October 2021)
Below is a summary of my post-CPI tweets. You can (and should!) follow me @inflation_guy. Or, sign up for email updates to my occasional articles here. Investors, issuers and risk managers with interests in this area be sure to stop by Enduring Investments! Get the Inflation Guy app in your app store! Check out the Inflation Guy podcast!
- Hello #CPI Day. Is it my imagination or do these keep getting better? Today we should see a 31-year high in headline inflation and the second-highest Core #inflation in 30 years. And, honestly, there’s a chance we break June’s high on core.
- It actually doesn’t matter much if we move to 30-year highs on core this month because it will certainly happen over the next few. We are entering the easy-comparison part of the year. Oct ’20 through Feb ’21 had a CUMULATIVE 0.42% on core CPI.
- And it isn’t just core. Last month, the theme of broadening price pressures took a big step forward as MEDIAN CPI had the largest m/m jump since 1990.
- A lot of that has to do with rents, which are starting now to catch up after the lifting of the eviction moratorium. As expected. There is a lot more to go on rents.
- So the underlying themes this month are the same as they have been recently: broadening pressures and less attention on the one-off COVID categories…although…
- There will be plenty of volatile noise – that’s not going away soon, and it will contribute to inflation expectations since people encode price volatility as increase. Food inflation will probably be the highest in a decade.
- Wholesale gasoline has risen 10 months in a row. Hey, how long has Biden been President, roughly? I mean, counting his naps? (Sorry, that’s piling on and a 15-yard penalty.)
- Used cars (and new cars) are also a risk this month. Last couple of months, used cars were a drag as the spike was fading. Not so much. Private surveys are spiking again. We probably see that this month, “a chunky amount”. Here is the Black Book survey.

- And here is the change, vs the CPI for used cars, lagged. You never know about the lags though.

- Now, policymakers are expressing the opinion that the very high inflation numbers we are seeing now will fade later in 2022. They’re right. There are some signs here and there that certain bottlenecks are easing.
- The inflation noise is going to gradually lessen. Unfortunately that means we’re seeing more of the SIGNAL, which remains strong. Pressures OUTSIDE of the ‘reopening categories’ are broad. So core inflation will stay high (just not THIS high, probably) through 2022.
- And as shortages get resolved, they’ll likely resolve at HIGHER prices, not lower. See my article “Shortages are Unmeasured Inflation.”
- & the causal elements remain. The Fed is tapering but credit growth has been hot.The idea banks are being stingy w/ credit is either false, or they’re being replaced by non-banks. M2 growth is down to ~13%, but that’s still WAY too fast. Especially as velocity recovers.
- Onto this month’s report: the Street is expecting a soft +0.4% on core, which would be the highest since June. I kinda think that’s the best case unless OER and Rents abruptly slow down again. Last month’s 0.24% on core only happened because the one-offs pulled it DOWN.
- The interbank inflation derivatives market has y/y headline hitting 5.94% today, breaking to 6.5% next month, and staying over 6% until April. (Some of that is due to base effects in energy and core.)
- I expect Rents to continue to move higher. Looking for that, & watching Median CPI. It’s at 2.42% y/y and will be higher this month; will be over 3% before very long. That’s where I think everything ends up settling out, late in 2022: 3.5%ish. Not as bad as now…but not good!
- Good luck this morning. I will have a summary of all my tweets at https://mikeashton.wordpress.com sometime mid-morning and then I plan to put out an Inflation Guy podcast (https://inflationguy.podbean.com ) sometime today. And let me take a moment this month to say: Thank you Veterans.
- Welp. Golly. 0.60% m/m on core CPI, putting the y/y up to 4.58%. A new 30-year high! And easy comparisons still to come…

- So let’s see. Used cars +2.5% m/m, which we sort of expected. OER +0.44% m/m, and Primary Rents +0.42%, which we sort of expected.
- Apparel? 0.00% m/m. Which means all the other 7 major subcategories contributed. Recreation +0.69%. Medical Care +0.50%. Housing +0.72%. Food/Bev 0.84%. Other +0.85%. Educ/Communication only +0.16%. Transportation +2.37%. Broad.
- Airfares: -0.66% m/m. But lodging away from home +1.35%. If you consider used cars a covid category (I don’t), then covid still net adding to this number. But then, everything was.
- New cars +1.36% m/m after +1.30% last month. Used car prices can’t be above new car prices for long – but one way to resolve that is new car prices up, not just used car prices down.
- Car and truck rental +3.1% after -2.9%.
- In Medical Care, “Medicinal Drugs” +0.59% m/m. It is still down y/y, but is this a sign up upward pressure in a category that has been soft for a while?
- Doctors’ Services flat, but Hospital Services +0.45% m/m, up to 4.04% y/y. I wonder if laying off lots of unvaccinated nurses will lower prices for health care? Hmmm. Guessing no.
- Overall Core Goods rose back up to 8.4%. But more disturbing is core Services jumping to 3.2%. Again, a lot of that is in rents.
- Food prices y/y up at 5.33%.
- Oh my. Oh my oh my. My first guess at median CPI is +0.57% m/m. That would EASILY be the highest since 1982 if I’m right.
- The really scary thing is that I’m looking for a big outlier. And I can’t really find one.
- Postage and delivery services were up +3.87% m/m. But that’s 0.11% of the CPI. Cigarettes +2.08%, but that’s 0.53% of the CPI. Health Insurance +1.99%, and that’s 1.2% of the CPI. Airline Fares, +3.5%, but 0.6% of the CPI.
- The only category that declined more than 10% annualized was Jewelry and Watches (-26% annualized m/m). There were 19 that ROSE more than 10% annualized.
- Core CPI ex-shelter back up to 5.35%. Sure, a lot of that is autos. But you kinda want that to go down especially when shelter itself…
- OER is catching up to the model…but the model is running away from it too.

- Here are the four-pieces. Piece 1, food and energy. Highest since just before the GFC.

- Piece 2 – Core goods. Near the highest since 1981 (only the bump in June was higher).

- Piece 3: Core services less rent of shelter. At last! Something that isn’t near 30-40 year highs. But these are the slower-moving pieces. Maybe it’s because they haven’t had time yet to adjust…

- Piece 4. Rent of Shelter. The part everyone was hoping wouldn’t follow home prices and asking rents. Sorry about that. It’ll shortly be at 30-year highs too.

- So this is starting to be less-subtle. Last month’s distribution of y/y changes vs this month (“OCT”). Left tail vanishing. Right tail growing. And whole middle shifting to the right. Not subtle. Not isolated.


- Here is the weighting of components of CPI that is inflating faster than 4% y/y. Almost 40% of the entire basket.

- 10y breakevens +5bps on the day to 2.69%. But that’s okay, Secretary Yellen tells us there’s no way that inflation expectations get unanchored.
- I suppose it should be no surprise that the Enduring Investments Inflation Diffusion Index has reached an all-time high.

- OK, let’s sum up. Different month, same story. There is still noise associated with “shutdown categories” and specific bottlenecks. But the underlying “signal” of inflation is getting stronger, as the pressures get broader. You can’t blame all of this on Long Beach.
- Those pressures don’t come from the bottlenecks and shortages. They come from the fact that people can afford to pay higher prices because there’s more money in the system. Here is a chart of personal income vs GDP. Demand and supply. Where did the difference come from???
- This ain’t rocket science. If you want the fire to stop, remove the oxygen. Oh, wait, actually that IS rocket science. Like, actual rocket science.
- The Fed is finally slowing the rapid increase of its balance sheet. Be still my heart. Honestly, I don’t think they’ll even finish the taper, much less start to raise rates. Especially under Brainard. So buckle up. Lock in long-term contract prices.
- I need to go take a shower. As much as the trajectory of inflation makes it fun to be “Inflation Guy,” this is monetary malpractice and it’s disgusting. This didn’t have to happen. Sorry. That probably shouldn’t be tweeted.
- Anyway – the beatings will continue until morale improves!
- Thanks for tuning in. There will be a tweet summary on https://mikeashton.wordpress.com in a little while.And I’ll drop a podcast later today. Interested in the new strategy we’ve launched, or want to work with us to launch one for your clients? Go to https://enduringinvestments.com & contact us.
Seriously, this month’s report – while expected, at some level – turns my stomach. We have learned these lessons, painfully, long ago: you can’t spend in an out-of-control fashion and you can’t print the money that you’re spending. That’s fiscal policy 101 and monetary policy 101. Flunk them all, I say.
The good news is that we no longer need to argue about whether or not inflation is coming. It’s here. We don’t need to argue about whether inflation will broaden beyond the re-opening categories. It has. The only questions are: how much? For how long? And how do we stop it? The third question we already know the answer to: restrain money growth; even shrink the money supply if velocity continues to rebound. No, that’s not against the rules. But it is against current monetary orthodoxy, which regards no particularly interesting role for the quantity of money. Flunk them all, I say.
The answers to the first two questions, how much and for how long, depend on how long it takes for policymakers to change course. On the fiscal side, there seems to be growing resistance to the idea that you can spend any amount of money because you can always print a trillion-dollar coin. But there are still some who profess to believe that if you spend more, you can solve bottlenecks by improving infrastructure. Maybe, if this was about infrastructure. But it’s not. It about spending in an out-of-control fashion and printing the money that you’re spending. On the monetary side, our choices seem to be another ride with Chairman Powell – who is the one who brung us to this party and I don’t really want to dance with him – or Lael Brainard, who thinks Powell has been too hawkish.
Do you see the problem?
Summary of My Post-CPI Tweets (September 2021)
Below is a summary of my post-CPI tweets. You can (and should!) follow me @inflation_guy. Or, sign up for email updates to my occasional articles here. Investors, issuers and risk managers with interests in this area be sure to stop by Enduring Investments! Get the Inflation Guy app in your app store! Check out the Inflation Guy podcast!
- Here we are, #CPI Day again – where did that month go!? – And everyone is gathered around for the number. So many interested people! So many experts on inflation suddenly!
- Last night, @TuckerCarlson led his show with a monologue re inflation. And he got it basically right, which is unusual for nonfinancial media. But the point is, “transitory” inflation is now important enough to get the lead on one of the biggest cable opinion shows in the world.
- Which of course is why there are so many experts suddenly. Demand creates its own supply. But I am not complaining. There’s only one Inflation Guy and he has his own podcast https://inflationguy.podbean.com and app (in your app/play store)! [Editor’s Note: See the last bullet]
- More importantly some regional Fed folks are starting to sound queasy. Atlanta Fed’s Bostic and St. Louis Fed President Bullard. The NY Times! The Wall Street Journal! The Poughkeepsie News-Gazette! Made up that last one but it’s everywhere.
- Not the Chairman though, and not the Treasury Secretary, both of whom want the same thing: more money. Who was it? In the Volunteers with Tom Hanks I think: Mo money means mo power.
- Meanwhile 1y and 3y expectations in the Consumer Expectations Survey are at all time highs since the inception of the survey in 2013. Which of course is why Carlson is leading with it. Consumers are noticing.
- Are they only noticing because of used cars? Seems unlikely. They’re noticing broader pressures, which we are starting to see and still will be watching for in this report.
- Speaking of used cars…while the rate of change might come down on some of these spikes, there’s no sign the LEVEL is retracing. See latest Black Book survey. “Holding steady” around 30% y/y. But that’s down from 50% in May.

- Consumers are also noticing shortages, which is unmeasured inflation. If you put a price cap below equilibrium, you get shortages. And if you get shortages, you can presume the equilibrium price is higher. Repeat: Shortages are Unmeasured Inflation
- Now, there’s good news. Delays at China ports are down. Although some of this is seasonal and some is due to the fact that…all the ships are sitting in OUR ports. But there is SOME good news anyway. Had to search for it.
- Question going forward is how much of the pressure on suppliers gets passed through. It will be more (a) the longer it lasts, and (b) the more suppliers see others passing along costs. And profit season is about to start, where we will hear some of those answers.
- In this CPI report today: the Street is expecting a very tame +0.2% on core, after a soft +0.1% last month. That seems very, very optimistic to me. If we get +0.27%, the y/y core rate will uptick to 4.1%.
- And AFTER this, the comps are terribly easy so core inflation will be moving higher almost certainly for the next 5 months. The total for those 5 months in 2020 was +0.43% on core. The TOTAL.
- So, core will be moving back towards 5%, even if the monthly figures settle in only at 0.2% per month. I’m not very optimistic that’s going to happen. But the Street is!!
- We will be watching the usual ‘reopening’ items of course, but also watching RENTS and the breadth of this figure. And let’s not ignore food although not in the core – it’s one thing that consumers notice more than other things when it’s persistent.
- I expect Rents to continue to move higher. So looking for that. And watching Median CPI, which set a new multi-year high month/month last month. It’s at 2.42% y/y and will be higher this month.
- I’d also look at some of the “re-closing” categories that dragged down core CPI last month to reverse. Again, not a lot of sign that most prices are declining, even if rates of change are slowing.
- Good luck out there. 5 minutes to the figure.
- The economists nailed it! Well, mostly. Core was +0.24%, so at the upper end of the forecast range before rounding up. Y/Y went to 4.04%, also just barely not rounded up. But been a while since we were worried about rounding. Let’s look at the breakdown though.

- Airfares plunged again, another -6.4% m/m. That’s going to change soon if vaccine mandates provoke more labor shortages there. But it does appear, from my own anecdotal observation, that airfares have been actually declining.
- Lodging Away from Home -0.56% m/m. Used cars -0.7% m/m. Car and Truck rental -2.9% m/m. So, most of the “reopening” categories are still dragging this month, what I’d thought was a one-off. I didn’t think they’d top-ticked the prices before.
- But New cars and trucks were +1.30% m/m after 1.22% the month before. As I’ve said before, the New/Used gap that closed when Used car prices spiked can open again in two ways. Used car prices can decline (no sign of that) or New car prices can rise.
- Now, that was your good news for the day.
- Primary Rents were +0.45% m/m, boosting y/y to 2.43%. OER was +0.43% m/m, boosting y/y to 2.90%. Whoopsie. Totally expected. And yet, kept seeing how the eviction moratorium wasn’t really holding down rents. Hmmm.
- Medical Care, though, remains a soft spot for reasons that I just can’t fathom. Flat m/m. Pharmaceuticals rebounded to be +0.28% this month, but Doctors’ Services fell -0.30% and Hospital Services followed a strong month with a tepid +0.11%.
- Apparel also plunged this month, -1.12% m/m. Small category, big move. Still 3.4% y/y, which is big for clothing, but it’s weird. With ports backed up, I’ve been seeing stock-outs in a lot of sizes of the stuff I buy. Shortages are unmeasured inflation. But still.
- Quick look at 10y breakevens has them +3bps since before the number. The rents spike has people spooked. And it should. That’s the steadiest component. All of these large moves in little categories tend to mean-revert.
- Core goods decelerates to +7.3% y/y (yayy!). But core services accelerates to 2.9% y/y (boooo!).

- Core CPI ex-shelter dropped to 4.66% from 4.79%. So that’s the effect of all of these small categories. Meanwhile, rents boomed. And core-ex-rent at 4.66% isn’t exactly soothing.
- Chart of core ex-shelter, and shelter. In the middle, you get core at 4%. If you want core to get back to 2%, you need core-ex to really plunge because shelter isn’t about to reverse lower.

- Speaking of shelter, I hate to say I told you so but…and we have a long way to go.

- Now let’s look at tuitions. Since we are in the Sept/Oct period, we’re going to find the new level of tuitions, which will be smoothed out over the next year with seasonals. This month, the NSA jumped 0.56%, and the y/y rose to 1.73% from 1.20%.
- Tuitions aren’t going to jump a ton this year, but in 2022 I expect them to take a bump – partly to reclaim colleges’ purchasing power and partly because the product will be better next year.
- Sorry, error. That was for the Education and Communication broad category. College Tuition and fees rose 0.96% m/m (NSA), and to 1.72% y/y from 0.83% y/y. Sorry.
- Other goods. Appliances +1.55% m/m. Furniture and Bedding +2.35% m/m. Motor vehicle parts and equipment +0.85% m/m. Medical equipment and supplies +0.96% m/m. So doctors? Not so much. EKG machine? Syringe? Give me your credit card.
- Breakevens dropping back. That’s profit-taking on the pop. They’re going to keep going up I think.

- Biggest core m/m declines annualized: Public Transportation (-46%), Car/Truck Rental (-30%), Womens/Girls Apparel (-28%), Jewelry & Watches (-18%), Misc Personal Goods (-13%).
- Biggest core annualized m/m increases: Motor Vehicle Insurance (+28%), New Vehicles (+17%), Household Furnishings/Ops (+13%), Motor Vehicle Parts/Equip (+11%), Infants’/Toddlers’ Apparel (+11%).
- I said pay attention to food, which is what people notice. Overall Food & Beverages was +0.87% m/m. Some big movers: Meats Poultry Fish Eggs (+29% annualized), Other food @ home (15%), Cereals/baking products (13%).
- Oh my. Median. My early estimate, which I hope is wrong, is +0.45% m/m. If I’m right that would be the highest in 30 years. On MEDIAN. Not meaningfully higher than that m/m since 1982.

- If that’s right, the y/y would be 2.78%. Still short of the 2019 highs, but not for long.
- That median calculation tells me I need to look at the diffusion and distribution charts. Which will take a couple of minutes to calculate. Please hold.

- While we are waiting for the diffusion stuff, here are the four-pieces charts.
- Piece 1: Food & Energy. The most volatile, but recently it’s just been up. And this is the part that people notice. Normally ignored because it mean-reverts. But it’s hard to get near-term bearish on energy or food, especially as the latter involves lots of pkging and transport.

- Core goods. Coming off the boil because of Used Cars. Staying as high as it is because of New Cars and other durables. Sort of concerning it isn’t dropping faster.

- Core services less rent of shelter. The one encouraging piece although it relies heavily on medical. Service providers not yet passing through wage increases so much. This is where the spiral would really happen, if it did.

- Piece 4, and the news of the day. Rent of Shelter is now shooting higher, after being held down by the eviction moratorium and lack of mobility. This will set multi-decade highs over the next year, and as the slowest piece makes “transitory” much harder to believe.

- The Enduring Investments Inflation Diffusion Index. Not that you need this chart to convince you, but price pressures are the broadest in about 15 years. And getting broader, fast.

- So, here is the distribution of y/y price changes by base component weights. Note two things: (1) there is a long right tail, which is symptomatic of inflationary periods. Core above median. (2) The whole middle has shifted higher. This is of course largely rents.
- So…we are getting higher inflation from the slow-moving pieces, and higher inflation from the fast-moving pieces. What’s not to like.
- And finally, here is a chart of the weight of all components that have y/y inflation above the Fed’s target (which equates to about 2.25% on CPI, roughly). Highest in a long time. Only 1 in 5 purchase dollars is going to something inflating less than the Fed’s target.

- So in sum…the overall 0.2% on core, which was nearly 0.3%, was the best news of the day. There is nothing in the details, distributions, or trends to make you think this is about to end.
- Because of comps, we can be confident that y/y core and median inflation are going to accelerate for at least the next 5 months. And there’s nothing to convince me that the monthlies are going to stay nice and tame.
- Transitory is dead. There is too much liquidity. The Fed now needs to choose whether to drain liquidity (not just taper), and live with much lower asset prices, or keep pumping asset prices “for the rich,” while we all ultimately lose in real purchasing power.
- Powell is over a barrel, but to be fair he was also the cooper.
- FWIW, I think the taper will happen. It will stop when one of two things happens: (1) Brainard replaces Powell or (2) Stock prices decline 15%. The Fed is fighting a war and they don’t even know it yet. They are working to keep the bread and circuses flowing.
- That’s all for today. I will have the summary post up on http://mikeashton.wordpress.com in an hour or less. Visit our website https://enduringinvestments.com ! Get the Inflation Guy app. Check out the podcast “Cents and Sensibility.” And stay safe out there.
- Biden to meet with ports, labor on supply chain bottlenecks
- I mean, this will definitely help, right? “Mister President, since you asked, we’ll clean it up.”
Biden to meet with ports, labor on supply chain bottlenecks
- Just heard that the Inflation Guy app has been “temporarily” pulled from the Google Play store. Uh-huh. Totally normal. Waiting for the notice from Twitter that I’ve been kicked off for “spreading disinformation.”
One of the ways you can tell this is getting bad is that the people who told us this was all transitory, had nothing to do with money, and would be over soon are doing one or more things from this list:
- Pretending they never said it.
- Pretending they didn’t mean what they obviously meant.
- Getting angry because they were wrong and you were right.
- Accuse you of also being wrong because you didn’t specifically say Used Cars was going up.
- Trying to talk over, or squelch, the people who are bearing the bad news.
Last month, we had an 0.1% on core. But when you looked at the details, it wasn’t really soothing because it was being held down by the “COVID categories” which were falling again. You didn’t really have to squint, but you had to look below the headline. This month, we almost printed an 0.3% on core, and that was only because of those same categories (plus apparel), for the most part. You didn’t need to look hard to see the problem. Primary rents had their biggest m/m jump since 1999. OER, the biggest jump since the heart of the housing bubble in 2006. Those are big pieces, and we have a great deal of confidence that they are going to continue to rock-n-roll. After all, we have long said that rents were being restrained mainly by the eviction moratorium and would begin to normalize after the moratorium was lifted. Quod erat demonstrandum.
The trajectory of inflation is becoming clearer. The debate is no longer whether inflation is going up but how high it will get and when the peak will happen. That’s the right debate. The ancillary debate is whether the next ebb will be at 2% or something higher, like 3%. Some outliers still see the next ebb as serious deflation, but those are the same people who thought we wouldn’t see inflation when the Fed started printing money that the Treasury spent. [Note to the purists: yes, the Fed doesn’t “print” money, but it’s silly to argue that buying bonds for reserves isn’t equivalent ‘because it’s an asset swap.’ That’s just sophistry. It’s also an asset swap when I buy a refrigerator for cash, but circumstances have clearly changed for both buyer and seller when I do so. Anyway, go sell your crazy somewhere else. We’re all stocked up here.]
There is at least a sliver of good in this mess, and that’s that while investors in the main totally blew the chance to buy cheap inflation protection before this all happened (because they believed inflation was not a risk), and totally forgot that inflation affects not only asset prices but stock and bond correlations, they are re-learning these lessons from the 1970s and 1980s. And so investing hygiene will be better going forward. We have more tools to hedge inflation now than we did in the 1970s, and failing to use those tools in a healthy investment portfolio will no longer be acceptable.
And I know I don’t need to say it, but my company Enduring Investments is here to help those investors. Just like all of those other experts, except we’ve been here for longer.
Summary of My Post-CPI Tweets (August 2021)
Below is a summary of my post-CPI tweets. You can (and should!) follow me @inflation_guy. Or, sign up for email updates to my occasional articles here. Investors, issuers and risk managers with interests in this area be sure to stop by Enduring Investments! Get the Inflation Guy app in your app store! Check out the Inflation Guy podcast!
- Happy last- #CPI – day-of-summer! Is the transitory spike over?
- Before we get started, a little housekeeping. Get the Inflation Guy app in your app store! And if you want to see some super-embarrassing photos of me, check out the Bloomberg Businessweek story just out today by @beth_stanton https://www.bloomberg.com/news/articles/2021-09-14/inflation-guy-michael-ashton-sees-more-on-the-way-as-investors-worry
- The story is terrific. Beth is a fantastic journalist. But as for the pictures…I can just say, “I’m working on it.”
- Anyway back to our story…This is the first time in months that the interbank CPI market has been at or slightly below the economist consensus estimate for headline inflation. (Pretty close though.) Previously, the interbank market was generally higher, and more accurate.
- The last five actual prints on core CPI are +0.34%, +0.92%, +0.74%, +0.88%, and 0.33%. The consensus for today is a lowish 0.3% (something like 0.27%).
- So economists – and the inflation market – are pricing in at least a LITTLE ‘transitory’ here with core inflation coming down from the peak…although I’ll note that 0.27% annualized is 3.3%. That’s still well above the Fed’s target. Not that they care very much.
- That sort of month/month core CPI print today would see y/y drop to 4.2% from 4.3%, since last year we got +0.35% in August. Transitory! Yay! We win! Except that celebration will be short-lived.
- The next 6 months of core range from +0.03% to 0.19% m/m. Very easy comps. So unless something weird happens, core inflation is going to be higher in 6 months than it is today.
- I think there’s a little upside risk to the number today, partly because expectations are so tame. Used cars, which are past the y/y peak, still rose in price last month according to Black Book. So that would be a surprise.
- However, that would distract from the more important issue this month and going forward: with the eviction moratorium lifted in many parts of the country, how fast do those units turn over at much higher rents?
- I don’t really think that will be a big effect THIS month – too soon – but it will become increasingly important going forward. I’d even say it is THE story going forward in terms of how high core CPI will get in this ‘transitory’ bump.
- OER and Primary Rents have started to see a little bump higher, although they were softer last month than in the prior month. I’m trying not to be obsessed with the wiggles. Anyway the lows are long past for rents.
- Let’s be real: just as people waved away Used Cars as a “reopening category” or “idiosyncratic,” they’ll say the same with housing. “One time effect!” they’ll say.
- But what will be harder to explain away will be inflation’s BREADTH. Our diffusion index is the highest in years, because it’s not JUST the reopening categories.
- So be careful of all the “ex-cars” and “ex-reopening categories” metrics. They did that in the 1970s too. An increase in the number of anecdotes is what inflation IS, after all. Go listen to my “Diamond Water Paradox” podcast. https://InflationGuy.podbean.com/e/ep-2-diamondwater-paradox/
- The PPI is telling us that the upstream pressures on materials, shipping containers, wages, etc are strong, and those pressures are broad. Yes, a lot of em are pressures on goods and not services. But it’s much more dangerous than hotel prices just catching up to the prior drop.
- The next question people will ask: “Does this print mean the Fed taper is on?” And the answer is, I give a taper a 50-50 chance of starting and a 15% chance of completing. I don’t think the FOMC will be able to stomach the market correction.
- So buy dips in breakevens if you see them, but I’d be more skeptical at selling nominals outright. Not sure the Fed will lock nominal rates as they did post-WWII, but they’re leaning against you.
- And I said this last month and repeat it: Stocks probably go up either way on today’s number, because that’s what stocks do these days (until they don’t).
- That’s all for now. My gut says a better chance for a high surprise than a low surprise today. And watch what happens to median CPI, later. Get the Inflation Guy app! Listen to the podcast! Follow the blog! https://mikeashton.wordpress.com Visit us at https://enduringinvestments.com ! Good luck!
- Team Transitory starts a comeback with a goal just before halftime!
- 0.10% on core m/m, dropping the y/y to 4.0%. Not just a miss, but a big miss.

- Used cars fell hard, -1.54% m/m. Last month I pointed out the m/m movement in the private surveys is only the same SIGN about half the time. But I fell for that this month as Black Book went up but CPI went down.
- Lodging Away from Home -2.92% m/m. Gosh, wait a minute, look at this…
- Are we going to have to call these the “re-closing” categories? Airfares -9.11%. Lodging AFH -2.92%. Used cars -1.54%. Car/Truck Rental -8.48%. Wow!
- However, New Cars and Trucks – where you’re seeing the chip shortages and plant shutdowns for want of parts – was +1.22% m/m.
- OER was +0.25% m/m, and Primary Rents put in a larger rise to +0.31% m/m. So let’s not get too excited about that miss right now…
- Primary Rents, re-accelerating slowly. It will not be long until this is over 5%.

- And OER. Again, these are the big pieces.

- So core goods fell to +7.7% y/y from +8.5%, and core services fell to +2.7% from +2.9%.
- Worth noting as the Biden Administration goes after pharmaceutical producers: CPI for Medicinal Drugs remains in deflation. Go get ’em, Joe.

- Core CPI ex-shelter (which means less when Shelter isn’t leading the charge) fell to 4.79% y/y. In June this was 5.81%.
- Apparel was +0.37% m/m, keeping y/y at 4.2%. Apparel is a small category, but we import almost all of it. So it isn’t surprising to see this rising for a change (but last month it had declined). At a 3% weight in the basket though, it doesn’t dominate anything.
- Medical care outside of pharmaceuticals was flat in Doctor’s Services (+0.01% m/m), but up big in Hospital Services (+0.85% m/m). So the overall Medical Care subindex gained despite the weakness in drugs.

- It’ll be interesting looking at the breadth this month. Seven of the eight major subindices rose, with only Transportation declining due to the Used Cars flop. Still shaking my head at the re-closing categories.
- College Tuition and Fees +0.88% m/m. But that doesn’t annualize the way you think it does. It always jumps in August and September and then levels out for 10 months. The y/y is up to 0.83%. This is NOT quality adjusted, or it would be lots higher.
- So the biggest decliners in non-food-and-energy: Car/Truck Rental (-65% annualized), Public Transportation (-49% annualized), Lodging Away from Home (-30%), Motor Vehicle Insurance (-29%), Used Cars and Trucks (-17%).
- Biggest gainers: Jewelry and Watches (+23%), Motor Vehicle Parts and Equipment (+22%), Household Furnishings and Ops (+16%), New Vehicles (+16%), Men’s and Boys’ Apparel (+13%).
- So…here’s the thing. My early guess at Median CPI is +0.33% m/m, which would be the highest since early 2007. So folks, this isn’t as tame a number as it looks like. Rents are rising, and inflation is broadening.

- If you took out Used Cars, Lodging Away from Home, etc when they were spiking, then to be fair you should be taking them out now when they’re declining. Because that’s most of the story here.
- Quick chart of y/y core goods and services inflation. Core Services has a much larger weight, and much of it is rents. Core goods off the boil but has a ways to decelerate yet.

- Let’s do the 4-pieces chart and the diffusion index then wrap up.
- Piece 1: Food & Energy. Steady upward pressure, but of course this tends to be mean-reverting.

- Core goods – I already basically showed this chart. Used cars starting to decelerate and pull this down, but New cars accelerating. And broad pressure elsewhere. Watch this. If it goes only back to 3%, that’s a big deal. It’s been a deflationary force for many years.

- Core Services less Rent of Shelter. Steady downward pressure in pharma, but upward in hospital services. Downward in public transportation. But still, not collapsed yet.

- And piece 4, rent of shelter, the biggest and slowest and the story for the next year-plus. Going lots higher.

- Actually while the diffusion index is calculating let me start the wrap-up. First: this number was truly weird in that reopening categories that had been leading the so-called ‘transitory’ spike were the ones that went down. I don’t know that anyone was looking for that.
- But OUTSIDE of those “re-closing” categories, inflation was pretty solid. Rents and OER rose, although we haven’t yet seen much effect of the end of the eviction moratorium. We will. And there was pretty good breadth.
- So what does this mean for the Fed? GREAT NEWS! A larger-than-expected decline in core CPI will give the doves what they need to demur on tapering. I think the odds of tapering just dropped. But they didn’t much want to taper anyway.
- I don’t think this really changes the narrative – rents are going to drive core inflation higher, and the broadening inflation is going to help un-anchor inflation expectations – but it gives the most dovish Fed in 40 years cover.
- 10-year breakevens at this hour are -2.5bps or so. They’ll be a little heavy as the carry traders lighten up, but this is a dip that is worth buying IMO. Of course, there aren’t many retail products where you can make that play.
- Here’s the last chart. I pointed out the rents thing, which will be one big story going forward. The other is the broadening of inflation. The Enduring Investments Inflation Diffusion Index declined (vy slightly) this month, but it’s still at levels rarely seen in last 20 years.

- That’s a wrap for today. I appreciate the follows, re-tweets, and counterpoints. If you’re interested in investing implications of all of this, hit our contact form at https://www.EnduringInvestments.com Download the Inflation Guy app. Try out the podcast! Thanks for tuning in.
The upshot of today’s figures is simple: we expected the Used Cars, Hotels, and other “COVID categories” to flatten out after their big rebound. But no one that I know was looking for them to plunge again. That’s weird, but it makes analysis pretty simple. If you thought that it made sense to look through those one-off spikes to the underlying trends before (although the underlying trends weren’t all that encouraging, they were better than the spikes!) then you ought to probably look through the re-collapse. And outside of those “re-closing” categories, inflation is broadening and rents are accelerating, just like I’ve been expecting. So don’t get too excited that we’ve seen the peak in inflation just yet.
Remember the comparisons to last year get super easy here for the next six months. September 2020 was +0.19% on core inflation; then we have +0.07%, +0.17%, +0.04%, +0.03%, and +0.10%. And Lodging Away from Home won’t plunge every month – I’ll take the “over” on all six of these. And that means y/y core inflation is going to be accelerating from today’s 4.0%, for at least the next six months.
Moreover, median inflation is going go be rising towards those numbers too, as will trimmed-mean and the other better measures of the inflation distribution’s central tendency. There’s not much in this figure that is bona fide good news for the Fed. But I think they’ll take the win anyway, even if it’s on a bad call by the referee.
Summary of My Post-CPI Tweets (August 2021)
Below is a summary of my post-CPI tweets. You can (and should!) follow me @inflation_guy. Or, sign up for email updates to my occasional articles here. Investors, issuers and risk managers with interests in this area be sure to stop by Enduring Investments! And, of course, download the Inflation Guy app from your app store!
- administration says the FTC should ‘monitor the U.S. gasoline market’ and ‘address any illegal conduct that might be contributing to price increases for consumers at the pump.’ https://cnbc.com/2021/08/11/as-gas-prices-rise-white-house-says-opec-action-is-simply-not-enough-calls-for-ftc-scrutiny.html >> Actual cause is a loopy guy w/ a blank check enabled by printing press.
- And with that, good morning! #CPI Day again. This is the first one in a long, long time where I have heard people suggest “this is the biggest economic release of the month” and MEAN it.
- Before we get started, a little housekeeping. Get the Inflation Guy app in your app store! Tune in to @TDANetwork at 1:45ET today, where I’ll be on with @Npetallides. And register for the Simplify webinar tomorrow at https://us02web.zoom.us/webinar/register/5216230941517/WN_O20LE_xlRUOAe7ysdVBDnA . Busy busy Inflation Guy
- Now for the walk up: We’ve now had four “high” surprises in a row from the CPI report. In each case, the market for the setting (in the interbank CPI market) has been closer than the economists’ estimate, but still too low.
- The last four prints on CORE CPI are +0.34%, +0.92%, +0.74%, and +0.88%. The economist consensus for today is 0.4%, with the market closer to a rounded-up 0.5%.
- (N.b. Core CPI doesn’t trade, but the headline CPI index traded at 273.1 yesterday and that implies 0.54% m/m on headline and something a little less on core)
- If the economists are right, y/y headline will drop down to 5.3% (just barely) and core to 4.3% from 4.5%. That will be the first decline in quite a while. Unfortunately, the comparisons to last year get easier from here. For the next 7 mos, core is comping 0.14% on average.
- So even if today we see an ebb in y/y due to base effects, I believe we still have significantly higher highs in core inflation ahead.
- Now, on the details: we may ACTUALLY see a DECLINE in Used Cars CPI, as the Black Book Used Vehicle Retention Index, the best leading indicator of Used Car CPI, dropped 2.5% last month.
- But before you get too excited, note that the change in the BB index m/m only has the same SIGN as the change in the used car/truck index about 50% of the time over the last decade. Lagged 1 month, it’s about 60%.
- So better chance for a decline in used cars next month. But it’s a risk of a drag, and it hasn’t been a risk for a while. One way or the other, the BIG contributions from Used Cars are past.
- On the other hand, there’s still other “reopening categories” such as airfares, lodging away from home, and car/truck rental that are likely to still be jumpy. And New Cars as well, though this is less obviously a ‘reopening category’ and more about supply chain.
- Who cares about those, honestly. If that’s where the strength comes from, economists just wave their hands dismissively and say “transitory.” Where I’m focused is shelter (of course), and on BREADTH.
- Shelter will eventually rise a lot. For a while, the eviction moratorium was holding the average-paid-rent below asking rent increases. And, with another (questionable) extension in the moratorium, that effect is still there.

- But we have started to see some increases in Primary rents and OER anyway. The difference is just too wide. So, while the meat of that acceleration is ahead of us by some ways, I’m expecting to see it start to happen.
- And breadth – that’s the real story to watch. Our diffusion index is the highest in years, because it’s not JUST the reopening categories (whatever you read). The scariest number would be another 0.5% on core but without contribution from reopening categories.
- Now what’s the market impact? Interesting question. There now looks like there is a majority of Fed heads who are willing to at least talk about tapering, and a high core number will reinforce that. But the important voices on the Committee remain firmly dovish.
- Personally I think that, faced with the decision of somewhat higher inflation vs sharply lower markets, the Fed will err on the side of somewhat higher inflation and keep hoping their models are right.
- So buy dips in breakevens (the high tails are not priced in, anyway), but not sure I’d be as eager to sell strength in nominals. Stocks probably go up either way, because that’s what stocks do these days (until they don’t).
- There’s a lot of chatter from companies about being forced to push through price increases and seeing consumers actually not push back as much as they thought, so this is feeling less transitory every day. Don’t think we are going back to 0.1%-0.2% per month soon.
- That’s all for now. My gut tells me the consensus has finally gotten to something close to a fair bet, but I won’t be shocked at all if we get another 0.7% on core. I also won’t be surprised by a small miss lower caused by some one-off change. So fair, but large error bars.
- Well, on headline CPI it was finally a tie between economists (slightly too low) and the market (equally too high). But pretty close. Core was 0.33% m/m, slightly soft of estimates.

- 0.33% m/m, of course, is still 4% annualized on core. But let’s see the breakdown.
- Glancing I can see the curious bit will be the softness in Primary Rents. 0.156% m/m vs 0.23% last month. That seems odd, but importantly it also is unsustainable. Primary rents are going to go MUCH higher.
- In reopening categories, Airfares FELL -0.14% m/m (+2.7% last mo). Lodging Away from Home +6% (+6.95% last). Used Cars +0.22% m/m – no decline, but feels like it after +10.5% last month! New Cars +1.72% m/m.
- Now here’s a big surprise in a very little category. So not much impact, but car and truck rental -4.6% m/m. Last month +5.2%. Rented a car recently? That’s an odd one. But only 0.13% of CPI so rounds to 0.01% effect.
- The broad core categories: Core Goods +8.5% y/y (8.7% last month); Core Services +2.9% (3.1% last month).
- Core inflation ex-shelter decelerated to only 5.3% y/y from 5.8%. That’s a little tongue-in-cheek. But to be fair, used cars is still a large part of this.

- Only large declines (<-10% annualized) in core were Car & Truck Rental and Motor Vehicle Insurance. Large increases in Lodging Away from Home (101%), Personal Care Services (29%), New Vehicles (23%), Car parts/equipment (13%) and Car maintenance/repair (11%). All m.m ann’lized.
- Early guess at Median is that it will be 0.30%, which would be the highest in several years if I am right. And that speaks to breadth.

- Here is y/y Rent of Primary Residence. Again, this has a long way to go, to well above the prior levels in fact, unless the boom in housing prices never get reflected in rents.

- And here is Owners’ Equivalent Rent. Which is moving higher a little more earnestly, but still reasonably inert.

- Haven’t mentioned apparel. On a nonseasonally-adjusted basis it fell 1% m/m, but seasonally adjusted +0.04%.
- And I haven’t mentioned Medical Care. Overall +0.26% m/m. Breakdown: Drugs +0.17% (-0.39% last month), Doctors’ Services +0.40% (+0.26%), Hospital Services +0.55% (+0.22%). Some signs there.
- CPI – Doctors’ Services (y/y). Interesting ratchet pattern.

- …if you ever think you understand the CPI, just look at Health Insurance. In the CPI, Health Insurance is a residual since consumers don’t pay most health insurance directly. Went from +21% to -9% y/y over last year.

- So, the four-pieces breakdown. Then we’ll look at diffusion. Here is Food & Energy. No surprise. Not core, but felt in the pocketbook acutely especially by lower-wage employees.

- Core Goods – slightly off the boil, thanks to Used Cars. This will come back down as the y/y Used Car spike gradually leaves the data. I’m not worried about this staying at 8%. But 4% or 5% given global shipping problems – wouldn’t surprise me.

- Core services, ex rent-of-shelter. Air fare softness, motor vehicle insurance softness, car and truck rental softness – none of those likely to remain very soft in the near term I don’t think. And medical care heating up a little.

- And rent of shelter. To be sure, a lot of this is Lodging-Away-from-Home. But then, so was most of the decline. This piece is going MUCH higher over the next year. Our model for OER has it over 5% next year.

- Now, the big story is the diffusion. Inflation is broadening. Our inflation diffusion index is the highest in nine years. So it isn’t just the reopening categories, folks. Your eyes ain’t lying.

- Here is the distribution of category price changes. Six months ago, this was skewed to the left. Now, it’s skewed to the right. Long tails to the high side is a signature of an inflationary process.

- So, let’s sum up. The reopening categories are lessening in importance as we knew they would. Is inflation transitory then? It depends on the answer two two questions:
- is shelter inflation going to rise? And/or is that transitory? Shelter is slow, and right now it is depressed by the eviction moratorium. It has a LONG way to go, unless home prices and wages plunge. I don’t see those things happening. Ergo, we’re going to see more here.

- Is inflation due to supply chain constraints in a narrow group of categories? Answer here is no. Price acceleration is broadening. Apparent shortages, resulting in higher price, is how supply/demand imbalances are reconciled in a market economy – even if it’s demand-side.
- The comps for core inflation get easier going forward. 0.35% next month, but then 0.19%, 0.07%, 0.17%, 0.05%, 0.03%, and 0.10%. Core inflation is going to reach new highs into early 2022. And Median inflation is going to gradually accelerate too as inflation broadens.
- Last month, the CPI was high but it really WAS mostly about Used Cars. This month is lower, but it’s more worrisome because of the broadening of inflation pressures. I think there’s no turning back now. Inflation expectations are going to be broken.
- Will the Fed care? I give a ‘taper’ sometime this year maybe a 50-50 chance, although I don’t think it will last very long since the moment that stocks and bonds soften, QE will be back. Every taper so far has led eventually to larger QE!
- I give almost no chance of an actual hike in the overnight rate, for a very long time. I don’t think Powell or Brainard are going to turn into hawks – they may express alarm at inflation but they would be more alarmed by an equity bear market. Hope I’m wrong.
- That’s all for today. Remember to download the Inflation Guy app. Tune into @TDANetwork at 1:45ET today. And register for the Simplify webinar tomorrow at https://us02web.zoom.us/webinar/register/5216230941517/WN_O20LE_xlRUOAe7ysdVBDnA Harley Bassman and Mike Green are the hosts! Busy busy Inflation Guy. Thanks for tuning in!
Well, I had said “the scariest number would be another 0.5% on core but without contribution from reopening categories.” We didn’t exactly get that; it was a little softer on core and some of the reopening categories still contributed. But not all of them. The number of inflating categories is getting broader, and shelter is starting to rise – although still very slowly, thanks to the continued eviction moratorium. All that means is that the rise in rents will be smeared over a longer period, and won’t really get started for a few months although I think there are starting to be clues in the data that shelter costs are percolating. With soft comps, this means that late Q3 and Q4 are very likely to see a sharp acceleration in core inflation. If we only average 0.3% m/m on core inflation, then by March (February’s print) core inflation will be at 5.4%, compared to 4.3% now.
Will that matter to the Fed? Until the people come with torches, probably not. However, these days – I wouldn’t count out the possibility of torch-bearing mobs.
Summary of My Post-CPI Tweets (April 2021)
Below is a summary of my post-CPI tweets. You can (and should!) follow me @inflation_guy. Or, sign up for email updates to my occasional articles here. Investors, issuers and risk managers with interests in this area be sure to stop by Enduring Investments!
- Good Morning #CPI observers! Prepare for what is potentially the most entertaining #inflation figure in a while.
- Before I get started, let me first note that I’ll be a guest on tdameritradenetwork.com (http://tdameritradenetwork.com) with @OJRenick at around 10:20ET this morning. Tune in!
- Today’s walk-up is a little different. I usually try and focus mostly on the y/y numbers because the m/m numbers are an accumulation of random distributions around 280 other numbers. That is a lot of noise compared to signal and so I don’t like to forecast monthlies.
- However, on a y/y basis the noise tends to cancel so it’s a clearer reading. Median CPI is even better because it lessens the impact of the tails.
- This month, however, and for the next few months the y/y number is a distraction. We KNOW it’s going to jump a lot because the comparisons to March, April, and May 2020 are super easy. So instead, we want to focus on what happens to the monthlies.
- I warned about this back in February in “The Risk of Confusing Inflation Frames.” https://inflationguy.blog/2021/02/04/the-risk-of-confusing-inflation-frames/ And now…here we are.
- So looking back at the last couple of months, we see that the core CPI figures were soft. Last month, core CPI (but not median CPI!) was soft because of surprising movements in goods, outside of housing. It had been goods pressing core inflation higher so that was surprising.
- Turns out that some of that was (probably) due to the fact that the weather prevented the BLS from surveying certain prices. So we’d expect a little catch-up from last month’s +0.10% core, just as a null hypothesis.
- Some of the places we are pretty sure to see strength are in autos, apparel, and the travel categories. Used car prices are nuts. But in the bigger picture, there are a lot of shortages out there and they all push prices the same way.
- I talked about some of those shortages in my article at the end of March. https://inflationguy.blog/2021/03/30/how-many-shortage-anecdotes-equal-data/ How Many ‘Shortage’ Anecdotes Equal Data?
- There are shortages in autos (due to semiconductors as well as lower fleet sales into the used car channel), packaging, cotton, containers, rental cars, Uber drivers, other goods…and shelter.
- In shelter, rents have been artificially soft because of the eviction moratorium, which has made realized rents decelerate while asking rents are rising rapidly with home prices. That divergence is unusual and it’s due to the eviction moratorium.
- The Biden Administration just extended that moratorium (was due to expire end of March) so that catch-up will come later. However there are SOME signs that rents are improving anyway. I’ll be looking for that. Rents were not as soft last month as they had been recently.
- The economist consensus is for a core CPI m/m of about 0.2%. That seems low to me with all of the potential upside disturbances, and has got to mean that economists are expecting further shelter weakness. I don’t.
- The market doesn’t either. Interbank trading of the (headline) price number implies about 0.1% higher than the economists expect. Most of that in core presumably. I would not be surprised in the slightest at +0.3% core.
- We will see. Remember, the Fed doesn’t really care – and they’re working hard to tell you that you shouldn’t either. Eventually, the market will win. But not for a while. It will be late 2021 before the dust clears on the base effects.
- So keep an eye on those underlying pressures and don’t get distracted by the y/y fog of war. I will talk today in terms of y/y figures, out of habit, but rest assured I’m watching the small ball too.
- Thanks for coming along today on this crazy ride. Good luck! 6 minutes to print.
- OK, core came in at 0.34% m/m, so quite a bit higher than estimates. y/y rose to 1.646%…so ALMOST rounded to a 2-tenth miss on the y/y figure.

- Note in that chart, they’re not y/y. There’s no base effects there. In fairness, we probably should combine the last two figures, and get something like 0.22% per month, but that’s still faster than the Fed would like. Except they don’t care.
- So Core Goods jumped back up to 1.70% y/y, where it had been 2 months ago before dropping to 1.3% y/y last month. Collection issues. Core Services up to 1.6%.
- Primary rents +0.15%; OER +0.23%. Not as soft as a couple of months ago, but not overly strong either. Lodging Away from Home was +3.84% m/m, which pushed the Housing category to a +0.34% m/m rise…same as core, weirdly.
- Apparel fell again. That’s a bit odd. Apparel had been doing well partly because cotton imports from part of China were being held up at the ports…maybe that’s lessening now. Anyway Apparel isn’t a big piece.
- Pharmaceuticals: +0.08%. Doctors’ Services: +0.28%. Hospital Services +0.63%. First time I can remember them all three being positive in a while! Softness in Pharma is still surprising to me.
- Doctors’ Services highest in years (y/y).

- Hospital Services, despite this month’s jump…not so much.

- Back to used cars. Part of what is happening here is that rental fleets shrunk last year so they are providing fewer cars to the used car markets. Part is the semiconductor shortage making new cars expensive. But Black Book says…this has a lot further to go in months ahead.

- Ah. Core CPI ex Shelter jumped up to 1.61% y/y. Yeah, I know I said y/y. But that was at 1.7% last February BEFORE the COVID slide. Arguably it means price pressures are higher now than before COVID, and CPI is being held down by rents.
- This isn’t from the CPI report but a reminder of what is happening in rents. If a landlord is unsure of being able to collect the rent, it goes in a zero. Doesn’t take many zeroes to lower measured rent. And the number of zeroes is higher when the gov’t says you can’t evict.

- Other COVID categories: Airfares +0.44% m/m (fell 5% last month!), Lodging away from home I already mentioned +3.8% (-2.3% last month). Motor Vehicle Insurance +0.85% m/m.
- New Cars, interestingly, was flat. That’s odd – there’s clearly a shortage of semiconductors so maybe this is more a situation of you can’t get ’em so the price doesn’t change? I’d expect that to rise going forward.
- Car and truck RENTAL: +13.4% (SA) m/m. Here’s the m/m and y/y, which is now up to +31%. If you can’t buy ’em, you can try to rent ’em. Remember how I said fleets are smaller?

- Now, Median CPI giveth and Median CPI taketh away. Hard to tell because median category will probably be a regional OER, but m/m will be probably 0.2-0.22%. Median y/y won’t change much b/c base effects were mainly from a few small categories with large moves.
- That warrants further comment: the fact that we didn’t see a GENERAL deceleration in prices, but a very focused one, should make you wonder about output gap models. Most of the economy wasn’t in deflation. Hotels and airfares were though!
- Only two core categories with more than a 10% annualized decline this month: Women & Girls’ Apparel (-28%), and Infants’ and Toddlers’ Apparel (-22%).
- On the gainer side, tho: Car/Truck Rental as noted, Jewelry/Watches (+80.7% ann’lz), Lodging AFH (57%), Motor Vehicle Insurance (+47%), Men’s/Boys Apparel (+35%…hey!!), Misc Personal Svcs (+16%), Motor Vehicle Maintenance & Repair (+12%).
- Core goods & Core services. Both rose, and remain atop one another. How long can goods stay elevated? Port traffic is improving, slowly. But materials prices remain stubbornly high and global trade remains fractious.

- ok, gotta wrap it up and get to makeup for my appearance on @TDANetwork at 10:20. KIDDING, no makeup. You can dress a monkey in silk but it’s still a monkey. Anyway, I’ll do the four-pieces and then conclude. Will put out the diffusion indices later.
- Piece 1: Food & Energy. No surprises here: it was expected to jump as gasoline prices continue to recover.

- Piece 2: Core Goods. Back to the highs.

- Core services less Rent of Shelter. This still remains bizarre to me. But medical finally showed some life this month and there’s sign of pressures in the PPI there so maybe it’s coming. Hard to see an uptrend here though unless you turn it upside-down.

- Finally, Rent of Shelter. It seems it may be done going down, and there’s a lot of catch-up to do when the moratorium ends. But the last 2 months of rents have been more normal.

- So at this hour, 10-year breakevens are +1bp and stocks are flat. Because the Fed doesn’t care, and the punch bowl remains. I guess that’s about the summary here. The base effects are going to obfuscate whatever is really happening underneath.
- BUT, what is happening underneath (per the chart of core-ex-shelter) appears to be price pressures that are certainly no smaller than pre-COVID. Are they temporary? How will we know? If the Fed says they are, and are wrong…bad.
- If the Fed says the pressures are NOT transitory, and are wrong, and over-tighten, that’s also bad – but for employment. And here’s the thing, this Fed has said repeatedly that full Employment is their main goal. So errors are designed into the system to be inflation-enhancing.
Here’s the summary of the main points today. Ex-housing core inflation is back at the level it was prior to COVID. Housing is artificially depressed because of the way the BLS accounts for rents (which is reasonable, since someone who isn’t paying has certainly decreased his cost of living), and asking rents tell a totally different story. But since measured rents are soft, it means that core isn’t low right now because of COVID categories: it’s low right now because of one thing, really, and that’s rents. If realized rents converge upward to asking rents, you can tack another 0.7%, 0.8%, 0.9% or so onto core CPI.
Inflation is already higher than it “should” be coming off the greatest global economic contraction since the Black Death. And that’s without consumers being truly unleashed. But the Fed has adopted an asymmetric policy stance, because they very publicly feel that the risk of higher inflation is something they ‘have the tools to manage’, whereas they believe they have some sort of moral obligation to make sure everyone is employed. I don’t want to draw too many parallels to prior hyperinflations because that’s not what I’m looking for, but the current asymmetric stance is very odd for any policymaker who learned history and knows that one of the reasons that Weimar Germany printed so many marks was because they believed having everyone employed and paid was absolutely crucial, and so they ran massive deficits and printed money to pay for them.
This is why the Bundesbank has always been willing, ever since, to rein in inflation even if it meant short-term pain in labor markets. They remember that the best route to maximum employment in the long run is to maintain a stable pricing environment. As recently as the 1990s, the Fed (Greenspan at the time) would regularly say that. It is no longer the core belief of the FRB.
The Fed believes they have the tools to rein in inflation, the knowledge about how to calibrate them, and the will to use them, but at least for the next 6 months they will wave their hands vaguely at ‘base effects.’ After that, if inflation is higher than they would like once the base effects are past, they’ll vaguely wave their hands and say ‘average inflation targeting.’ It it going to be a very long time before central bankers willingly hike rates without the market forcing them to do it. And before that, there may very well be a showdown where the Fed decides to defend the longer-term yield environment and implements Yield Curve Control. These actions and possible actions have very different implications for stocks and bonds depending on the path, especially with equities pricing in a goldilocks environment. Get ready for a bumpy year.
How Many ‘Shortage’ Anecdotes Equal Data?
There is a growing list of categories of prices which are seeing abnormal price pressures. At least, they are abnormal by the standards of the last quarter-century! A couple of months ago, in “The Risk of Confusing Inflation Frames,” I wrote about some of the effects we might soon be seeing, and of the risk that some of the known-but-temporary effects will obfuscate more serious underlying issues.
In April, we will get the CPI for March; this will be the first CPI release to have ridiculously easy comparisons against the year-ago month. March 2020 was -0.2% on core CPI, and I suspect the consensus estimate for March 2021 will be something like +0.2%; this implies the y/y core inflation number will jump from 1.3% to around 1.7%, depending on rounding. But as I said, that disguises some of the important underlying pressures that may also start to appear with this number. There is an old saying that the plural of “anecdote” isn’t “data,” but eventually there must be a crossover point where the preponderance of independent anecdotes begins to approach the informational value of data, right? Well, here is a short list of some recent anecdotes and reports of shortages.
There has become an acute shortage of semiconductor chips, which has impacted automobile production (and will that increase prices for what is available?). There is a shortage of shipping containers, causing widespread increases in freight costs affecting a wide variety of goods. Packaging materials, which are also a part of the price of a great many goods, are also shooting higher in price. Worker shortages at various skill levels were reported in the most-recent Beige Book. There is a shortage of Uber and Lyft drivers.
There are other effects that have shown up but I misapprehended the significance of them at the time. Apparel prices have risen at an annualized 9% pace over the last four months. I’d attributed that to shipping, but there is more to it than that. In January US Customs issued a Withhold/Release Order (WRO) on cotton and tomato products coming from the Xinjiang region of China, where forced labor is employed; the order calls for the stoppage of freight with any amount of cotton (or tomatoes, but there is not much tomato in apparel) that originates from that region – even if it is only the thread on the hem. While this and the other effects on apparel are probably temporary, we don’t really know how temporary.
Importantly, we should add to these shortages a growing shortage of housing. The inventory of homes available for sale just hit an all-time low (the National Association of Realtors started keeping track in 1982).

And, as a result, the increase in the median sales price of existing homes just reached an all-time high spread over core CPI (home price increases sometimes have been higher, though it is unusual. For example, in May 1979 the year-over-year increase in the median home price was 16.9%. But core inflation was 9.4% at the time, so the real increase in home prices was only 7.5%).

I have written elsewhere about the fact that there is large divergence right now between what the BLS indicates the effective inflation in the cost of housing is, and what a measurement of asking rents suggest it should be. The significant chart is reproduced below – and the short story is that the divergence dates to the imposition of the COVID-related eviction moratorium. This has decreased the amount of rent that landlords actually expect to receive on average, which lowers effective rents even though every other measure of the true (free market) cost of shelter would be, is ratcheting higher at rates seldom if ever seen before.

Now, this moratorium was due to expire at the end of March, but the CDC just extended it until June (which may be one reason that TIPS breakevens have hit some minor resistance). That’s a little unfortunate since it means that the moratorium will expire right about the time that the CPI is enjoying favorable comparisons versus 2020. The understating of rent and owners’-equivalent rent inflation, since those are a huge portion of the consumption basket, has an outsized effect on CPI. I want to be fair here to the BLS: in an important sense, the CPI data on rents is not wrong because in fact if a tenant pays less because of the moratorium, then that tenant’s cost of living really did go down. Even though in a free market without such a moratorium his cost of living would have been higher, that’s not the question the BLS is trying to answer. The cost of living is lower in such a case. Of course, that’s temporary, and so when the moratorium is lifted we can expect the BLS will also faithfully report the catch-up. Which means that in the summer, when we would have expected y/y CPI to start to decline again as it faces more difficult comparisons to 2020…it may not, because rents will start to catch up. That’s going to toast the marshmallows of a lot of investors.
Now, there’s one more facet of the cost-of-shelter question and that’s whether home prices have risen too far, too fast and so it’s home prices and asking rents that will have to decline, rather than effective rents re-accelerating. This is a reasonable question. It is true that the ratio of home prices relative to incomes is getting back to levels that in the late 2000s indicated a bubble was getting ready to pop (see chart). For many, many years median home prices relative to median incomes was fairly stable at around 3.4x. Some increase makes sense since homes have been getting bigger, but it does give the appearance of being overextended.

However, last week in Money Illusion and Boiling Frogs I argued that the nominal value of certain real assets might be usefully compared to the level of the money supply as a way of assessing their real value. Comparing the equity market to M2 made the former look less frothy, and the argument is that maybe equity investors aren’t suffering from “money illusion” in the same way that consumers might be (so far). But the same cannot be said for the housing market. The chart below (Source: Bloomberg) divides the home price index (from the FHFA) by M2. While home prices relative to incomes look high, home prices relative to the stock of money look quite low. It is interesting how the QE of the early 2010s shows up as a one-time shift in this ratio, followed by a period of stability, isn’t it? It suggests that maybe home prices didn’t fully adjust to the new money-stock reality after the bubble’s burst in 2008 and the subsequent QE. And maybe such a one-time shift happens again now.

But it might also be the case that the current rapid escalation of home prices is the market’s attempt to get the real value of the housing stock to reflect the rapidly increasing value of the money stock. If that’s the case, then it also suggests that median wages probably will eventually follow. The last people to respond to money illusion generally are the people selling their labor.
I don’t know if this is the ‘right’ answer, and my purpose in these articles isn’t to give the ‘right’ answer. I just want to ask the right questions…and I feel like these are the right questions.
Money Illusion and Boiling Frogs
“Twice a day we are all forced to await the quotation of the Zurich bourse. Every fresh drop in its value [of Austrian kronen to Swiss franc) is followed by a wave of rising prices … The confidence of Austrian citizens in the currency administration of the State is shaken to its foundation. The State which is perpetually printing new banknotes deceives us with the face value … A housewife who has had no experience of the horrors of currency depreciation has no idea what a blessing stable money is, and how glorious it is to be able to buy with the note in one’s purse the article one had intended to buy at the price one had intended to pay.” – account of Frau Eisenmenger, recounted in When Money Dies (Adam Fergusson).
“Speculation on the stock exchange has spread to all ranks of the population and shares rise like air balloons to limitless heights … My banker congratulates me on every new rise, but he does not dispel the secret uneasiness which my growing wealth arouses in me … it already amounts to millions.” – Ibid.
These two passages come from the contemporaneous observations of an Austrian living through the early stages of the hyperinflation that followed WWI in that country. I don’t for a minute mean to suggest that the global economies are on the verge of hyperinflation, but I present these as an apt illustration of a concept called money illusion. In the first passage, the writer makes plain that the kronen is buying less and less, in terms of real goods, every day. Similarly, it buys less and less in terms of equity shares. The former, we tend to regard as a negative, and the latter as a positive, even though they are both related in this case to the same phenomenon: the unit of measurement is losing its value, so that it buys less real stuff as time passes. Isn’t that interesting? For someone who is continually investing in the equity market – I’m looking at you, millennials – higher prices should strike us as a bad thing just as higher car prices strike us as a bad thing.
I don’t mention that, though, to suggest that equities are a great place to hide out from inflation. In fact, they’re a pretty lousy place: as inflation rises the multiple paid on earnings declines so that even if nominal earnings are rising with inflation equity market prices can’t keep up. That’s not as bad as holding paper money and watching it go to zero, but it ends up being about the same when the inflation gets serious enough that the market itself collapses – as it did in each example of monetary hyperinflation (Germany, Austria, Zimbabwe, etc) that we have seen to date. But again, it isn’t my purpose today to warn about the dangers of treating equities like real assets when multiples are at nosebleed highs.
The interesting part is the money illusion. The writer in the passages above is uneasy, because while she is making millions she understands that those millions are losing value almost as fast (and ultimately, faster) than she can make them. But for a while the higher and higher prints of the market, the rising value of one’s home, and the accelerating increase in wages makes people feel wealthier. And wealthier people are happier and tend to spend more of the marginal wealth, when that wealth is real. But in this case the wealth is an illusion, because that additional wealth buys (at best) the same amount it did previously.
In classical economics, we would call spending more in this circumstance – despite having a similar claim to wealth in real terms – irrational. Although we use dollars to translate our labor into the things we want to buy, we all understand that we are really trading our labor for those things – it’s just that we need a medium of exchange because no one wants to directly exchange groceries for inflation-focused asset management services. More’s the pity. So homo economicus would regard his increasing millions in the market and not feel any wealthier as he knows the units of account are growing weaker. The money dropped into his bank account through a universal direct stimulus also wouldn’t be treated as actual wealth, since if we handed everyone a trillion dollars then obviously we all wouldn’t be living like trillionaires because the people who sell goods and services would adjust their prices (if they did not, then those vendors are voluntarily decreasing their own claim to the real wealth, by accepting smaller real payments in return for the same amount of goods). Wealth is just a claim on the national product. If everybody’s nominal wealth rises, but the nation is not able to produce more units of real output, then in aggregate we clearly are not wealthier because the pie is the same size. (Now, if you hand everyone a trillion dollars except for one guy, then that guy is poorer and everyone else slightly richer. Ergo, direct cash payments to the poor are clearly a way to distribute actual wealth, especially if those who don’t receive those payments also face higher taxes. So fiscal policy here definitely shuffles the deck of the wealthy. It just doesn’t make us wealthier in aggregate.)
The question of how people behave when they see additional income that comes from a greater money supply, rather than from additional productivity/output, is crucially important in monetarism. In the quantity equation of exchange, MV≡PQ, an increase in the quantity of money and in the velocity of money (MV), which is the total nominal amount of expenditures, necessarily equals the real output times the price level of that output (PQ). The amount that is spent equals the amount that is bought. But how the right side divides between P and Q is very, very important. If there is no money illusion, then an increase in the quantity of money will primarily increase prices while output will remain stable. Shopkeepers are unwilling to part with their wares for a smaller piece of the pie in real terms. On the other hand, if money illusion is rife then producers respond to consumers flush with cash by providing as many goods and services as they can; they view the masses as having more actual wealth to spend and so output increases and prices don’t rise as much.
Unfortunately, it seems that money illusion operates primarily when the quantities involved are small, or narrowly distributed. When incremental money creation is widely distributed and significant in size, then (as the second quote at the start of this article suggests) consumers, suppliers, and investors eventually figure it out. When that happens, a change in M is almost fully reflected in a change in P, as over time it usually is anyway. So the secret of recovering from a negative economic shock by expansionary monetary policy is to boil the frog slowly.
No one involved in current policy circles is interested in boiling the frog slowly. And that means it’s not going to end well.
In this context, the current bubbly stock market looks decidedly better. The chart below shows the S&P 500 divided by M2 (and multiplied by 100 because sometimes I don’t like looking at decimals on my y-axis). Now, the S&P 500 level isn’t the purest look at the total value of the equity market, but you get the general idea here – stocks have outrun the growth rate in the money supply, even over the last year, but the new records we are hitting are mostly on money vapor.

Summary of My Post-CPI Tweets (March 2021)
Below is a summary of my post-CPI tweets. You can (and should!) follow me @inflation_guy. Or, sign up for email updates to my occasional articles here. Investors, issuers and risk managers with interests in this area be sure to stop by Enduring Investments!
- Another #CPI morning as spring is getting ready to spring here in the northeast. And with spring, more activity.
- Today’s #inflation figure will be the last one to be compared to pre-COVID year-agos. The easy comps start next month. So, while consensus today is for +0.2% on core, that will still not move core much since last Feb it was +0.21%.
- Headline will jump a bit, because gasoline has been rising, but the real headlines if any will be below the hood. Last month core was flat, due to soft housing and a somewhat surprising decline in used cars and pharmaceuticals.
- I expect we will see the used cars number reverse this month (Black Book was strong), and with the end of lockdowns might see some strength in the covid categories. Pharma price hikes ought to eventually show up. But they’ve been confounding me.
- Global supply chains are a disaster and raw materials and packaging prices are spiking – the Texas freeze shut-down did NOT help polypropylene prices! – so goods prices ought to continue to rise. Eye on apparel as the canary there.
- The rent story is a passing one. But probably not yet, which means OER and Primary Rents should still look a little soggy. Asking rents are jumping, but measured rents are not – because of the eviction moratorium. If you’re not paying rent, it’s not a cost of living!!
- In this quarterly chart, you can see the divergence between asking and realized rents. The divergence began in Q3…which is when the eviction moratorium was enacted. That’s not coincidental.

- In the more-recent COVID relief bill, the eviction moratorium was not extended past March 31st, which was a bit of a surprise. That could still change, but when the moratorium eventually expires I am pretty sure we’ll see a rapid catch-up of rents. But not today’s story yet.
- My calculations are that if the end of the eviction moratorium caused effective rents to catch up to asking rents, the effect on OER and Primary Rents would add something like 0.9% to core CPI. (!) So that’s 2021’s following wind to prices.
- As always, I want to be sure to remind you that the Fed does not care about inflation any more. Someday they will, but not yet. They’ve even stopped reporting weekly M2! They believe they have the tools to stop inflation so they’re not worried. Ergo, you’re on your own.
- Although not exactly. We’re here to help. If you have interest in how to hedge/invest in the inflationary period approaching, visit https://www.enduringinvestments.com
- And for a summary of today’s series of tweets, you can check later at https://mikeashton.wordpress.com
- Thanks for coming with me on this #CPI journey this morning. Buckle in.
- Core looks like 0.10% flat, dropping y/y to 1.28%. That will be the low for…probably 10 years.
- Even the +0.1% was higher than the last couple of months. But the easy comps start next month. Then some hard ones. But by the time we get to the hard comps, rents should be catching back up. Worth looking at my “conflicting frames” piece on the blog.

- Used Cars and trucks surprisingly fell again, -0.91% m/m. That’s at odds with the private surveys, but there’s sometimes a wiggle before they catch up.
- Apparel dropped -0.74% m/m. Also odd. Pharma PLUNGED -0.75% m/m. As a result, the core goods y/y figure dropped to 1.3% from 1.7%! That’s the story.
- Rents were actually okay! OER was +0.27% and Primary Rents +0.20%. Really, today’s story in some ways is the opposite of what I expected. Rents solid, goods prices soft.
- Really odd stuff today. Airfares -5.1% m/m, despite the heaviest air traffic in a year. Lodging Away from Home -2.3%, ditto. Although some of that might be a weather effect. Still anti-anecdotal.
- Doctor’s services, though, jumped +2.01% m/m! To 5.1% y/y, highest in a while.

- Hospital services remained a bit soft. Still, the overall Medical Care subcategory accelerated slightly to 2.00% y/y from 1.95% y/y, despite the drop in Pharma, thanks to docs.
- So Core ex-housing dropped, to 1.16% from 1.25%. But for weird reasons, not services but goods!
- Core goods and services back together after core goods had rocketed ahead. Again, this is super weird. Shipping costs are through the roof. Packaging and raw materials prices are having moves like we’ve never seen. And goods prices are declining?

- sorry…decelerating. Let me be precise.
- Biggest monthly declines in core: Jewelry (-29.9% annualized), Lodging Away from Home (-24.4%), Public Transportation (?) (-24.0%), Men’s/Boys’ Apparel -23.6%, Infants’/Toddlers’ Apparel -21.6%, Tenants’/Household Insurance -13.5%, Used Cars/Trucks -10.3%.
- The decline in insurance makes sense. Insurance companies are having to give rebates because their loss ratios were too good (that is, they didn’t have to pay out as much as underwriting had expected). So that will be a CPI decline. I get that. Only 0.4% of CPI though.
- Largest core increases: Car/Truck Rental (+135% annualized), and that’s it for >10% annualized.
- Pharma y/y. Difficult supply chain for APIs and more announced price hikes in January than is normal. And prices are falling. That’s a conundrum.

- This is the divergence I mentioned in private surveys vs CPI for used cars and trucks. I could believe it cresting at a lower level but the latest zig higher suggested we have another zag in CPI. Next month, maybe.

- Brilliant catch. Although lockdowns are lifting, the BLS had trouble doing some collections. More likely weather, but blamed on Covid because we blame everything on Covid. But that explains a lot of weird moves. Good catch @TOzgokmen


- Well, that makes next month even more interesting. Because the rent numbers aren’t likely to have been much impacted by weather, but physical goods prices?
- And again, like I said the other surprise was that rents did not continue their recent trend of softness. Y/y on OER was flat. There’s a lot of catch-up ahead.

- One thing which has changed in the last year which isn’t likely to change back very soon is the VOLATILITY in the monthly CPI figures – not just the core or headline, but the subcomponents. That will persist for a while.
- OK, four pieces charts. Food and Energy relatively normal.

- Core goods – slightly off the boil but will be interesting for sure to see how much of this was due to “collection problems” at BLS.

- This is where there’s real weakness, but it’s airfares, hospital services…though doctor’s services added a bit this month. Insurance rebates likely pressured this in February. Again lots of volatility.

- And then Rent of Shelter, normally the least volatile. This month, rents were actually pretty normal but lodging away from home dragged further. I do think that hotel rates are unlikely to keep sliding. This might also be a collection issue.

- Think that’s going to do it for today. The bottom line is that rents were stronger-than-expected, lots of other things weaker, but collection issues make it easy to be skeptical that goods prices are suddenly decelerating. Next month we’ll get hopefully a cleaner picture. BUT…
- …BUT we will also get the beginning of the severe base effects. In three months, core CPI will be near or above 3%. We all know it, but it will be interesting to see if markets get nervous anyway. Thanks for tuning in. Stop by https://www.enduringinvestments.com !
- FWIW, looks to me like median CPI ought to be more like +0.26% compared to core +0.10%. My confidence in that is lower than usual because of something quirky with my spreadsheet, but it highlights that the core was dragged down by large declines from small categories.
The best observation of the day wasn’t mine. The problem with pulling in data automatically, rather than reading the report, is you will miss the footnotes! And the footnote pointed out by @TOzgokmen was a very important one. It slaps much larger-than-normal error bars around what are already more volatile-than-normal data. I suspect that this was not likely to have a big effect on rent data collection, but more likely on goods and services where specific outlets were likely to be closed by the bad weather. I may be wrong about that, but it does go a long way to helping understand the weird fact that rents were solid (instead of weak as expected) and goods prices were weak (instead of strong as expected). One never should put too much weight on any one month’s figure, but this diminishes the anecdotal value even more. On to next month.
Summary of My Post-CPI Tweets (January 2021)
Below is a summary of my post-CPI tweets. You can (and should!) follow me @inflation_guy. Or, sign up for email updates to my occasional articles here. Investors, issuers and risk managers with interests in this area be sure to stop by Enduring Investments!
- Welcome to #CPI Day 2021! We get the last of 2020’s CPI figures today.
- There’s always volatility in year-end figures, and this one is no exception. Last month, in fact, was pretty weird. In the Nov CPI we had soft housing, very strong Apparel. Broad softness sprinkled with some large moves in small categories. My write-up: Summary of My Post-CPI Tweets (December 2020)
- As a result, while core CPI was higher-than-expected, Median inflation (which is a steadier measure) was soft. However, skewness on the upside is DIFFERENT from the way we’ve seen it for a while and I’ll be interested to see if that remains.
- Economists’ consensus is that Core is gonna soften – the m/m core CPI consensus is around 0.12%. I think that’s mostly a call on rents, which have been softening.
- But here’s the thing – rents haven’t really been softening much outside of big cities. What has been changing is that landlords have been expecting less rent due to financially-stressed tenants. This shows up in CPI as softening average rent growth.
- And that could change, although probably not until next month. Payments looked soft in December. But rent tracker indices have payments a bit better this month, and they should be: there was just another Federal money drop.
- Next month or two, we should see a rebound in rents. And in the long run, we definitely will because home prices are jumping and these two can’t diverge forever.
- Away from Shelter, dislocations in the supply chain remain and part of the trick over the next 6 months is going to be teasing out the COVID effects from the long-term effects. Freight costs have risen steeply and there are goods shortages in places b/c of container shortages!
- Another category I’m watching that has been weak for a while: Medicinal Drugs. Interestingly, this month (again, probably starts to hit Jan CPI when it is released next month) some major pharma manufacturers announced price increases.
- Not a huge surprise: pharma prices had been suppressed when President Trump was threatening to introduce Most Favored Nation rules (saying companies can’t charge Americans more than other countries). Pharma played nice. CPI-Medicinal Drugs is negative y/y!
- I wrote about that here: Drug Prices and Most-Favored-Nation Clauses: Considerations back in August. But the Biden Administration won’t be doing that. Ergo, it’s safe to raise prices again. And they have. We’ll see how much – starting next month.
- That’s all for the walk-up. Expect volatility! I will probably focus on the ex-shelter number. BTW, be aware that monthly comps get super easy after this month, for a few months. Core CPI will be over 2.5% y/y, probably, by April & push 3% in May. Then the comps get much harder.
- Do remember, as I constantly remind: the #Fed doesn’t care one bit about inflation. But if YOU do, and have interests in how to hedge/invest in the inflationary period approaching, visit https://enduringinvestments.com
- And one more note: I will be on Bloomberg TV with @adsteel and @GuyJohnsonTV at 10:10ET this morning. And my interview with @MetreSteven on @RealVision just dropped this morning. A lot happening in inflation today!! Good luck…
- Core CPI was +0.09%, a touch softer than expected. Y/Y at 1.62%.

- Seems like Dec is always weak…even accounting for the seasonals! Let’s see. Primary rents rose 0.10%, y/y declined further to 2.28% from 2.45%. As I said, that will start changing soon. OER was +0.14%, y/y down to 2.17% from 2.28%.
- Apparel took another big jump, +1.36% m/m. That’s part of the general strength in core goods. Core goods at 1.7% y/y, up from 1% just three months ago!
- Check THIS out. Core goods inflation above core services inflation for the first time in years. Since the GFC, actually. A lot of that is supply chain folks. But a lot of it is people buying products with government money drops.

- That rise in core goods happened even with CPI-Used Cars and Trucks -1.15% on the month, second weak month in a row. Looks like the used car prices in the CPI aren’t going to catch up with the private surveys on the upside, as they didn’t on the downside.

- Airfares slipped -2.29% after +3.49% last month. Lodging Away from Home flat vs +3.93% last month. Motor Vehicle Insurance though continued to rebound, +1.42% after +1.23% last month. Those are my main “covid categories.”
- In Medical Care, which was down for the second month in a row: Medicinal Drugs -0.24% (y/y down to -2.13%!), Doctors’ Services -0.02% (y/y to 1.74%), Hospital Services +0.30% (y/y 2.99%).
- I’ve said it before and I’ll say it again. It’s hard to measure medical care, but these are just silly numbers. I doubt doctors are charging less when their costs have gone up enormously. But perhaps they’re charging CONSUMERS less, and we’re measuring consumer prices? Hmm.
- CPI for Medicinal Drugs, y/y. Come on, man.
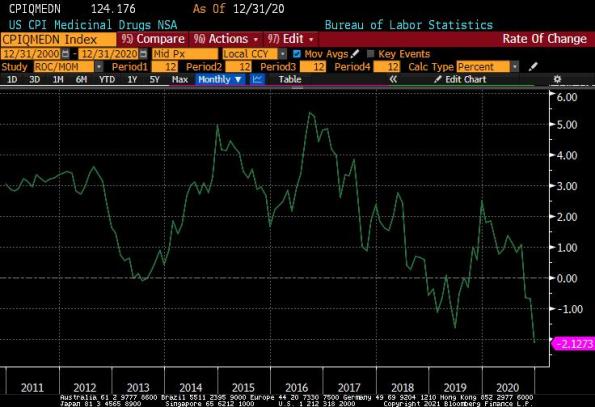
- Core inflation ex-shelter was roughly unchanged this month, +1.45% y/y. Was +1.46% last month. It hasn’t been much higher than 1.7% since 2012.
- So only two categories had large negative changes: Car and Truck Rental, -49.9% annualized, and Used Cars and Trucks, -12.96%. The latter coming down from a high level. But long list of >10% gainers again:
- >10% annualized: Jewelry and Watches (39.5%), Men’s/Boys Apparel (+31.8%), Women’s/Girls Apparel (+18.3%), Car Insurance (+17.9%), Misc Personal Goods (+15.5%), Personal Care Goods (+12.9%), Tobacco/smoking (+12.9%), Misc Personal Svcs (+10.8%).
- Those are just non-food and energy. Also >10% annualized increases in Dairy, Nonalcoholic Beverages, Fuel Oil, and Motor Fuel. But we know those are volatile. I include them in case anyone says “the government ignores milk.”
- Anyway, Median should be soft again but not as soft as core this month. Median category will be a housing regional so it’s just a guess but I’m saying +0.13% m/m, 2.23% y/y. Core will actually pass over Median in a few months, I think, due to base effects.
- College Tuition and Fees: +0.74% y/y vs +0.58%. I’ve talked elsewhere about how there’s a quality change here that the BLS knows about but is ignoring for now b/c should reverse: online college ain’t same as in-person college.
- University costs themselves are up a lot. Talked at length to a university CFO consultant yesterday and they believe many of these costs will remain BUT there are some really interesting applications of virtual education that I can’t fit in here. 🙂
- Circling back, just want to put the Apparel jump into context. Here is the Apparel price level index. So acceleration in 2011 (after years of nothing), slow deflation, crash into COVID, and just recovering some pricing power. Will be interesting to see how far it extends.

- Update to our OER model. And honestly, everyone’s model looks something like this – lagged effect of home price rises is a big contributor, as are incomes, to where rents should go. But we’re looking at measured rents ADJUSTED for non-collection. That’s the key.

- Here’s a fun one. 10-year inflation swaps are about to cross above current median inflation. That hasn’t happened in a long time. You would think the forward should be above, at least because tails tend to be to the upside, but they almost never are. At least, recently.

- Distribution of y/y price changes by bottom-level category. Big spike is OER of course. But a really wide dispersion otherwise. Chaos.

- Four-Pieces charts and then I’ll wrap up. Piece 1: Food & Energy.

- Piece 2: Core Goods. Wheee! Honestly this overshoots our models so I think at least some of it are dislocations. But some of it is real, too much money pushing too few goods. And some is the recently-weak USD, so if you get a much stronger dollar (@MetreSteven) it could change.

- Piece 3: Core Services less Rent of Shelter. This is the conundrum. I can’t imagine doctors services and hospital services stay depressed in this world. Other services may (office cleaning if there are no offices), but that’s also a consumption basket change. Stay tuned here.

- Piece 4, Rent of Shelter. I think this will start to reverse as early as next month when the next gov’t checks go out. And the Biden Administration promises more. So delinquencies should decline, raising measured rents.

- And that’s all for today. I’ll post a summary of these tweets in a bit. Remember to look up my interview on @RealVision, tune in to @BloombergTV at 10:10 to see me there, and visit http://EnduringInvestments.com if you need an inflation nerd!
Recent inflation prints have been held down by soft rents, and that continued this month. A lot of this is artificial: when landlords expect to collect less rent…which is not unreasonable during a recession…then this shows up as a decline in collected rents. But when/if those renters get more current, it shows up as a reacceleration in rents. That’s what I expect will happen, and it could happen soon since more Federal largesse is on its way. It’s an upside risk for the next few months. Although, in another sense, it isn’t really a risk: it’s what we should be expecting to see, given what is happening in home prices.
Rents are the main part of core services inflation. Because of the softness in rents and the softness in medical care services – which is a real head-scratcher – core services inflation fell below core goods inflation this month for the first time in a very long time. Now, normally you don’t see goods inflation in the middle of a recession, but then again normally Washington DC isn’t throwing thousands of dollars into the account of every family. Too much money: check. And supply chains are stressed. Too few goods: check. No surprise we’re seeing goods inflation.
So really, the wiggles in inflation we have seen over the last year are not particularly surprising in themselves, and it’s easy to explain them by falling back on the excuse du jour: “COVID.” Certainly, a lot of the chaotic pricing environment is due to Covid and the related disruption in our economic system. But the question is, what will happen on the other side? We have had massive money growth, with declining velocity until last quarter. Will velocity continue to decline? I am skeptical of that. Precautionary cash balances are higher than they ought to be, given where rates are, because people are nervous and when you are nervous you keep more in reserve. But this won’t be true forever. And we know that, behaviorally, the velocity of “found money”/windfalls is higher than the velocity of earned money, and moreover people are less price-sensitive when they spend a windfall. So I expect that as things go back to normal, inflation will rise – and probably a lot.
This is the test! Modern Monetary Theory holds you can print all you want, with no consequences, subject to certain not-really-binding constraints. The last person who offered me free wealth with no risk was a Nigerian prince, and I didn’t believe him either. I will say though that if MMT works, then we’ve been doing monetary policy wrong for a hundred years (but then, we also leached people to cure them, for hundreds of years) and all of our historical explanations are wrong – and someone will have to explain why in the past, the price level always followed the GDP-adjusted money supply.
Now, over the next four or five months it will be much easier to believe the inflation story. While core inflation was +0.24% last January and +0.22% last February, it was -0.10% in March, -0.45% in April, and -0.06% in May. By mid-year, that is, we will be around 2.8% core CPI y/y (if we just get 0.2% per month) before the comps turn much more difficult. Even though this is fully known, and even though it will therefore be a violation of the Efficient Markets Hypothesis, it will not stop people from becoming alarmed and for the markets to respond accordingly! So buckle in – at the very least, the first half of 2021 will be extraordinarily interesting.