Archive
Ripping The Bandage
As a follow-up to yesterday’s article, we take note of the home price data in today’s reports. New Home Sales median prices didn’t echo the spike in existing home sales, but as I said yesterday it is hard to draw much conclusion from this series, when there is so little volume that prices jump around significantly (see Chart, source Bloomberg).

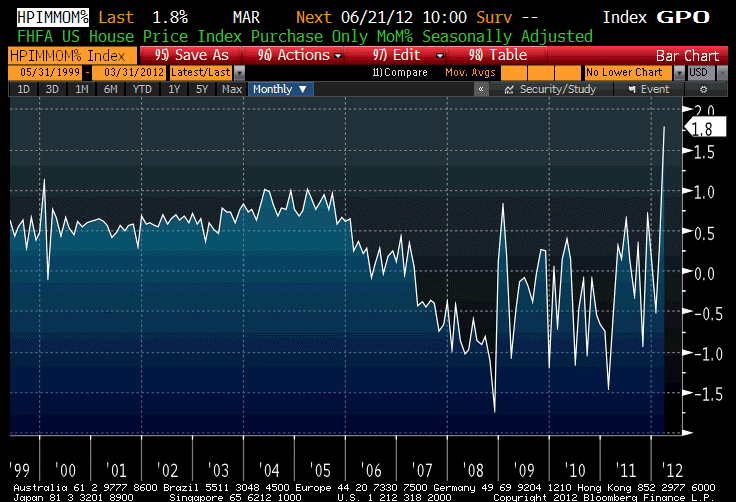
However, on the other side the FHFA Home Price Index showed its biggest leap in at least a couple of decades. Again, one point does not a trend make, but the odds that existing home prices are actually rising – at least for the homes that are changing hands – just went up again.
But not all observers agree, to be sure. Readers of yesterday’s comment fell into several natural categories. One large such category was the group that feels the large amount of shadow inventory that is held by banks in their REO books, as well as homeowners who are holding their homes off the market in hopes of higher prices, virtually guarantees lower prices.
I don’t disagree with the general notion. The housing overhang is certainly not cleared, and it will take a while for it to do so. But the expectation that this inventory will depress prices further is based on a misunderstanding of the supply and demand relationship. It’s really the fault of sloppy microeconomics texts, that tended to draw “supply and demand” charts with “Price” on the vertical axis and “Quantity” on the horizontal axis. This is accurate in the static equilibrium sense, when we are just taking a snapshot of the demand and supply curves to figure out the clearing price and quantity right now. But it glosses over an important detail and so misses conveying the richness of the relationship.
The “Price” axis need not be in dollars. There’s no reason that it must be so – any exchangeable good will do. If I have a supply and demand curve for Yankees tickets,[1] there is no reason that I can’t have the ‘price’ axis in units of cups of beer. (In actual fact, that exchange regularly happens, as when one person says “come on buddy, I’ll take you to the game and you buy the beer.”) The curves will look similar, and there will be an intersection quantity and the clearing price will be in units of beer cups. Or ounces of gold. Or acres of farmland.
By putting the units in terms of dollars, we have to be very careful about interpreting shifts of the supply curve or the demand curve. Importantly, we must remember that when we shift those curves the assumption is that the shift happens instantly. When we use units of price that change in value constantly – as does the dollar – the intersection of quantity and price can move just because time passes. It is perhaps more useful to think of the “Price” axis as being in terms of “consumption baskets.” How many consumption baskets will I exchange for that new car? Let’s say the answer is ten. Next year, the answer will still be ten (assuming no change in my preferences). But if I answered in dollars, then the answer is different, and will tend to rise over time as the value of that dollar diminishes.
So yes, to clear excess housing inventory it’s essential that home prices fall. But it isn’t essential that they fall in nominal terms. If home prices rose 5% next year, but the price of everything else went up 25%, homes would be cheaper. This is actually better than seeing nominal prices fall by 20%, because it removes any incentive to default on a mortgage that is fixed in nominal terms.
Remember: supply and demand cross at the clearing real price and quantity, not the clearing nominal price and quantity, unless we are explicitly speaking only about an instantaneous equilibrium.
This misunderstanding is the same one that is at the heart of the commodities slide, which is beginning to feel to me more like momentum trading than investment flows. I keep hearing that commodities are declining on growth fears, but if that is so then why are coffee, hogs, and cotton leading the way down and not gasoline and copper? (And, by the way, how come when stocks decline it’s a “buying opportunity” but when commodities go down, everybody thinks the world is coming to an end?) Commodities got pummeled again today, with the DJ-UBS down by -1.6%. Stocks got smacked early on and played with the 1300 level again, but managed a rally in the afternoon and actually ended with a gain of +0.2%. Bonds rallied again, and inflation swaps fell.
The near-term concern of course is Greece, with more and more stories coming out confirming that various European institutions have been developing “contingency plans” in the event that Greece leaves the Euro. Some observers think that Greece might even do it this weekend.
Once you’ve decided that the bandage needs to come off, the best way to take it off is to just rip it off in one motion. So, if Europe has finally come to that view, then the right thing to do is to just go ahead and do it at a time of your own choosing rather than letting events take the timing out of your hands. I seriously doubt that Greece will leave the EZ this weekend, with an election just a few weeks away, but it wouldn’t completely shock me. I’m more shocked by the idea that all of these institutions are just now developing their contingency plans, when it has been clear for months, years even, that Greece had to leave the Euro. And I am a little shocked that markets apparently had completely discounted this possibility until recently, and are surprised.
Thursday’s economic data consists of Durable Goods (Consensus: +0.2%/+0.8% ex-Transportation), which ought to show a partial rebound after an awful -4.2%/-1.1% showing last month. Initial Claims are expected to be unchanged at 370k. And liquidity will begin to suffer in the afternoon before a thin session on Friday.
[1] We assume here that they intersect above a zero price.
Real Estate – A Good Investment Again?
After the comparatively high-volume selloff on Friday, the stock market responded with a low-volume rebound on Monday (except for new IPO FacePlant, which is now 18.4% below the IPO price) and a low-volume, water-treading session today. Monday’s rebound was punctuated by chirps of “oversold!” from certain financial news networks, but unfortunately nothing fundamental has changed other than the price.
Existing Home Sales were reported today as-expected. Inventories of existing homes rose, but this was strictly in line with the normal seasonal pattern (see Chart, which I mainly show to illustrate a neat new Bloomberg function I discovered).

Using the same style chart, though, consider what happened to the median sales price of Existing Homes. Ordinarily, the non-seasonally-adjusted price in April is down 0-5% from year-end prices. This year, though, NSA prices are up about 10%.
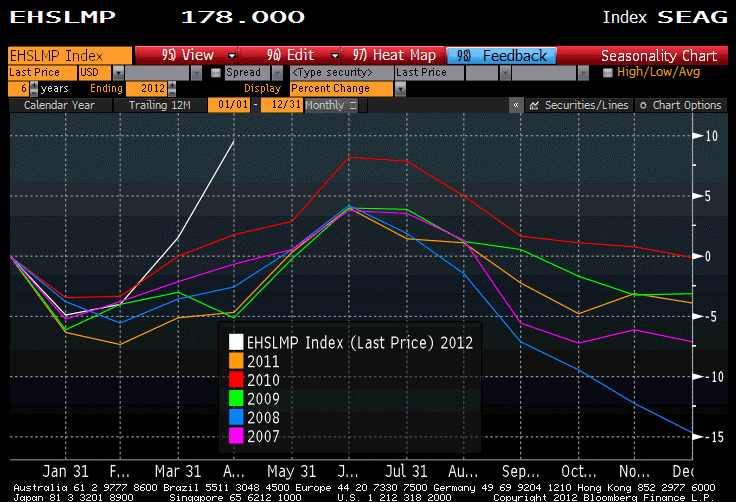
To the man who has a hammer, everything looks like a nail, it’s true. But to me, this is a remarkable chart that smacks of asset price inflation in housing. Consider that Existing Home Sales, at a 4.62mm seasonally-adjusted pace, are running at about 65% of 2005’s pace, and only 88% of 2000’s pace. The pace of sales is still quite a bit depressed, in other words, yet the year-on-year rise in prices is about 10.4% (see the chart below, which is a more-normal time series). Prices in other words rose much more-rapidly in April than they typically do at this time of year, despite the level of unemployment and other, various measures of economic softening.

Don’t read too much into one month’s data, even if it is entirely consistent with what should be happening given the accelerating rise in bank lending and the persistent rise in money supply. But be wary.
Housing is, as I’ve been writing for a while, near fair-value or even slightly cheap after a long period where it was overvalued compared to traditional relationships to income and rents. (The same people who today tell me I am too bearish on stocks are the ones who told me I was too bearish on housing back in the mid-2000s. But I’m not even that bearish on stocks – I’m just not bullish enough for some people!) It is, as commodities are, a classic “real asset” that doesn’t return very much, but tends to keep up with inflation over long periods of time. It ought to respond to money growth, now that the bubble seems to have run its course. However, I’m as surprised as you are that it seems to be happening – I thought, as did many of you, that housing prices would fall straight through fair value and become cheap. And they probably would have, had central banks not printed so much money.
Ironically, the other classic “real assets” are commodities, and they continue to get pummeled. The DJ-UBS index lost another 1% today, with grains and softs losing 3.4% and 2.4% respectively. I think that what is happening is that since commodities are traded and consumed internationally, it is easier to get confused about the role that the global growth dynamic should play. Case in point is cotton, which was -3.9% today and now sits 68% off the highs from March 2011. Someone in China mentioned that yarn production may drop below 20 million metric tons this year, from 20.5 million last year, due to weak global growth. -0.5 million tons translates into -68% on the price? That’s one inelastic supply curve! But weak global growth clearly shouldn’t really affect the price of a house in Idaho, so this error doesn’t translate as easily to housing as a real asset. Therefore, housing prices are now rising (maybe) while commodity prices trade incredibly cheap (although gasoline futures prices rose 5 cents on Monday).
It has been a long time since it was worthwhile to watch the housing numbers, but today’s pricing data raises my interest in the New Home Sales figures tomorrow (Consensus: 335k vs 328k). It isn’t the number of new sales that interests me; that number is low and even with a high-side surprise will continue to be low compared to old standards for a long time. But since the inventory of new homes is at a life-of-series low (see Chart) I will be looking for signs that the bids are starting to reach up for the offers.[1]
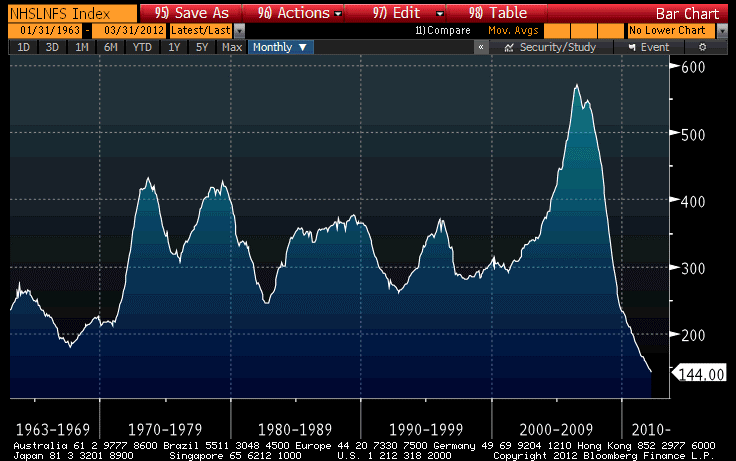
The median price series for New Home Sales isn’t as smooth as the one for Existing Home Sales, simply because the absolute number of sales is much smaller. But if there really is something going on in home prices, I’ll expect to see it in New Home Sales in the next month or two as well.
In any event, with 1-year CPI swaps ending today at 1.44% and 2-year swaps at 1.69% – let’s just say I wouldn’t want to be caught shorting that market at these levels! Core inflation is at 2.3%, so you’d better be expecting either a sharp fall in core or a huge drop in gasoline prices. Neither appears to me to be in the cards – there’s a better chance of gasoline prices falling in the near-term if there’s an economic train wreck in Europe, but in that case go out another year: the 2-year at 1.69% implies 1y, 1y forward inflation of only 1.94%.
[1] As an aside, a reader in Phoenix told me recently that bids there and in Vegas have been getting jumpy recently, all of a sudden starting a few months ago. “Pull up Redfin and try to call an agent about a property in Mesa, Tempe or Scottsdale. If a house is out on MLS more than a day they likely have 10 bids stacked with an agreement above the ask. This just started ~60-90 days ago and has accelerated. Crazy, like no one remembers 2008-2010.” It was an interesting anecdote – but now the data are reinforcing that observation.
