Archive
AI: Even a Big Deal is Smaller Than You Think
So, we are back to the argument about whether we have reached a new era of permanently higher growth and earnings, and because of productivity also a permanent state of steady disinflationary pressures.
Live long enough, and you’ll see this argument come around a couple of times. In the late 60s with the “Nifty Fifty” stocks, in the 1990s with the Internet, and now with AI. As a first pass, it’s worth noting as an equity investor that the first two of those eras were followed by long periods of flat to negative real returns in equities. But my purpose here is simply to revisit the important fact that productivity is always improving, so something which improves productivity is normal and not exciting. The question which arises periodically when we see some really golly-gee-whiz innovation is whether that innovation can meaningfully accelerate the rate of productivity growth over time.
Total real growth over time is simply the growth in the labor force, plus the growth in output per hour (productivity). Assuming that the labor force grows at roughly the same rate as the overall population,[1] real GDP per capita should grow at roughly the rate of productivity. The chart below extends a chart which first appeared in an article by Brad Cornell and Rob Arnott in 2008 (“The ‘Basic Speed Law’ for Capital Markets Returns“), updated to the end of 2023Q3. Note that real earnings and real GDP grow at almost the same rate over time – the log regression slope is 2.09% for real per capita GDP and 2.17% for real earnings.

(By the way, although it isn’t part of my discussion here note that the middle line, real stock prices, isn’t parallel. It was, back when this chart first appeared in 2008; the fact that it isn’t any more is obviously attributable to increases in valuation multiples over a long period of time. Discuss.)
A permanent (or at least long-lived) increase in the long-run rate of productivity growth, then, would be massively important. It would mean that GDP per capita – standard of living, in other words – would rise at a permanently faster pace. This is the crux of the question, as I said above and as NY Fed President John Williams said in an interview with Axios a few days ago (ht Alex Manzara):
“One way to think of it is AI is – and this is my own, but based on what I heard from others – is AI is just that new thing that’s going to get us that 1% to 1.5% productivity growth that we’ve been getting for decades or even a century.
“It’s the thing that gets us that, just like computers did or other changes in technology and how we produce things in the economy. So it’s just the thing that gets us that 1% to 1.5% productivity growth.
“The other view, which I think has some support, is AI is more of a general purpose technology. …So there is a possibility that we could get a decade or more faster productivity growth if this really is its general purpose and revolution. You can’t exclude that.”
What Williams said, about AI being a “general purpose technology” that spurs faster productivity growth for a decade or more, is something that we honestly have a pretty good history of. The explosion of the internet into general use in the late 1990s triggered an equity market bubble that eventually popped. Greenspan mused, in late 1996, that it’s hard to tell when stock prices reflect “irrational exuberance” and in February 1997 he said “history counsels caution” because “…regrettably, history is strewn with visions of such ‘new eras’ that in the end have proven to be a mirage.”
Was it a mirage? There is no question, a quarter-century later, that the internet has completely changed almost everything about the way that we live and work. If there was ever a ‘general purpose’ technology that led to a sustained long-term increase in productivity, the Internet is it.
My next chart only goes back to 1979. It shows US Nonfarm Business Productivity, calculated quarterly by the BLS as part of the GDP report. Obviously, the quarterly numbers are incredibly volatile – so much so, in fact, that I’ve truncated a large portion of the tails. It’s devilishly hard to measure productivity. More on that in a moment. The red line is the 20-quarter (5-year) moving average. The average over the whole period is…surprise!…1.92%, very close to the average increase in real earnings and real GDP per capita. As I said before, that’s what we expected to find.

But there is certainly a bulge in the chart. Noticeably, it doesn’t happen until long after the internet hype had crested, but it is definitely there. The average on this chart from 1979-1998 is 1.78%, and the average since 2005 is 1.59%. But the average from 1999-2005 inclusive is a whopping 3.11%. An acceleration of productivity growth of 1.4% or so, for 7 years, means that our standard of living moved permanently higher by about 10% during that period, over and above what it would have done anyway.
That’s meaningful. I would also argue that it’s probably the upper limit of what we should expect from the AI revolution. Starting in few years, if this is a “general purpose technology” advancement, we could conceivably see growth accelerate by 1.5% per year for some part of a decade. Let’s all hope that happens, because that 10% total growth is the real growth – it is extra growth without any extra inflation. A free lunch, as it were. I say that’s probably the rough upper limit because I can’t imagine how the AI revolution could possibly be more impactful than the internet revolution was, or any of the other major technology revolutions we have seen over the past century.
That’s the good news. If this is real, it would be a wonderful thing and there’s some historical evidence that when the market gets excited like this, it might not be entirely a mirage. Now the bad news. If this is an internet-style leap forward, the aggregate incremental increase in real earnings we should expect compared with the normal trend is…10%. Not a doubling, or tripling, but 10%. Naturally, those gains will accrue to a smaller subset of companies at first, but the other lesson of the internet boom is that those gains eventually percolate around because that’s the whole point of a “general purpose technology.”
Have we gotten our 10% yet? Seems like maybe we have.
[1] This assumption is clearly false, but it’s false in transparent ways. Right now, the population is growing faster than the labor force due to immigration. As Baby Boomers retire, the labor force will grow more slowly than the population. Etc. The assumption here is not meant to be uniformly and universally true, but approximately true on average so as to make the general point which follows. To the extent that this assumption is transparently incorrect, we know how to adjust the general point which follows, for the specific conditions.
Inflation Subcomponents – Time for Trading Draws Near
The topic of this blog is somewhat different than my other posts. In these articles, I am typically taking the role of an economist or analyst (talking about some particular insight into how inflation is evolving), an educator (explaining some aspect of how inflation works, or how one might forecast it or a piece of it), or a trader/investor (describing how prices for securities in inflation-linked or inflation-adjacent markets are discounting different possible…or sometimes nearly impossible…outcomes).
Today, I want to write in my role as an evangelist.
Almost exactly 20 years ago, I delivered a speech at Barclays Capital’s Inflation Conference at Key Biscayne, Florida entitled “CPI Futures and OTC Derivatives – Practical Applications.” I had led the way the prior year in starting to make markets on US inflation swaps in interbank markets, and we were about to see the launch of the CPI Futures that I was the instigator of and the sole market-maker for. It was a heady time, and excitement at the conference for these new developments in inflation was palpable. I practiced my presentation until I knew it so well that I was able to recite it word for word while going on an 8-mile run the day before. I don’t mind saying that I killed it. I was a terrific evangelist.
Unfortunately, sometimes the evangelist preaches things that don’t happen on schedule. In my presentation, I showed the classic picture of the “March of Progress” and declared that within five years from that date, inflation markets would have swaps, options, futures, options on TIPS, swaptions, and most importantly the ability to trade inflation subcomponents, like Medical Care or College Tuition so that each customer could create his own customized inflation basket reflecting his own inflation exposure.

I was off by (so far) about 15 years. Now, there were some close brushes with this vision.
In 2004 I tried (and failed) to get Barclays to issue inflation-subcomponent bonds representing slices of TIPS held in a trust (essentially the way that the Treasury’s STRIPS program started as LYONs and TIGRs back in the early 1980s). “Barclays Real Accreting-Inflation Notes,” aka BRAINS, I called them (because I really wanted to hear salespeople telling their clients to get some BRAINS)…but we could never get it done. Also, many readers of this column are already familiar with the near-miss we had when I was at Natixis and in 2007-08 worked with Bob Shiller and got really close to issuing a security that would have allowed for transparent trading of Medical Care inflation, before the global financial crisis intervened. Most recently, TBAC toyed with the idea of Treasuries linked to subcomponents of CPI back in 2019. But though we have tried, we haven’t gotten there yet.
However, I’m growing more optimistic. I recently spoke with the founders of IMX Health, which was launched a couple of years ago with the intention of creating instruments with which to hedge healthcare exposure and recently got approved to be a DCM (designated contract market – aka a futures exchange). Unfortunately, their first futures contract launch will be on medical care stocks but in person they seem earnest about the mission of making healthcare tradeable…even drilling down to specifics of price and utilization of different types of care. And I continue to be optimistic that Kalshi, where you can today trade binary contracts based on headline, core, used car inflation, and several other markets, will be approved this year to offer traditional-structure inflation futures contracts as well.
It took a couple of decades, and it wasn’t always pretty, but we’re getting there.
Until such time as these markets are launched and become accepted, though, we can trade over the counter. So why don’t we? To start some conversations, I’ve put up some hypothetical basis markets on a view-only Google sheet here. Now, I don’t have capital set aside to actually take either side of these markets, so consider these indicative broker quotes for now, based on some vague guesses I have about where these things might trade. Tell me what you think! And if you’re interested in finding the other side and doing a real transaction, let me know and I will look around and…who knows? Maybe we can get these component markets started today.
Inflation Guy’s CPI Summary (Jan 2024)
This is the reason that serious people don’t choose a trend length that happens to fit with their narrative. For the last few months, supposedly-serious economists have crowed about how the 3-month average of seasonally-adjusted CPI was at a new post-COVID low. (Most of those same economists, only a few months ago, were focused on the 6-month average, but when that started crawling higher they switched to the 3-month average.) And indeed, it was exciting. Headline CPI was down to 1.89% on a seasonally-adjusted-three-month-average; core CPI was at 3.30%. Victory over inflation was proclaimed! Inflation was back at target, even a bit below, so the Fed should start easing policy forthwith.
Fortunately, and maybe surprisingly, Chairman Powell is built of stronger stuff.
As a ‘Cliff’s Notes’ guide to what you’re going to read: all of those folks who loved the 3-month average when it was 1.89%, aren’t going to be as vocal about it now that it’s at 2.80%. Core, on a 3-month average basis, is at 3.92%. The 6-month averages also rose.
Now, this doesn’t mean that inflation is necessarily headed back higher yet. I’ll get to that in a bit, but I will allow as how the picture of m/m core CPI, below, might be perceived by some as discouraging.

Prior to this figure, consensus was for a fairly strong report, 0.16% on headline and 0.28% on core. I thought it would be softer, because rents on the basis of my model should start to decelerate soon. But, as I said in my podcast, if rents were high then you should look past rents. They’re going to decelerate over the next 6 months or so, to around 3% y/y, and then re-accelerate. That’s all baked in the cake, and it will flatter the inflation data. But it hasn’t happened yet! OER was a massive +0.56% m/m. Primary Rents were more in line with what I was looking for, with a small deceleration to +0.36% m/m from +0.39% last month. The indices are still decelerating…just not as rapidly as I think anyone (myself included now!) expected.

Lodging Away from Home was +1.78%, which was a big m/m figure and contributed to the overall housing subindex being +0.62% m/m at a time when shelter should be decelerating.
But as I said, if this surprise was all OER then we can look past it.
Core Goods was weak, which was a downside surprise. Used Cars fell -3.37% m/m, which is far worse than any surveys saw this month…but as I pointed out last month, Used Cars had been surprisingly strong compared to the private surveys so this is partly a make-up and it contributed to the weakness in Core Goods.

Medicinal Drugs was also weak, -0.54% m/m, and that’s also in Core Goods. Overall, Core Goods – which had shown some signs of life – dropped back to deflation y/y this month.

Going forward, I don’t think core goods will stay in deflation. Partly, that’s because supply chains are being stressed again due to drought in the Panama Canal and the effective shutting of the Red Sea to container traffic, but it’s also partly because there is continued interest in ‘nearshoring’ which will raise costs (after all, it was to lower costs that firms offshored stuff in the first place. And then there’s also this, for the medium term. To be sure, this level of growth in Personal Consumption in the past was consistent with mild deflation – but that was pre-nearshoring. The direction is what I’m interested in, but I also think that for a given amount of PCE growth, we will see more core goods inflation in the future.

So now we turn to the really interesting part of the report, and that’s core services ex-shelter. I’ve been saying for a while that this category was going to be a sticky wicket because wages are still rising at a 5% y/y pace. And indeed, the wicket is sticky. This month, airfares rose +1.4% (this may have been related to jet fuel tightness on the east coast), but also again we saw a continued acceleration to Hospital Services, which rose to the highest y/y rate (+6.7%) since 2011.

Overall, core services ex-shelter (so-called “Supercore”) rose +0.85% m/m, the biggest rise in a couple of years, and the y/y measure is in an upswing.

Overall, this report is deflating…pun absolutely, 100% intended…for those who thought that inflation is settling gently back to target and that the Fed therefore can lower interest rates back to where we have a God-Given Right to have them, 2% or so. Not so fast! Median, by the way, was also a scintillating +0.53% m/m, the highest since last February. Thanks to base effects, the y/y Median CPI was essentially flat, at 4.90% y/y.

Because of the deceleration in housing I expect, I continue to see Median slowing to the high-3s, low-4s over the middle of this year. But it is going to have a hard time getting lower than that. In the short-term, we have saucy performance from core services ex-shelter. In the short- and medium-term, core goods is going to get out of deflation (although I don’t expect it to rise very far). And then housing should re-accelerate, though not back to the old highs. In short, inflation is a long way from being beaten. I am sure that somehow, that’s bullish for stonks, but I can’t figure out why. (I hear the 3-month moving average of the last four months of CPI, dropping the highest month, looks good.)
When to Own Breakeven Inflation
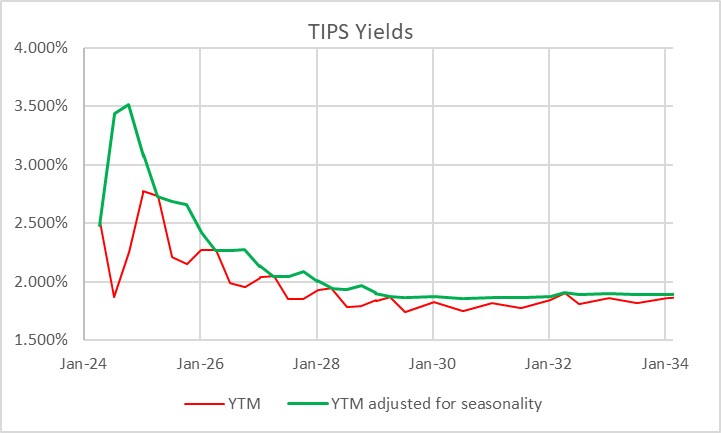
It is interesting to me that, with as important and liquid as the inflation-linked bond market is, tactical allocation between TIPS and nominal bonds is at best an afterthought for most investors. Perhaps this is because TIPS – if you think in nominal space, like most investors do – can be quirky and complex to analyze on a bond-by-bond basis. Here’s a picture of the TIPS yield curve. The red line is the way that TIPS real yields are calculated, and therefore the curve as perceived in the market. The green line is the true yield curve, adjusting for the way the seasonality of inflation prints affects each particular bond.
That’s understandable, but I don’t think it’s sufficient. Most investors do not invest in individual bonds, especially in TIPS space. They invest via mutual funds or ETFs, although the ‘laddering’ of TIPS to form a crude inflation-linked annuity is a popular approach amongst do-it-yourselfers. So why do so many investors own nominal bonds, instead of inflation-linked bonds, as an immutable strategic allocation? Even those who make occasional tactical shifts into TIPS seem to do so when they are expecting inflation to rise, and so are making a macro call instead of a quantitative call. But there are lots of times when owning TIPS instead of nominal bonds is just a good bet, regardless of your immediate inflation view. The most obvious one I wrote about back in March 2020 in “The Big Bet of 10-year Breakevens at 0.94%,” and I’ve also written generally about why you might want to be long inflation-linked bonds even if the current level of implied inflation (aka ‘breakevens’) is near to fair on the basis of your own view about the trajectory of inflation (see “A Guess at the Value of Long Inflation Tails” as an example).
But the times when just being long TIPS instead of nominals…or being long breakevens or inflation swaps if you do it as a leveraged play…is advantageous are not limited to unusual circumstances. TIPS also have tended to be systematically cheap over long periods of time, which I’ve also documented. Another way to consider the same question is to ask, “if I bought 10-year breakevens when they were at a particular level, how would I have done historically?” Or, equivalently, “if I had switched into 10y TIPS, instead of 10y Treasuries, when the spread was at a particular level, how much would I have out- or under-performed historically?” The chart below answers that question.

I went back to February 1998. For each of 6,453 days (ending in June 2023 since I had to look forward 6 months) I considered the starting 10-year breakeven rate and calculated the return to being long that breakeven over the next 6 months.[1] That return is dependent on the relative yields of the different securities, how those yields (and hence the breakeven) changed over time, and how actual inflation developed. It’s worth pointing out that this time period, core inflation was below 3% for 90% of the time. Ergo, you wouldn’t expect to have lots of big wins because of inflation surprise, although of course toward the end of the historical period you did.
The chart shows for each bin (I threw all 58 days with 10-year breakevens lower than 0.75% into the same bucket, which turned out to be equal to the number of days in the 2.75%-3.00% bucket) what the average 6-month return was to being long 10-year breakevens along with the 10th percentile and 90th percentile. So you can see that on average, you didn’t lose money being long breakevens anywhere under 2.50%, despite the fact that inflation throughout this period was very low. That’s a function of what I said before, that TIPS in general were cheap throughout this period. And if you bought breakevens (or switched into TIPS) any time that the breakeven was below 1.5%, you had a 90% or better chance of winning.
Naturally, it shouldn’t be a surprise that if you buy breakevens at a cheap level – as with any asset – you stand a better chance of winning than if you bought it at a dear level. What is a little more of a surprise is that there hasn’t historically been very much pain, on average, to being long breakevens even when they are high. In fact, unless you bought breakevens above 2.75% – basically, one event in 2022 – you had at least a 40% chance of winning your bet (10y TIPS outperforming).

This isn’t to say that there aren’t a lot of ways to lose, trading or investing in TIPS. Like any other investment, they can lose money and in 2022-2023 being naked long TIPS was almost as painful as being naked long any other fixed-income instrument. Almost. You did lots better than if you’d owned nominal Treasuries through the same episode!
[1] I used the Bloomberg US 10 year Breakeven Inflation Index, which is a total return index (BXIIUB10 Index on Bloomberg), from its inception in 2006; prior to that I used Enduring Investments calculations which utilized roughly the same methodology.