Archive
Summary of My Post-CPI Tweets (February 2020)
Below is a summary of my post-CPI tweets. You can (and should!) follow me @inflation_guy. Or, sign up for email updates to my occasional articles here. Investors with interests in this area be sure to stop by Enduring Investments (updated site coming soon). Plus…buy my book about money and inflation. The title of the book is What’s Wrong with Money? The Biggest Bubble of All; order from Amazon here.
- Welcome to CPI day! Before we get started, note that at about 9:15ET I will be on @TDANetwork with @OJRenick to discuss the inflation figures etc. Tune in!
- In leading up to today, let’s first remember that last month we saw a very weak +0.11% on core CPI. The drag didn’t seem to come from any one huge effect, but from a number of smaller effects.
- The question of whether there was something odd with the holiday selling calendar, or something else, starts to be answered today (although I always admonish not to put TOO much weight on any single economic data point).
- Consensus expectations call for +0.2% on core, but a downtick in y/y to 2.2% from 2.3%. That’s not wildly pessimistic b/c we are rolling off +0.24% from last January.
- Next month, we have much easier comparisons on the y/y for a few months, so if we DO drop to 2.2% y/y on core today that will probably be the low for a little while. Feb 2019 was +0.11%, March was +0.15%, April was +0.14%, and May was +0.11%.
- So this month we are looking to see if we get corrections of any of last month’s weakness. Are they one-offs? We are also going to specifically watch Medical Care, which has started to rise ominously.
- One eye also on core goods, though this should stay under pressure from Used Cars more recent surveys have shown some life there. Possible upside surprise because low bar. Don’t expect Chinese virus effect yet, but will look for signs of it.
- That’s all for now…good luck with the number!
- Small upside surprise this month…core +0.24%, and y/y went up to 2.3% (2.27% actually).
- We have changes in seasonal adjustment factors and annual and benchmark revisions to consumption weights this month…so numbers are rolling out slowly.
- Well, core goods plunged to -0.3% y/y. A good chunk of that was because Used Cars dropped -1.2% this month, down -1.97% y/y.
- Core services actually upticked to 3.1% y/y. So the breakdown here is going to be interesting.
- Small bounce in Lodging Away from Home, which was -1.37% m/m last month. This month +0.18%, so no big effect. But Owners Equivalent Rent jumped +0.34% m/m, to 3.35% y/y from 3.27%. Primary Rents +0.36%, 3.76% y/y vs 3.69%. So that’s your increase in core services.
- Medical Care +0.18% m/m, 4.5% y/y, roughly unchanged. Pharma fell -0.29% m/m after +1.25% last month, and y/y ebbed to 1.8% from 2.5%. That goes the other way on core goods. Also soft was doctors’ services, -0.38% m/m. But Hospital Services +0.75% m/m.
- Apparel had an interesting-looking +0.66% m/m jump. But the y/y still decelerated to -1.26% from -1.12%.
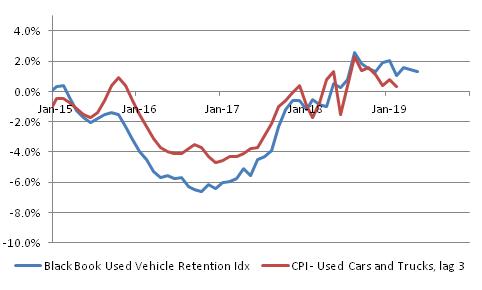
- Here is the updated Used Cars vs Black Book chart. You can see that the decline y/y is right on model. But should reverse some soon.

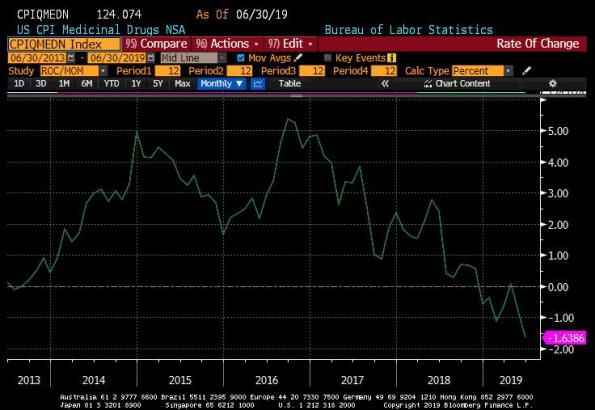
- here is medicinal drugs y/y. You can see the small deceleration isn’t really a trend change.

- Hospital Services…

- Primary Rents…now, this and OER are worth watching. It had been looking like shelter costs were flattening out and possibly even decelerating a bit (not plunging into deflation though, never fear). This month is a wrinkle.

- Core ex-housing 1.53% versus 1.55% y/y…so no big change there. The upward pressure on core today is mostly housing.
- Whoops, just remembered that I hadn’t shown the last-12 months’ chart on core CPI. Note that the next 4 months are pretty easy comps. We’re going to see core CPI accelerate from 2.3%.

- So worst (core) categories on the month were Used Cars and Trucks and Medical Care Commodities, which we’ve already discussed. Interesting. Oddly West Urban OER looks like it was down m/m although my seasonal adjustment there is a bit rough.
- Biggest gainers: Miscellaneous Personal Goods, +41% annualized! Also jewelry, footwear, car & truck rental, and infants/toddlers’ apparel.
- Oddly, it looks like median cpi m/m will be BELOW core…my estimate is +0.22% m/m. That’s curious – it means the long tails are more on the upside for a change.
- Now, we care about tails. If all the tails start to shift to the high side, that’s a sign that the basic process is changing.
- One characteristic of disinflation and lowflation…how it happens…is that prices are mostly stable with occasional price cuts. If instead we go to mostly stable prices with occasional price hikes, that’s an inflationary process. WAY too early to say that’s what’s happening.
- Appliances (0.2% of CPI, so no big effect) took another big drop. Now -2.08% y/y. Wonder if this is a correction from tariff stuff.
- Gotta go get ready for air. Last thing I will leave you with is this: remember the Fed has said they are going to ignore inflation for a while, until it gets significantly high for a persistent period. We aren’t there yet. Nothing to worry about from the Fed.
Because I had to go to air (thanks @OJRenick and @TDAmeritrade for another fun time) I gave a little short shrift on this CPI report. So let me make up for that a little bit. First, here’s a chart of core goods. I was surprised at the -0.3% y/y change, but it actually looks like this isn’t too far off – maybe just a little early, based on core import prices (see chart). Still, there has been a lot of volatility in the supply chain, starting with tariffs and now with novel coronavirus, with a lot of focus on the growth effects but not so much on the price effects.
 It does remain astonishing to me that we haven’t seen more of a price impact from the de-globalization trends. Maybe there is some kind of ‘anchored inflation expectations’ effect? To be sure, it’s a little early to have seen the effect from the virus because ships which left before the contagion got started are still showing up at ports of entry. But I have to think that even if tariffs didn’t encourage a shortening of supply chains, this will. It does take time to approve new suppliers. Still I thought we’d see this effect already.
Let’s look at the four pieces charts. As a reminder, this is just a shorthand quartering of the consumption basket into roughly equal parts. Food & Energy is 20.5%; Core Goods is 20.1%; Rent of Shelter is 32.8%; and Core services less rent of shelter is 26.6%. From least-stable to most:


 We have discussed core goods. Core Services less RoS is one that I am keeping a careful eye on – this is where medical care services falls, and those indices have been turning higher. Seeing that move above 3% would be concerning. The bottom chart shows the very stable Rents component. And here the story is that we had expected that to start rolling over a little bit – not deflating, but even backing off to 3% would be a meaningful effect. That’s what our model was calling for (see chart). But our model has started to accelerate again, so there is a real chance we might have already seen the local lows for core CPI.
 I am not making that big call…I’d expected to see the local highs in the first half of 2020, and that could still happen (although with easy comps with last year, it wouldn’t be much of a retreat until later in the year). I’m no longer sure that’s going to happen. One of the reasons is that housing is proving resilient. But another reason is that liquidity is really surging, so that even with money velocity dripping lower again it is going to be hard to see prices fall. M2 growth in the US is above 7% y/y, and M2 growth in the Eurozone is over 6%. Liquidity is at least partly fungible when you have global banks, so we can’t just ignore what other central banks are doing. Over the last decade, sometimes US M2 was rising and sometimes EZ M2 was rising, but the last time we saw US>7% and EZ>6% was September 2008-May 2009. Before that, it happened in 2001-2003. So central banks are providing liquidity as if they are in crisis mode. And we’re not even in crisis mode.
 That is an out-of-expectation occurrence. In other words, I did not see it coming that central banks would start really stepping on the gas when global growth was slowing, but still distinctly positive. We have really defined “crisis” down, haven’t we? And this isn’t a response to the virus – this started long before people in China started getting sick.
So, while core CPI is currently off its highs, it will be over 2.5% by summertime. Core PCE will be running up on the Fed’s 2% target, too. If the Fed maintains its easy stance even then, we will know they are completely serious about letting ‘er rip. I can’t imagine bond yields can stay at 2% in that environment.
Summary of My Post-CPI Tweets (January 2020)
Below is a summary of my post-CPI tweets. You can (and should!) follow me @inflation_guy. Or, sign up for email updates to my occasional articles here. Investors with interests in this area be sure to stop by Enduring Investments or Enduring Intellectual Properties (updated sites coming soon). Plus…buy my book about money and inflation. The title of the book is What’s Wrong with Money? The Biggest Bubble of All; order from Amazon here.
- The first CPI day of 2020! Although technically, this is the last print from the 20-teens.
- The next decade ought to be very different from the last decade, from an inflation perspective. No more wondering if deflation is sneaking up on us, which is how 2010 began. I suspect we will spend more time worrying about how to put the inflation genie back in the bottle.
- As the saying goes, letting the cat out of the bag is a heck of a lot easier than gettin’ him back in.
- But let’s be more myopic for now: month on month. Consensus on core CPI is for +0.18% or so, which would keep y/y at 2.3% unchanged from last month.
- To tick y/y core back to rounding to 2.4%, we only need 0.22% m/m on core CPI, so that’s more likely than the weakness we would need to see it tick down to 2.2%.
- Last month in fact we saw 0.23%, which is right on the 6-month average core print. The only reason y/y is as low as it is, is because Feb-May last year were all 0.11-0.15% prints. Which is to say that the comps get easier starting in March (with Feb’s number).
- Last month’s +0.23% came with softish housing, too. So there are some underlying upward pressures beyond housing. Medical Care has been getting the most attention so we will be attentive to any continued upward pressure there.
- Also watch this month for an apparel bounce-back. Big drop last month, most likely due to the placement of Thanksgiving and the BLS’s new methodology which has induced lots of volatility to the series.
- Downwardly, Used Cars remain a risk with private surveys showing softness there. And we’ll watch housing again. A sea change in housing would be a big deal. No real sign of that yet, and in fact housing has been running hotter than our forecasts by a tiny bit.
- That’s all for now…good luck with the number. 5 minutes.
- Weak CPI print, +0.11% on core…y/y just barely rounded up to 2.3% y/y. I said a downtick would be hard…but this was weak enough that it was very close.

- Used Cars was quite weak, at +0.76% m/m, but that’s not super-surprising. The y/y at -0.68% (from -0.44%) is roughly in line.
- Another usual suspect, Lodging Away from Home, plunged -1.75% m/m, putting the y/y to -0.28% from +3.26%. So a big, anti-seasonal move there. But LAfH is only 1% of CPI.
- Overall housing was okay…OER +0.24% and Primary Rents +0.23% m/m, meaning that they upticked slightly y/y to 3.28% (vs 3.26%) and 3.69% (vs 3.66%) respectively. So it isn’t the big components there.
- Yet Housing as a whole subgroup was only +0.10%. Was that all LAfH? Need to check.
- Medical Care accelerated further, +0.57% m/m.

- Medical care jump led by a large +1.25% m/m rise in Pharma (Medicinal Drugs).

- The increases in the broad medical care components tends to support my prior suspicions that the big rise in CPI for health care insurance was a case of BLS not catching what was actually moving, so it appeared to show up in the insurance residual. That residual is still high…

- Struggling finding anything (other than used cars and lodging away from home) that was really weak. Apparel was +0.40% m/m, so we got some of the bounceback. Recreation was a little weak, +0.15% m/m, and “Other” was -0.13% m/m…I need to dig deeper in housing though.
- Overall core goods was steady at +0.10% y/y; overall core services was steady at +3.0% y/y. So no super clues there.
- Here’s supporting chart for what I said about the weakness in Used Cars. Weak, but not surprisingly weak.

- Well, in Housing…Shelter, which includes rents but also includes Lodging Away from Home, decelerated to 3.25% from 3.32% y/y. Fuels and Utilities is -0.23% y/y vs +0.74%. And Household Furnishings/Operations +0.98% vs 1.61%.
- Looks like major appliances were heavy, down 1% m/m or so. But we’re talking a pretty small weight.
- So biggest m/m decliners (and annualized changes) were Lodging AfH (-19.1%), Public Transport (-16.3%), Car and Truck Rental (-14.7%), and Personal Care Products (-12.9%). Cumulatively that’s only 2.8% of the CPI, but big changes.
- Biggest m/m gainers aren’t in core: Motor Fuel (+39.6%) and Fuel Oil/Other Fuels (+27.4%). Medical Care Commodities (drugs) were +19.3%, and are in core, but as we have seen probably not a one-off. Then Meat, Poultry, Fish, and Eggs (can we just call this “protein?”) +16.7%.
- So we’re talking about a lot of left-tail things in core especially. Median looks to be over 0.2% again, though a little hard to say because one of the regional OERs looks like the median category. But y/y Median CPI should stay roughly steady at 2.92% is my guess.
- So core ex-shelter dropped a bit to 1.55% from 1.61% y/y. Still well off the lows. But if these left-tail one-offs are really one-offs, we would expect to see that rebound next month. Bottom line though is that 1.55% from non-housing isn’t very alarming yet.
- To kinda state the obvious, nothing here will have the slightest impact on the Fed. They’ve basically said they don’t care about inflation at these levels. “Wake me when it hits 3% on core PCE, then hit the snooze button for a year.”
- “In order to move rates up, I would want to see inflation that’s persistent and that’s significant. A significant move up in inflation that’s also persistent before raising rates to address inflation concerns: That’s my view.” – Powell, Dec 11 2019
- Let’s look at the four pieces charts in order from most-volatile to least. First, Food and Energy.

- Second, Core goods. This includes pharma, but also used cars, so right now the cars are beating drugs. (Don’t drink and drive, kids.)

- Core Services less Rent of Shelter. Now, this month overall was weak but this is starting to look more concerning thanks to Medical Care. I think we might be seeing this over 3% before long, given the signals from health care.

- And 4th piece: rent of shelter. So, flip side of the other core services is that rents might be softening..but at least aren’t showing an urgency to accelerate further. This was the reason I thought we’d see core peak in the 1st part of this year. I’m no longer confident.

- Ever feel like inflation was giving you the finger? Here is the distribution of price changes. The big one in the middle is OER. The one at the far right is gasoline. You can see there are a lot of left tail events still.

- Last one. Same data as the last chart, but this just sums all the categories over 3% y/y inflation. Obviously, when this goes over 50%, median is at least 3%. Because of rents, this is going to be close to 50%…but enough other categories are starting to scooch it there.

- Scooch being a technical term.
- OK, that’s all for today. The summary is that while the monthly number was soft, the underlying pressures are if anything getting a little firmer. Of course, the summary if you’re on the FOMC is, “CPI came out today? Really?”
As I said, nothing here will affect the Fed, at least for a while. I am sure some of them still pay attention to the CPI but they’ve made very clear that the only way inflation would affect monetary policy is if it went a lot higher, or a little bit lower. It may go a lot higher, but it won’t get there quickly. And core PCE, which is what the Fed supposedly focuses on (insider tip: they focus on whichever index is confirming their thesis), is more likely to accelerate from here since it overweights medical care – which is now trending higher – and underweights housing – which is looking soft – compared to private consumption. So, write off the Fed.
However, the “cyclical” ebbing of inflationary pressures that I had been expecting in Q1-Q2, mainly because I expected more softening in rents and I thought bond yields would be declining more in reaction to the slowdown in growth, aren’t apparent. It looks as if inflation might peak later than I had expected. Now, I never thought such a peak would mean inflation rolls over and goes to the lows of the last recession. Absent another collapse in housing, which does not appear to be in the offing, that isn’t going to happen. I thought inflation would stage a small retreat and then move to new highs when rates headed back up again. So far, though, I don’t even see much reason to think the peak is about to happen. Yes, rents are squishier than they were but it appears that medical care is moving fairly aggressively higher and interest rates don’t appear to be responding to the global slowdown in growth. So we might well be looking at a recession where inflation doesn’t slow very much.
In any event, the Fed’s response function make potential tail events a mostly one-way affair right now. They’ve warned you. Take appropriate precautions – which is relatively easy now as most inflation hedges (exception precious metals) are quite cheap!
Summary of My Post-CPI Tweets (December 2019)
Below is a summary of my post-CPI tweets. You can (and should!) follow me @inflation_guy. Or, sign up for email updates to my occasional articles here. Investors with interests in this area be sure to stop by Enduring Investments or Enduring Intellectual Properties (updated sites coming soon). Plus…buy my book about money and inflation. The title of the book is What’s Wrong with Money? The Biggest Bubble of All; order from Amazon here.
- Okay, about 10 minutes to CPI showtime so let’s review last month.
- We have had a couple of soft prints (<0.2% before rounding, one all the way to 0.1%, on core), but those followed 3 months of 0.3% monthly core prints. This month, consensus is for a soft 0.2% on core, something around 0.18%.
- last month, we saw weak core goods, a lot of that being vehicles and NOT surprising but general softness outside of vehicles mildly surprising.
- the bigger surprise was in housing, where Lodging Away from Home was very soft and both Primary and Owners’ Equivalent Rents were soft. That was the main story from last month.
- But of course we are also watching Medical Care carefully. The prior rise in Medical Insurance inflation, because of the way the BLS measures, might (or might not) be a proxy for as-yet-unsurveyed strength in other medical subcomponents.
- Those other medical care subcomponents HAVE been seeing some recent strength. So Core-Services-ex-Rents is something we are very interested in.
- Two other points. The first is that November had a very late Thanksgiving, so depending on when retailers adjusted prices for the retail season (generally lowering them) and when the survey mostly happened, there could be some seasonal volatility.
- If they did not lower their prices as early in the month, because Black Friday was later, that COULD mean we see strength that’s not seasonally expected. Don’t know but something to keep in mind. Built-in caveat for today.
- Second point is: the Fed doesn’t care. Powell says they’re not going to tighten unless inflation goes significantly higher and stays there a long time. So, you’re on your own!
- That’s all – grab a coffee and see you in 3 min.
- 2% on core, but stronger than expected…really 0.23% before rounding. Y/Y core stays at 2.32%
- Here are the last 12 core prints. Funny how one print can make the whole chart look more ominous.

- OK, first housing. Lodging Away from Home was +1.1% m/m after -3.84% last month, so as-expected bounce. Primary Rents were +0.26% vs 0.14% last mo and OER was +0.24% vs +0.18%. So softness was not repeated in housing.
- That said, the y/y figures in housing still declined, with Primary going to 3.66% vs 3.74% and OER 3.26% vs 3.31% prior. So those are big effects holding down y/y core. But core was unchanged y/y. So where were the gains?
- I should say those are the effects holding down further acceleration in core. Drippy housing means th other parts need to pick up the slack.
- Some of that is Medical Care. This month overall Medical Care CPI was +0.32% m/m, 4.24% y/y. That’s with soft Pharma CPI, -0.16% m/m and a scant 0.58% y/y.
- You can see Pharma is still rising, this is y/y.

- Doctors’ Services and Hospital Services also softer this month than last, but not huge.
- Core Goods overall slumped to +0.1% y/y from 0.8% just a few months ago. This month, the weakness in pharma helped but the y/y for Used Cars also fell to -0.44% from +1.43% previously. Expected some weakness, but that might be a bit overdone.
- Here is core commodities vs lagged import prices. Not super surprising that it is slowing.

- Core inflation ex-shelter basically unchanged, at 1.61% vs 1.60%.
- Unfortunately having some computer “issues” that is preventing my usual deeper dive in some of these categories.
- Oh, Apparel -2.29% y/y vs -0.34%. Again, the BLS’s new survey methodology is introducing IMO a lot of extra volatility in this series.
- Well, found the computer issue but it’s really that the BLS posted the subcomponents a little later than usual today. Won’t be fixed in the next few minutes and I have to go meet clients in Minneapolis. So I’ll wrap it up, a little short this month – sorry.
- I think the bottom line is that there isn’t anything super surprising here. The softness we had seen in housing took at least a temporary hiatus. Overall core was stronger than expected, but hard to be sure that’s meaningful.
- As I said up top, there’s no real reason to think that the Fed cares…so from a markets perspective, TODAY and this month, these numbers don’t mean much. Except for you, because the Fed isn’t going to try and restrain inflation so you better make sure you’re prepared.
Late post of today’s summary, since I had customer meetings during the day. Up above, I sort of flippantly commented about how the chart of monthly changes looks totally different when you add the latest point. I’m always fascinated about examples like this. Clearly, we didn’t add 12 monthly points, but only one today. So there is no more information in that chart than we had new today – what happens is that we change the context a little bit. Prior to today’s figure, the question was “are the three high numbers the aberration, or are the last two points an aberration from a higher trend?” The latest point makes it seem more likely that the two low ones are the aberration, but I’d be cautious about reading too much into that. First, there’s a ton of noise in any economic series. Second, I mentioned in my walk-up to the number in the bullet points above that there’s some chance the late Thanksgiving could result in a higher-than-expected CPI if retailers lowered their prices for the Christmas season later than normal. And third, there wasn’t anything super-alarming about this data.
By the same token, “nothing super-alarming” could also be read as “no big outliers, just a generally faster pace of inflation.” So if you’re bullish on inflation, you might read the composition that way. Moreover, it should be pointed out that while the consensus forecast was for +0.2% on core CPI, and we got +0.2%, there was actually a pretty decent miss: the consensus was more like +0.18% before rounding up, and core CPI was +0.23% before rounding down. Economists were further off than they appear to be if you just look at the rounded figures.
My view continues to be that inflation ought to peak early next year, but that the cyclical low won’t be that low. However, I am becoming a bit less confident that the peak is that near, especially given how Medical Care is behaving. The key point though is the last one I raised today. The Fed has changed the rules of the game…or I guess a better analogy is that it has changed which team it is playing for in a very vocal way. It is one thing for the Fed to say “we want inflation higher and are going to push it higher,” which implies a level of control (to be sure, it is control they don’t actually have), but something else entirely to say “we really don’t care if it goes up,” which implies abdication of responsibility for the results. Investors should beware of this. I don’t think it is the small thing it sounds like.
Summary of My Post-CPI Tweets (November 2019)
Below is a summary of my post-CPI tweets. You can (and should!) follow me @inflation_guy. Or, sign up for email updates to my occasional articles here. Investors with interests in this area be sure to stop by Enduring Investments or Enduring Intellectual Properties (updated sites coming soon). Plus…buy my book about money and inflation. The title of the book is What’s Wrong with Money? The Biggest Bubble of All; order from Amazon here.
- Another CPI day dawns bright and cold. But will inflation get heated up again, with a fourth 0.3% print on core, out of five? Or stay cold like last month’s +0.13% on core?
- Last month, core goods was pressured a little bit, although still +0.7% y/y, by softness in Used Car prices and a big drop in pharma prices.
- Apparel also fell as the new methodology is adding more volatility to that series than we had previously seen.
- I suspect we will see more softness from Used Cars (maybe not as much as last month), as sales surveys have been consistently soggy recently.
- I also continue to wait for the other shoe to drop with Medical Care. The Health Insurance part, which is a residual, has been running really hot. But that probably just signals that survey prices of the other parts need to catch up with reality. At least that’s my speculation.
- Although core CPI was soft last month, Median was +0.25% and a new cycle high of 2.97% y/y. So the underlying pressures are steady and that probably means we aren’t about to see a major turn lower yet.
- Really, the major change since last month has been the Fed’s tone – Powell saying that the Fed won’t even consider addressing higher inflation until they see “a really significant move up in inflation that’s persistent.”
- That changes the calculation for investors and we have seen a meaningful move higher in breakevens recently as a result.
- Consensus for today’s number is +0.3% headline, +0.2% on core, with the y/y core staying at 2.4%. And they’re really calling for an 0.2% or above, not a ‘soft’, rounded-up, core figure.
- We are rolling off 0.196% from last October, so to have the y/y rise we need another pan-0.2% print. And to keep y/y at 2.4% on core it can’t be much softer than that.
- That’s all for now. Except for this: after the figure I will be on @TDANetwork with @OJRenick. About 9:15ET is when we are scheduled to go to air. Tune in! And good luck today.
- Soft one, +0.16% on core that rounds up to +0.2%. The y/y core dripped from 2.36% to 2.32%, which caused the rounded figure to go 2.4% to 2.3%.
- So, what happened in June-July-August? Three months is a lot for an outlier.

- OK, wow, -3.84% m/m drop in Lodging Away from Home. Looks like a seasonal distortion as the prior month was +2.09%. LAfH is only 1% of consumption, but that means it’s ~4bps of the m/m figure.
- Used Cars and Trucks rebounded to 1.32% m/m, but the y/y dropped to 1.44% from 2.61%. It may have a little further to drop but that’s not surprising.
- Apparel -1.8% m/m, so again more volatility from the new methodology. Core goods y/y dropped from +0.7% to +0.3%, but some part of that was Apparel going from -0.3% y/y to -2.3% y/y.
- In the big pieces, Primary rents were +0.14%, a little soft (y/y to 3.74% from 3.83%) and Owner’s Equivalent +0.19%, also soft, to 3.32% from 3.40% y/y. Along with Lodging Away from Home it meant the Housing subindex, 42% of CPI, decelerated to 2.89% from 3.03%.
- That’s potentially big on a couple of fronts, if it indicates actual slowing in rent inflation. As a big piece of CPI, a modest slowing there will help turn Median too.
- Belated but here’s the chart on used cars and trucks. You can see the y/y is back in line, but some more softness likely.

- So, core inflation ex-housing actually rose to 1.60% from 1.55%. Pretty minor move but it hasn’t been higher since Feb 2016, with the exception of two months ago when it hit 1.70%.

- So the spread of shelter inflation over core, non-shelter inflation, has been extreme and one question has been whether housing inflation would slow or other inflation would rise. Answer this month is: both.

- Not to belabor Lodging Away from Home but here is the y/y. The monthly volatility is not helpful, but at least it’s only 0.9% of CPI.

- Weirdly, I haven’t mentioned Medical Care. M/M, Medicinal Drugs rose 1.05% after declining -0.79% last month. Y/y rose to +1% from -0.3%. Doctors’ Services rose to 1.16% y/y from +0.93%. But Hospital Services jumped to 3.46% from 2.08% y/y.
- Hospital Services is 2.2% of consumption, and that +1.38% m/m jump is the reason that Core Services rose to 3% y/y from 2.9% DESPITE the deceleration in housing.
- y/y hospital services. So is that part of what wasn’t being captured and thus showing up in the health insurance residual? Maybe, but Health Insurance still went to +20.1% y/y from 18.8%. Even knowing that’s a residual doesn’t keep it from being scary.

- It’s measuring a REAL COST INCREASE, it’s just not really in the price of insurance policies that Americans are paying. Yes, they’re rising, but not at 20% y/y.
- Insurance chart

- Early guess on Median is that it will be a softish +0.19%, which will keep y/y basically unch.
- Biggest annualized declines this month were Lodging Away from Home, Women/Girls’ Apparel, Infants’/Toddlers’ Apparel, and Men’s/Boys Apparel. Biggest increases: Car/Truck Rental, Motor Fuel, Misc Personal Goods, Energy Services, Used Cars/Trucks, Med Care Commodities.
- Those are biggest annualized MONTHLY declines, Sorry.
- About to get ready to air on @TDANetwork, so four-pieces charts might have to wait until later.
- Summary today is that as usual there are lots of moving pieces but the interesting bit is the big housing pieces. They’re slow but there’s some anecdotal signs of softness developing and if that’s real, it could cap core inflation for now. Not sure of that yet.
- I still think inflation is likely to peak for this cycle in early 2020, but again I admonish that the downside won’t be nearly as low as we have seen downsides and the next upside will be worse than this one. Higher highs and higher lows from here.
I still owe you the four-pieces charts, so here they are. First, Food & Energy.

Next, Core Goods. It suffered a big setback today but it still looks generally uptrending. I don’t think this is about to go to 4, but something between 0.5% and 1.0% for a while is not hard to imagine especially if pharma prices stabilize.

Core services, ex rent-of-shelter. Now, this starts to look a little more interesting? Medical Care showing some perkiness and as the second-most-stable piece here, core services less rent of shelter is worth monitoring for the longer-term macro inflation picture.

Finally, Rent of Shelter. Still in the same general vicinity, but there are starting to be some anecdotal reports of softness in home prices in certain areas so it’s worth monitoring. It’s not about to plunge as in 2007-09, but it just needs to back off a little to change how concerned we are about inflation.

That said, inflation seems to be broadening a bit and also becoming more volatile. The volatility is partly because the BLS is changing the way they do certain things but it’s also a consequence of fractious trade relationships where firms are changing their sourcing, prices are responding to tariffs and tariff threats, etc. To the average consumer who encodes price increases as inflation and price decreases as good shopping, volatility in prices feels very much like inflation so if this continues then inflation expectations could rise just on the volatility (unless it’s all measurement volatility, of course).
I do think that the investment implication of today’s inflation numbers is muted compared to the implication of what the Fed has said about the inflation numbers. To wit, the Fed won’t even consider hiking to restrain inflation unless they see “a really significant move up in inflation that’s persistent.” So far we haven’t seen that, and in fact recently the upper tails have been coming down just as the fast as the lower tails have been going up. The chart below shows what proportion of the CPI is inflating faster than 4% y/y.

But from an investor’s standpoint and more importantly from an advisor’s standpoint, the Fed stance changes how you approach a portfolio if you are a professional-risk-minimizer (as most advisors are). In the old days, an uptick in inflation that caught an advisor flat-footed might be forgiven because we assumed the Fed was working hard in our direction – to keep inflation low. But now, even if you don’t think inflation is going to rise, the professional risk on the downside is bigger because clients will say to the advisor “why didn’t we have any inflation hedges? The Fed told you they wanted expectations to go higher!” Maybe this is too subtle, but breakevens are up 20-25bps over the last few weeks and I think no small part of that is because investors and advisors are now on their own with respect to inflation. In my experience, people who think they might be shot at can usually be trusted to dig their own foxholes.
Summary of My Post-CPI Tweets (October 2019)
Below is a summary of my post-CPI tweets. You can (and should!) follow me @inflation_guy. Or, sign up for email updates to my occasional articles here. Investors with interests in this area be sure to stop by Enduring Investments or Enduring Intellectual Properties (updated sites coming soon). Plus…buy my book about money and inflation. The title of the book is What’s Wrong with Money? The Biggest Bubble of All; order from Amazon here.
- CPI day! Want to start today with a Happy Birthday to @btzucker , good friend and inflation trader extraordinaire at Barclays. And he does NOT look like he is 55.
- We are coming off not one not two but THREE surprisingly-high core CPI prints that each rounded up to 0.3%. The question today is, will we make it four?
- Last month, the big headliners were core goods, which jumped to 0.8% y/y – the highest in 6 years or so – and the fact that core ex-housing rose to 1.7%, also the highest in 6 years.
- Core goods may have some downward pressure from Used Cars this month, as recent surveys have shown some softness there and we have had two strong m/m prints in the CPI, but core goods also has upward tariffs pressure, and pharma recently has been recovering some.
- (The monetarist in me also wants to point out that we have M2 growth accelerating and near 6% y/y, and it’s also accelerating in Europe…but I also expect that declining interest rates are going to drag on money velocity. Neither of those is useful for forecasting 1 month tho)
- Now, one thing I am NOT paying much attention to is yesterday’s soggy PPI report. There’s just not a lot of information in the broad PPI, with respect to informing a CPI forecast. I mostly ignore PPI!
- The consensus forecast for today calls for a soft 0.2%. I don’t really object to that forecast. We are due for something other than 0.3%. But I would be surprised if we got something VERY soft. I think those 0.3%s are real.
- Unless we get less than 0.12%, though, we won’t see core CPI decline below 2.4% (rounded). And if we get 0.222% or above, we will see it round UP to 2.5%. That’s because we are dropping off one more softish number, from Sep 2018, in the y/y.
- Median, as a reminder, is 2.92%, the highest since late 2008. It’s going to take a lot to get back to a deflation scare, even if inflation markets are currently pricing a fairly rapid pivot lower in inflation. I don’t think they’re right. Good luck today.
- Obviously a pretty soft CPI figure. 0.13% on core, 2.36% y/y.

- This is not going to help the new 5yr TIPS when the auction is announced later. But let’s look at the breakdown. Core goods fell to 0.7% from 0.8%, and core services stable at 2.9%.
- As expected, CPI-Used Cars and Trucks was soft. -1.63% m/m in fact. That actually raises the y/y slightly though, to 2.61% from 2.08%. There’s more softness ahead.

- OER (+0.27%) and Primary rents (+0.35%) were both higher this month and the y/y increased to 3.40% and 3.83% respectively. So why was m/m so soft? Used cars is worth -0.05% or so, but we need more to offset the strong housing.
- (Lodging away from home also rebounded this month, +2.09% m/m vs -2.08% last month).
- Big drop in Pharma, which is surprising: -0.79% m/m, dropping y/y back to -0.31%. That’s still well off the lows of -1.64% a few months ago.
- Core ex-shelter dropped to 1.55% y/y from 1.70% y/y. That’s still higher than it has been for a couple of years.
- Apparel dropped -0.38% on the month. The new methodology is turning out to be more volatile than the old methodology, which is fine if apparel prices are really that volatile. I’m not sure they are. y/y for apparel back to -0.32%.
- Yeah, apparel is just reflecting the strong dollar, but I’m still surprised that we haven’t seen more trade-tension effect.

- So, Physicians’ services accelerated to 0.93% y/y from 0.71%. And Hospital Services roughly unchanged. Pharma as I said was down (in prescription, flat on non-prescription). Health Insurance still +18.8% y/y (was 18.6% last month).
- A reminder that “health insurance” is a residual, and you’re likely not seeing that kind of rise in your premiums. But I suspect it means that there are other uncaptured effects that should be allocated into different medical care buckets, or perhaps this leads those movements.
- So even with that pharma softness, overall Medical care (8.7% of the CPI) was exactly unchanged at 3.46% y/y.
- College Tuition and Fees decelerated to 2.44% from 2.51%. But that’s mostly seasonal adjustment – really, there’s only 1 College Tuition hike every year, and it just gets smeared over 12 months. Tuition is still outpacing core, but by less.
- Largest drops in core m/m were Women’s/Girls’ apparel(-18.7% annualized), Used Cars & Trucks(-17.9%), Infants’/Toddlers’ apparel(-13.4%), Misc Personal Goods(-12.1%), and Jewelry/Watches (-11.9%). Biggest gainers: Lodging away from home(+28.1%) & Men’s/Boys’ Apparel.(+25.5%)
- Here’s the thing. Median? It’s a little hard to tell because the median categories look like the regional housing indices, but I think it won’t be lower than +0.25% unless my seasonal is way off. And that will put y/y Median CPI at 3%.

- The big difference between the monthly median and core figures is because the core is an average, and this month that average has a lot of tail categories on the low side while the middle didn’t move much.
- That’s why, when you look at the core CPI this month, there’s nothing that really jumps out (other than used cars) as being impactful. You have moves by volatile components, but small ones like jewelry and watches or Personal Care Products.
- Here is OER, in housing, versus our forecast. There’s no real slowdown happening here yet, and that’s going to keep core elevated for a while unless non-housing just collapses. And there’s no sign of that – core ex-housing, as I noted, is still around 1.4%.

- So, this is a fun chart. In white is the median CPI, nearing the highs from the mid-90s, early 2000s, and late 2000s. Now compare to the 5y Treasury yield in purple. Last time Median was near this level, 5s were 3-4%.

- Another fun chart. Inflation swaps vs Median CPI. Not sure I’ve ever seen a wider spread. Boy are investors bearish on inflation.

- Here is the distribution of inflation rates, by low-level components. You can see the long tails to the downside that are keeping core lower than where “most” prices are going. So inflation swaps aren’t as wrong as median makes them look…if the tails persist. Not sure?

- So four pieces: food & energy, about 21% of CPI.

- Core goods, about 19%. Backed off some, but still an important story.

- Core services less rent of shelter. About 27% of CPI. And right now, meandering. Real question is whether rise in health care inflation is going to pass through eventually to other components or if it is transitory. If the former, there’s a big potential upside here.

- And rent of shelter, about 33% of CPI. As noted, this ought to decelerate some, but no real indication it’s about to collapse. And you can’t get MUCH lower inflation unless it rolls over fairly hard.

- Really, the summary today is that there isn’t anything that looks like a sea change here. Most prices continue to accelerate. Now, next month the comparison is harder as Oct 2018 core was +0.196%. Month after was +0.235%. So some harder comps coming for core.
- That said, I continue to think that we’ll see steady to higher inflation for the balance of this year with an interim peak coming probably Q1-Q2 of next year. But the ensuing trough won’t be much of a trough, and the next peak will be higher.
- That’s all for today. Thanks for tuning in.
I don’t think there is anything in this report that should change any minds. The Fed ought to be giving inflation more credit and be more hesitant to be cutting rates, but they are focused on the wrong indicator (core PCE) and, after all, don’t really want to be the guys spoiling the party. I think they’ll be slow, but we’re entering a recession (if we’re not already in one) and since the Federal Reserve utterly believes that growth causes inflation, they will tend to ignore a continued rise in inflation as being transitory. Since they said it was transitory when it dipped a couple of years ago – and it really was – they will be perceived as having some credibility…but back then, there really was some reason to think that the dip was transitory (the weird cell phone inflation glitch, among them), and there’s no real sign right now that this increase in inflation is transitory.
Yes, I think inflation will peak in the first half of 2020, but I’m not looking for a massive deceleration from there. Indeed, given how low core PCE is relative to better measures of inflation, it’s entirely possible that it barely declines while things like Median and Sticky decelerate some. Again, I’m not looking for inflation or, for that matter, anything that would validate the very low inflation expectations embedded in market prices. The inflation swaps market is pricing something like 1.5% core inflation for the next 8 years. Core inflation is currently almost a full percentage point higher, and unlikely to decline to that level any time soon! And breakevens are even lower, so that if you think core inflation is going to average at least 1.25% for the next 10 years, you should own inflation-linked bonds rather than nominal Treasuries. I know that everyone hates TIPS right now, and everyone will tell you you’re crazy because “inflation isn’t going to go up.” If they’re right, you don’t lose anything, or very little; if they’re wrong, you have the last laugh. And much better performance.
Summary of My Post-CPI Tweets (September 2019)
Below is a summary of my post-CPI tweets. You can (and should!) follow me @inflation_guy. Or, sign up for email updates to my occasional articles here. Investors with interests in this area be sure to stop by Enduring Investments or Enduring Intellectual Properties (updated sites coming soon). Plus…buy my book about money and inflation. The title of the book is What’s Wrong with Money? The Biggest Bubble of All; order from Amazon here.
- CPI day again! And this time, we are coming off not one but TWO surprisingly-high core CPI prints of 0.29% for June and July respectively.
- But before I get into today’s report, I just want to let you know that I will be on TD Ameritrade Network @TDANetwork with @OJRenick at 9:15ET today. Tune in!
- And I’m going to start the walk-up to the number with two charts that I don’t often use on CPI day. The first shows the Atlanta Fed Wage Tracker, and illustrates that far from dead, the Phillips Curve is working fine: low unemployment has produced rising wages.

- The second chart, though, is why we haven’t seen the rising wage pressure in consumer prices yet. It shows that corporate margins are enormous. Businesses can pay somewhat higher wages and accept somewhat lower (but still ample) margins and refrain from price increases.

- This won’t last forever, but it’s the reason we haven’t felt the tariffs bite yet, too. Something to keep in mind.
- As for today: last month we saw core goods inflation at +0.4% y/y, the highest since 2013. I suspect that trend will continue for a bit longer, because tariffs DO matter. It’s just that they take longer to wash through to consumer prices than we think.
- In general, last month’s rise was mostly surprising because it was fairly broad-based. Nothing really weird, although the sustainability of retracements in apparel/hospital services/lodging away from home may be questioned.
- In fact, the oddest thing about last month’s figure is that “Other Goods and Services” jumped 0.52% m/m. OGaS is a jumble of stuff so it’s unusual to see it rising at that kind of rate. It’s only 3% of CPI, though.
- Consensus today is for a somewhat soft 0.2% on core. We drop off 0.08% from last August from the y/y numbers so the y/y will almost surely jump to at least 2.3% (unless there’s something weird in August seasonals). Good luck.
- Oh my.
- Well, it’s a soft 0.3% on core, at 0.26% m/m, but that’s the third 0.3% print in a row. The fact that none of them was actually as high as 0.3% is not terribly soothing.
- y/y core goes to 2.4% (actually 2.39%), rather than the 2.3% expected. Again, oh my.
- Last 12 core CPIs.

- Subcomponents trickling in but y/y core goods up to +0.8% y/y. Maybe those tariffs are having an impact. But this seems too large to be JUST tariffs.

- Core services also rose, to 2.9% y/y. But that’s less alarming.

- A big piece of the core goods jump was in Used Cars and Trucks, +1.05% m/m and up to +2.08% y/y.
- The used cars figure isn’t out of line, though.

- Primary Rents at +0.23% (3.74% y/y from 3.84%) and OER at +0.22% (3.34% vs 3.37%) are actually slightly dampening influences from what they had been. The contribution from their y/y dropped and the overall y/y still went up more than expected.
- Between them, OER and Primary Rents are about 1/3 of CPI, so to have them decelerate and still see core rise…
- Lodging Away from Home -2.08% m/m…lightweight, but certainly not a cause of the upside surprise. But Pharmaceuticals rose 0.61% m/m, pushing y/y back to flat (chart).

- …and hospital services jumped 1.35% m/m to 2.13% y/y. So the Medical Care subindex rose 0.74% m/m, to 3.46% y/y from 2.57%. Boom.

- Biggest m/m jumps are Miscellaneous Personal Goods, Public Transportation, Footwear, Used Cars & Trucks, and Medical Care Svcs. Only the last two have much weight and we have already mentioned them.
- It is going to be VERY close as to whether Median CPI rounds up to 3.0% y/y. I have it at 0.23% m/m (right in line with core) and 2.94% y/y.

- It’s time to wonder whether this rise in inflation is “actually happening this time.” Core ex-shelter rose from 1.3% y/y to 1.7% y/y. That’s the highest since Feb 2013. To be fair, it wasn’t “actually happening that time.”

- To be honest, I’m having trouble finding disturbing outliers. And that’s what’s disturbing.
- Quick four pieces charts. Food & Energy

- Core goods. This is the scary part.

- But Core Services is also showing some buoyancy. Again, look at the core-ex-shelter chart I tweeted just a bit ago.

- Lastly, Rent of Shelter. Still not doing anything…

- Got to go to ‘makeup’ for the @TDANetwork hit (I don’t really get makeup), but last thought. Fed is expected to ease next week. I think they still will. But this sets up a REALLY INTERESTING debate at the FOMC.
- Growth is fading, and worse globally, but it’s still okay in the US. And inflation…it’s hard to not get concerned at least a little…so there’s a chance they DON’T ease. A small chance, but not negligible.
- That’s all for today! It was worth it!
My comment that the Fed might not ease got more heated reaction than I have seen in a while. Clearly, there are a lot of people who are basing their investment thesis on the Fed providing easy money. I suppose it is impolitic to point out that that is exactly one great reason the Fed should not ease, even though the market is pricing it in.
But let’s look at the Fed’s pickle (er, not sure I like that imagery but we’ll go with it). The last ease from the FOMC was positioned as a ‘risk management’ sort of ease, with the Fed wanting to get the first shot in against slowing growth. I am completely in agreement that growth is slowing, but there are plenty of people who don’t agree with that. Globally, growth looks plainly headed into (or is already in) recession territory, but US protectionism has preserved US growth relative to the rest of the world. Yes, that comes at a cost in inflation to the US consumer, but so far we’ve gotten the protection without the side effects. That might be changing.
If the Fed believes that the inflation bump is because of tariffs, and they believe that lower rates will stimulate growth (I don’t, but that’s a story for another day), then the right thing to do is to ignore the rise in prices and ease anyway. If they do ease, I suspect they will include some language about the current increase in prices being partly attributable to higher import costs due to tariffs, and so temporary. But I don’t think there’s a ton of evidence that the rise in core inflation is necessarily tied exclusively to tariffs. So let’s suppose that the Fed believes that tariffs are not causing the current rise in median inflation to about 3% and core inflation the highest since the crisis. Then, if in fact the last ease really was for risk management reasons, then what’s the argument to ease further? Risks have receded, growth looks if anything slightly better than it did at the last meeting, and inflation is higher and in something that looks disturbingly like an uptrend. And, there is the question about whether reminding the world that they are independent from the Administration is worth doing. I really don’t think this ease is a slam-dunk. The arguments in favor were always fairly weak, and the arguments against are getting stronger. Maybe they don’t want to surprise the market, but if you can’t surprise the market with both bonds and stocks near all-time highs then when can you surprise the market? And if the answer is “never,” then why even have a Federal Reserve? Just leave it to the market in the first place!
And I’d be okay with that.
Summary of My Post-CPI Tweets (August 2019)
Below is a summary of my post-CPI tweets. You can (and should!) follow me @inflation_guy. Or, sign up for email updates to my occasional articles here. Investors with interests in this area be sure to stop by Enduring Investments or Enduring Intellectual Properties (updated sites coming soon). Plus…buy my book about money and inflation. The title of the book is What’s Wrong with Money? The Biggest Bubble of All; order from Amazon here.
- Welcome to another CPI day. The tone going into this one is soooo much different than last month. We are coming off of a surprising jump in core CPI of 0.29%, rather than three straight weak numbers, for starters.
- For another, the Fed is already in easing mode; last month we were just preparing for it. Despite the high inflation print, and median CPI near its highs y/y (2.84%), the Fed eased anyway.
- (If you needed any more evidence that the Fed cares more about the stock market and “risk management” of forward growth expectations, than about inflation, that was an exhibit for you.)
- With global growth sliding, protests in Hong Kong, the Argentinian peso collapsing…this CPI number today won’t change the Fed’s trajectory. They’re going to keep easing for a while.
- I expect inflation to peak later in Q4 or in Q1, but in the meantime it may make the Fed feel a bit uncomfortable. List 4 tariffs being implemented will probably finally result in a tariff effect (not for a few months, as they take effect Sep 1).
- As for today: last month’s jump was fueled by housing, and by used (not new, not leased) cars and trucks. Most of that was catch-up although housing’s strength is a little surprising.
- I don’t expect retracements there. And there’s upside risk from medical care, especially hospital services, though it’s hard to time.
- Recent increases in the CPI for health insurance, which is a residual, may indicate coming acceleration in inflation for drugs and/or hospital services, which are due. Hard to time this though.
- Consensus on the Street is for roughly 0.19% on core CPI. That would keep y/y steady, right at 2.1%. Good luck.
- Well whoopsie. Another 0.29% on core CPI. That brings y/y core to 2.21%
- This makes the lull earlier this year look decidedly different.

- Let’s see. Lodging Away from Home jumps out, retracing a -0.64% fall last month to +0.94% this month, but that’s only 1% of CPI.
- Primary Rents and OER both were better behaved this month, +0.28% and +0.25%, but that actually lowers the y/y for both of them.
- Heh heh…did someone say hospital services? It rose 0.46% m/m, pushing the y/y to 0.77% from 0.50%. No real victory lap for me yet…it’s got a long way to go.

- Pharma was also positive, +0.29% m/m versus -0.46% m/m last. Overall, Medical Care rose to 2.57% y/y versus 1.96% last month. Medical Care is about 9% of CPI.
- Used cars and trucks accelerated to 1.47% y/y versus 1.25%. So no retracement to the bounce last month. I hadn’t expected any since the move last month looked like a return to fair.
- Apparel +0.44% m/m. That takes the y/y to -0.55% versus -1.29% last month. Couple of months ago there was a sharp fall as BLS shifted to a new methodology. Looks like this is catching up. Still mild deflation in apparel, no tariff effects.
- Overall, Core Goods was +0.40% y/y. Wait, what?? About time! HIGHEST Y/Y CORE GOODS SINCE 2013. The persistent-deflation-in-goods narrative just took a hickey.

- However, hold the victory lap on that. Model says we may be close to the highs on core goods. (But the model doesn’t know about tariffs.)

- This is rare…Other Goods and Services, the eighth of eight major subgroups in CPI, rose 0.52% m/m. That category (only 3% of CPI) is a dog’s breakfast so unusual to see a m/m jump that large. Will be worth looking into.
- Core inflation ex-shelter rose to 1.31% y/y from 1.16% last month.
- New Vehicles and Leased Cars and Trucks both decelerated further. So if anyone ‘blames’ used cars for the strong print, point out that overall “New and used motor vehicles” decelerated to 0.30% y/y from 0.43%. This kind of talk will make you popular at parties.
- CPI for health insurance continued to surge, now up 15.88% y/y. Remember, this is a residual, but I think that means it may signal changes that the BLS hasn’t picked up yet. It’s the highest on record.

- Back to that dog’s breakfast of “Other”. Nothing really stands out. This category has cigarettes, personal care products (cosmetics, etc), personal care services (haircuts, e.g.), funeral expenses, legal services, financial services, dry cleaning…pretty balanced increases.
- Biggest declines this month are jewelry and watches (-17% annualized) and infants’ and toddlers’ apparel (-12.8% annualized). Bunch of annualized >10% gains tho: Mens’ & boys’ and womens’ & girls’ apparel, public transportation, lodging away from home, tobacco, motor fuel.
- Early look at median CPI…my estimate is 0.28% m/m, which would put y/y to 2.88% and a new high.
- OK, time for the four-pieces charts. And then a wrap-up. First, Food & Energy.

- Second piece: Core goods. This is really where the story is, and where it’s likely to be going forward. A reminder here about how long the inflation process can take! Folks were looking for tariff effects the moment they went into effect. But businesses wait-and-see first.

- Now businesses have seen, and the tariffs look to be pretty sturdy, and they’re moving prices. And more to come probably.
- Core services less rent of shelter. Medical Care maybe has stopped going down, but it isn’t going up yet.

- And the stable Rent of Shelter. A little surprised it’s so buoyant still.

- Well, the wrap-up is obvious here. Second 0.3% core month in a row, and no obvious outliers. The acceleration seems to be concentrated in core goods, but fairly broad. I still think we will see inflation peak later 2019 or early 2020, but…there are no signs of it yet.
- So this is what the Fed faces: slowing global growth, political unrest, and rising inflation. In that circumstance, will they keep easing? OF COURSE THEY WILL, THEY DON’T CARE ABOUT INFLATION. Haven’t for a decade at least.
- And what about markets? 10-year inflation swaps are shown below, compared to Median CPI (last point estimated). There’s a serious disconnect here.

- So as Porky says, “That’s all, folks!” Thanks for tuning in. I’ll put the summary of these tweets up on my site mikeashton.wordpress.com within the hour.
What is amazing about inflation is both how slowly it changes and also how quickly it changes. Three months ago we were looking at four soft months in a row on core CPI and people were starting to chirp about the coming deflation. Then we get two of the highest core prints in a long time – and broad-based at that – and the story will be 180 degrees different. (Another reason to watch Median CPI rather than Core CPI is that the head fakes aren’t very good in Median – there was never much question that the broad trend was staying higher).
To be sure, the Fed doesn’t really care about inflation, and markets don’t much care either. Unless, that is, it causes the Administration to slow its march toward tariffs. As I write this, the Trump Administration has announced they will delay the tariffs on “some” products – including cell phones, laptops, video game consoles, some toys, and some apparel – until December 15th (just in time for Christmas, but it means that these goods won’t see prices higher during the holiday shopping season since everything on store shelves will have already been imported. Thanks Wal-Mart!). Stocks have taken that as a signal to rip higher because the fact that inflation is rising on 98% of the consumption basket is so one-hour-ago. Happy days are here again!
But make no mistake. The inflation pressures are not all from tariffs. In fact, few of them seem to be specifically traceable to tariffs. This is a continuation of a broad accelerating trend we have seen for several years. See above: inflation changes slowly. The Federal Reserve will ignore this because they believe the slower global growth will restrain inflation so that there is nothing they need to do about it. In some sense they are right, because the market has already lowered interest rates by so much it is likely to push money velocity lower again. I still think inflation will peak later this year or early next year, but if I were on the FOMC…I’d be somewhat nervous about that projection today.
Summary of My Post-CPI Tweets (July 2019)
Below is a summary of my post-CPI tweets. You can (and should!) follow me @inflation_guy. Or, sign up for email updates to my occasional articles here. Investors with interests in this area be sure to stop by Enduring Investments or Enduring Intellectual Properties. Plus…buy my book about money and inflation. The title of the book is What’s Wrong with Money? The Biggest Bubble of All; order from Amazon here.
- Big, big CPI day today. After four straight 0.1s (rounded down to that, in each case) on core CPI, the importance here is hard to overstate.
- With the Fed gearing up to ease, partly because of low inflation, these prints all matter more.
- (…although the Fed minutes suggested the Fed is taking a “risk management” approach, which makes the hurdle for NOT easing a lot higher since they can always say they’re addressing future risks, not current data.)
- The problem is that better measures of inflation, like Median or Trimmed Mean, are not really showing the same slowdown as core. That is, these are still one-offs, or “transitory” in Fed-speak.
- But that’s one way that inflation involves – as one-offs that become more frequent until those one-offs are the median. Still, while I expect inflation to peak later this year I don’t think that’s happening yet.
- There is an underlying mystery in all of this and that is: where is the tariff effect?! The markets have moved on from worrying about it because it hasn’t shown up yet.
- But the short-term bump from the actual tariffs was never the real threat with de-globalization. The important effects are long-term, not short term. Still, it makes investors more confident that China tariffs don’t really matter much.
- OK, just a few minutes until the number. After the number and my reactions to it, tune in to @TDANetwork where I will be talking with @OJRenick at about 9:15ET. The consensus is for 0.2% on core CPI, keeping y/y at 2.0%. Good luck out there.
- Well, that’s more like it. Core CPI +0.29%, pushing y/y from 2.00 to 2.13%.
- Breakdown in a moment but first thing it’s really important to remember: this does not mean the Fed won’t ease this month. Almost surely, they still will. Remember, this is “risk management” to them. They’ve set it up to ease anyway.
- Last 12 core CPI.

- OK, big m/m jump in Primary Rents and Owners’ Equivalent are the obvious culprits. Rents went to 3.87% y/y from 3.73% y/y on a +0.424% m/m jump. OER rose from 3.34% y/y to 3.41% y/y.
- Used Cars and Trucks also finally caught up a bit…they’d been way below where private surveys had them, but this month +1.59% m/m, vs -1.37% last month. y/y goes from +0.28% to 1.25%.
- Apparel +1.13% m/m. Y/y it’s still in deflation at -1.3%, but last month that was -3.1%. Tariff effect or just the new method adjustment starting to smooth out? I expect the new method will show more volatility, FWIW.
- You can see the main trend in apparel hasn’t really changed; this month’s bump just moves it back towards the prior flat-to-slightly-down trend.

- CPI-Used cars and trucks vs Blackbook. Had been a bit below, now spot on.

- Core ex-shelter rises to 1.16% from 1.04%. That’s still well below the highs from late last year but underscores that this is not JUST housing (although…housing is a big part of it).
- This is interesting. Hospital Services (part of Medical Care) continues to plunge. -0.1% m/m and down to +0.50% y/y.

- also medicinal drugs continues to decline. And Doctor’s services was stable. But Medical Care as a whole drooped to 1.96% from 2.08% y/y. Those are the three big pieces, but…
- …Medical Care CPI didn’t decline further because Dental Services (0.79% weight, about half of doctors’ services) had a big jump, y/y to 1.94% from 1.15%. Get those teeth taken care of, people.
- College tuition and fees ebbed to 3.45% from 3.81% y/y.
- Back to Transportation…while Used Cars jumped (mostly just getting back to trend), New vehicles continued to droop. 0.58% y/y from 0.90% y/y. And leased cars got cheaper.
- My early estimate of Median CPI is +0.27%, bringing y/y back up slightly to 2.81%. Note the monthly series is much more stable than core, which is one reason to like Median.

- The largest negative changes this month were in Motor Fuel, Fuel Oil, Miscellaneous Personal Goods, Infants’ and Toddlers’ Apparel, and Public Transportation. All -10% or more on an annualized basis, but mostly small too.
- Largest increases were Jewelry and Watches, Car and Truck Rental (both of those over 60% annualized), Footwear, Used Cars and Trucks, and Men’s and Boys’ Apparel.
- I think that’s enough for today as I have to go get on air for @TDANetwork in 15 minutes. Tune in! Bottom line here is: keep focusing on Median, inflation isn’t headed down YET, but…Fed is still going to ease this month.
- Totally forgot to do the four-pieces charts. Will have to skip this month.
- OK, the four-pieces charts – I’ll have them in my tweet summary so might as well post them here. As a reminder these are four pieces that add up to CPI, each 1/5 to 1/3 of the total.
- First up, Food and Energy.

- Core goods. Now, this is interesting because it shows the reversal of some of the ‘transitory’ effects. Our model has this going to 1%, but recent outturns had been discouraging. Now back on track.

- Core services, though, continues to be drippy. A lot of the sogginess is medical care. I wonder what happens if the Administration wins and Obamacare is repealed? Short term, probably higher, but in the long-term less government involvement is also less inflationary.

- Finally, rent of shelter. Running a bit hotter than I expected it to be, and due to start fading a little. But no sign of a sharp deceleration in core while this is stable.

(I had to end this earlier this month because of the TD Ameritrade Network appearance, but went back and added the four-pieces charts later.)
The bottom line here is that nothing has changed in terms of what we should expect from central banks. They’re willing to let inflation run hot anyway because they thing low inflation was the problem. So they will ease this month, and probably will continue to ease as growth wanes. They will feel like they are ahead of the curve, and when inflation ebbs as I expect it to, they will say “see? We were right and we were even pre-emptive!”
Indeed, this is really the biggest risk in the longer-term. The Fed is going to be “right” but for all the wrong reasons. Inflation is not going to be declining because growth is slowing; these are merely coincident at the moment. Lower interest rates causing lower money velocity (since the opportunity cost of holding cash is going to go back towards zero) is the cause of the coming ebb in inflation which, by the way, won’t be as severe as in the last recession. But the risk is that the Fed becomes more confident in their models because they “worked,” and rely on them later.
Here’s an analogy. I just tossed a coin and the Fed went off, and ran complicated models factoring in gravity, wind resistance, the magnetism of the metals in the coin, biometric analyses about the strength of my thumb, and they concluded and called “heads.” It turned out to be heads, and the Fed is very happy about how well their models worked. Now, I know that it was “heads” because I tossed a two-headed coin.
So later, when I toss the coin again, the Fed runs the same model and calls “tails.” But this time, they are much more confident in their call, because of the model’s past success. Of course, since they didn’t actually get the right answer for the right reason the first time, there’s no more chance of being right than there was before…they’re just going to rely on it much more. And that’s the risk here. When the next inflation upturn happens, which I think will happen in the next cycle, the Fed will be very confident that their ‘expectations-augmented Phillips curve’ and Keynesian models will work…and they’ll be very, very late when inflation goes up.
But a really important point is: that’s not today’s trade. I doubt it’s even this year’s trade, although if I’m wrong and the peak isn’t happening yet it may be. The market realities remain:
- The Fed is going to ease this month, almost certainly 25bps.
- The Fed and other central banks are likely to keep easing preemptively, and then keep easing when the recession begins, and keep policy rates too low once the next expansion starts (although market rates will signal when that’s happening).
- Equities are too high for this growth regime; TIPS are way, way too cheap for any reasonably likely inflation regime…at least, relative to nominal bonds. But equities will probably take a while to figure that out.
Summary of My Post-CPI Tweets (June 2019)
Below is a summary of my post-CPI tweets. You can (and should!) follow me @inflation_guy. Or, sign up for email updates to my occasional articles here. Investors with interests in this area be sure to stop by Enduring Investments or Enduring Intellectual Properties. Plus…buy my book about money and inflation. The title of the book is What’s Wrong with Money? The Biggest Bubble of All; order from Amazon here.
- OK, CPI day at last. We get to find out if Powell meant “transitory” in the one-month sense (probably not) or in the 3-6 month sense (more likely).
- After all we have had three weak core CPI figures in a row: 0.110% for Feb, 0.148% in March, 0.138% in April. Three 0.1%s, rounded.
- Last month the culprit was used cars, -1.3% m/m, and Apparel at -0.8% m/m, the latter due to a methodology change. These are both short-term transitory, probably.
- Meanwhile, the evidence that core is being infected these last three months by tail events is in the median CPI, which was +0.26%, +0.27%, and +0.20% the last 3 months.
- Housing, on the other hand, remains strong, and this should continue for a bit; Medical Care remains weak with pharma especially (+0.1% y/y)…and I think that is “longer-term transitory” that should start to retrace higher.
- I am expecting a return to normalcy, not so much a rebound, in autos and apparel. But that should be enough to hit the consensus figures of 0.21% on core, 2.09% y/y.
- Longer-term, the fact that interest rates have fallen so far suggests that the small rebound we have seen over the last year and a half in money velocity may have trouble extending.
- So I think Median probably peaks late this year or early next, though I don’t expect it to fall off a cliff, either, in this recession.
- Grabbing coffee. Back in 11 minutes.
- So maybe a liiiiiittle more transitory than we thought! Core +0.11% m/m, +2.00% y/y.
- Last 12 months. The comp is easier next month, but none of the last 4 months would have exceeded it anyway!

- Apparel basically flat m/m, which is approximately what I expected…-3.06% y/y though, which includes the methodology change.
- CPI-Used Cars and Trucks was again down sharply m/m. -1.38%. That’s unlikely. Pushes y/y to +0.28%, Black Book has it about 1% above that.
- Housing: OER +0.26% m/m, Primary Rents +0.24%. Actually those aren’t far from the trends (y/y in each case declined a couple of hundredths, to 3.34% and 3.73% respectively), but last month had been chippier.
- Medical Care (and then I’m going to take a few minutes and dig deeper on some of these)…Medicinal Drugs (pharma) went into deflation. -0.11% m/m, -0.82% y/y. Chart in a moment. Doctor’s Services roughly unch, but only 0.30% y/y. Hospital Services bounced a bit, 1.30% y/y.
- Even with the bounce, Hospital Services is lower than two months ago, 3 months ago, etc. One year ago it was 4.70% y/y. Hospital Services is the largest component of the Medical Care subindex.
- Here is the y/y chart for drugs. Now, it’s very hard to measure this because there is tremendous dispersion in consumer costs for prescription drugs…massive differences based on which outlet, formulary, insurance, etc you have. Doing a lot of work on this. Sooo…

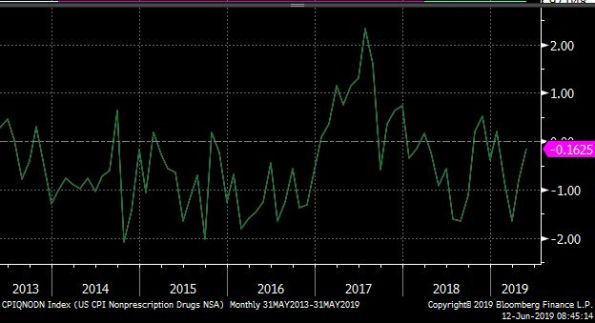
- this is the y/y picture for NONprescription drugs, which are much easier to measure. Basically no chg. So either prescriptn drug mkt is getting much more competitive (I doubt it), there is some change in collection method (possible), or a shift showing up as change.
- there is no lower-level index for drugs so we can’t really dig any deeper on that unfortunately. But it’s significant, not only for the CPI of course but for consumers generally (and the budget deficit) if health care costs really ARE slowing in a permanent way.
- CPI – College Tuition and Fees, essentially unch at 3.81% vs 3.86% y/y. But well off the lows.

- Now what does that last picture look like…oh, yeah, the S&P Target Tuition Inflation Index (my baby).

- Core inflation ex-housing down to 1.04%, the lowest level since February 2018. Still nowhere near the lows, nowhere near deflation, and with lots of transitory stuff in it.

- Core goods prices still in deflation, -0.2%. But lagged effect of the dollar’s 2017 selloff should just now be starting to wash into the core goods data. And we still haven’t seen the tariff effect yet. So this is still to come and the reason I don’t think we’ve peaked yet.

- WEIRD: Biggest declines on the month were used cars & trucks (-15.3% annualized), Leased cars & trucks (-13.8%). Biggest gainers: Car and Truck Rental (+26.5%), Public Transportation (+24.8%).
- Early estimate for Median CPI is +0.21% m/m, making y/y 2.81%. So, again, it’s a tails story.
- Sorry, didn’t calculate the sheet for y/y. Should be 2.76% y/y for median, down from 2.80%.
- Here is m/m Median CPI. Notice there’s really no major slowdown here. It’s been pretty steady and rising slightly y/y for a while. Nothing below 0.2% m/m since last August.

- OK, four pieces and then we’ll sum up. Piece 1 is food and energy.

- Piece 2 is core goods. As I said, I expect this to turn back higher. This is where you find Used Cars and Apparel…so transitory stuff is big here. This is also where tariffs fall heaviest.

- Piece 3 is Core Services less Rent of Shelter. Same story here: “What is up with medical care?” It may be that since consumers under the ACA end up paying out of pocket for a much larger share, they’re bargaining harder. That could be why it feels so much worse than this.

- Finally, rent of shelter – same old same old. No deflation while this remains steady as a rock.

- So, in sum. I do think that Powell is right in focusing on the “transitory” inflation slowdown. Better measures, such as Median (see below for Median vs core), show no significant slowdown yet.

- …and it’s hard to see where a slowdown would come from. Medical Care is already very slow. Core goods is already very slow, with negative tails already in the data but not much sign yet of the tariff effect sure to come. Housing is solid.
- So for now, I expect median inflation to continue to crawl higher. As we get later in the year, though, unless interest rates rebound a lot higher there’s a decent chance that money velocity droops again.
- Now, money velocity is already REALLY low so it may not. This chart isn’t our best model but it suggests velocity is already too low for the level of int rates (I’m not sure it’s a linear function near zero though). It was responding, but lower int rates may truncate a bounce.

- OK that’s all for today folks. Visit us at http://www.enduringinvestments.com if you want to have a more private chat. Thanks for tuning in!
Nothing more really to add – I will say that although Powell is right and these are transitory factors, I have lost faith that the Chairman is a “different sort” of Fed Chair since he doesn’t have an academic background. He was at first, but appears to have been captured by the econocognoscenti. Ergo, I expect the Fed will ignore the fact that inflation is still drifting higher, and start to cut rates as the growth figures make it ever clearer that the economy is heading towards (if not already in) recession. Long-end yields are already 110bps or more off the highs, so I think the bond market already has more than half its recession-rally finished (I don’t think we’ll have new low yields this cycle since I don’t think inflation will collapse and I don’t think the recession will be as bad). But stocks haven’t even begun their earnings-recession selloff, so…
Summary of My Post-CPI Tweets (May 2019)
Below is a summary of my post-CPI tweets. You can (and should!) follow me @inflation_guy. Or, sign up for email updates to my occasional articles here. Investors with interests in this area be sure to stop by Enduring Investments or Enduring Intellectual Properties. Plus…buy my book about money and inflation. The title of the book is What’s Wrong with Money? The Biggest Bubble of All; order from Amazon here.
- Happy(?) tariff day! With new tariffs imposed overnight, important to remember that the IMPORTANT effect on prices is not the near-term bump (which is small), but the fact that the disinflation of last 25y was possible because of trade liberalization.
- Also of course happy CPI day. We get the number in a few minutes. Here are a few pre-thoughts.
- Last month, core CPI was +0.148% m/m and 2.042% y/y, which both rounded down and looked like big misses.
- They weren’t really big misses, and at least some of that was due to a plunge in Apparel prices that was probably methodology-related (at least, that’s what the econs had anticipated so let’s take as an initial guess that they were right).
- Rents, the biggest and most important (and slow-moving) piece, were firm – firmer than I’ve been expecting in fact.
- But used cars was weak, along with Doctor’s services…along with Apparel, in general there was a lot of “left-tail stuff.”
- The left-tail nature of last month’s figure was illustrated by the fact that MEDIAN, the measure I focus on, was +0.27% to 2.85% y/y…another post-crisis high.
- Today, the consensus is for 0.2%/2.1% on core inflation. We would have to get something below 0.12% m/m to keep core from bumping to 2.1%, and any kind of firm number (>0.21%) could pop us back to a rounded 2.2%.
- That’s because last April was pretty weak. In fact four of the next 5 months were under 0.2% a year ago, so the comps will be easier for core.
- Core CPI +0.14%, slightly weaker than expected but rounding down to 0.1% again. Y/Y was 2.07%, so it did round up.
- Soft-looking but as noted earlier, base effects made it hard to maintain a 2.0% on core.
- Last 12 m/m core cpis.

- OK, the number is stronger than it looks. Used Cars very weak, -1.31% m/m which is crazy. Doesn’t look anything like the private surveys. Apparel -0.76% m/m again, -2.9% y/y. That’s not an accurate depiction of what’s happening.
- Because mainly of those two pieces, core goods went to -0.2% from flat. With tariffs rising, that doesn’t pass the sniff test. Core services, though, rose to 2.8% y/y. Primary rents were +0.45% m/m, 3.76% y/y, and OER +0.33%.
- Rent of primary residence. This is surprising, but important.

- Here is OER. With the Shiller index softening, many had expected rents to follow. But chippy wages are helping to keep a bid here, for now at least.

- There’s a real problem using home price indicators to forecast rents, because your model for that was built over a qtr-century in which wages & inflation were low and stable. If wages rise, then maybe home prices will lag rents – but we don’t know because we haven’t seen it.
- OK on to other things. Medical Care rose to 1.92% y/y vs 1.72% last mo. Every month it’s something different m/m tho. It was Pharma. Then Doctors’ Services last month. This month Dr Svcs bounced a little but Hospital Svcs -0.46% m/m. And Hosp Svcs is lgst part of Med Care.
- Core ex-housing was unchanged at 1.1% y/y. That’s actually surprising considering the drag from apparel and used cars.
- I may have been wrong on Used Cars being very surprising though. Guess there must be some uncaptured seasonal issue because y/y actually rose (meaning last April was also awful). And this is right on model. So I retract my concern about Used Cars.

- Biggest category drops on the month: Men’s and Boy’s Apparel (again), Footwear, Processed Fruits and Veggies, and Used Cars and Trucks. Biggest rises: Motor Fuel, Lodging Away from Home, Jewelry and Watches, and Medical Care Commodities (pharma)
- I skipped ahead to look at my guess for Median. It’s going to be a solid 0.2%, although that will cause the y/y to drop to “only” 2.80%. At least, that’s my estimate…won’t be reported for hours.
- College Tuition and Fees at 3.86% y/y compared with 3.84% y/y.
- Health Insurance doing its health insurance thing again.

- I mean, on housing it’s not ALARMING how fast it’s growing. It isn’t way above our model or anything. It just looks bad compared to what people were expecting given the S&P Corelogic Case/Shiller index.

- In green is the case/shiller y/y. So you can see people why were expecting a slowdown in rents. But you can also see that…it’s not a very good fit.

- That’s not quite fair b/c there’s no lag incorporated…home prices lead rents by ~21 months, so really we shouldn’t even see that impact for a while. Here it is lagged. Still not a good fit though and at times (2011, 2014) the direction of shiller didn’t match even lagged.

- Just a quick market comment…here’s the median CPI vs 10y inflation swaps. It’s going to be very hard to get much more bearish on long-term inflation swaps unless we see SOME signs that inflation is ebbing. So far, no signs at all.

- Four pieces. First Food & energy:

- Next, core goods. Our model has this headed higher, although not huge – maybe 0.5% or 1.0%. Recent deceleration is unsustainable especially in a fractious-trade world.

- Core Services less Rent of Shelter. No real change this month. If this is going to go up, it is going to be because medical care rises. To this end, it’s interesting that the previous spikes in Health Care Insurance (shown earlier) preceded spikes in other Medical Care.

- I wonder if the fact that Insurance is a residual means that when it is spiking, it means we’re just capturing prices in the wrong place until the survey catches up. Worth investigation.
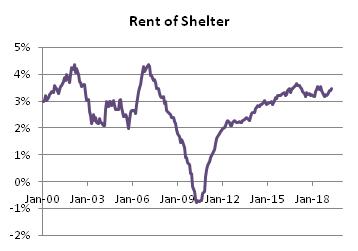
- Finally, Rent of Shelter. Clearly no disinflation here, yet.
- I think that’s good for today. Don’t forget to stop by my blog (http://mikeashton.wordpress.com ), though I must admit I’ve been slack recently in writing – but that’s because business is very exciting right now. A little tariff, a little MMT talk, and the phone rings.
The upshot of all of this is that core CPI continues to give a bad read on where inflation has been. Core tells us that inflation is ebbing. But the median category in fact has been steadily rising for several years. That doesn’t mean the inflation dynamic won’t roll over, but merely that so far it has not. The Fed’s concern that inflation isn’t getting to its target is misplaced, although ironically if they are able to restrain interest rates then the velocity dynamic means inflation is probably not far from peaking. But I don’t think we know that yet.