Archive
Summary of My Post-CPI Tweets (Nov 2023)
Below is a summary of my post-CPI tweets. You can follow me on X at @inflation_guy. Sign up for email updates to my occasional articles here. Individual and institutional investors, issuers and risk managers with interests in this area be sure to stop by Enduring Investments! Check out the Inflation Guy podcast!
- Welcome to the #CPI #inflation walkup for December (November’s figure). This is the last month I’ll be doing this live!
- Thanks to all of you who have subscribed, voting with your dollars that this was useful. I’ve suspended all renewals so you will no longer be charged after today. I’m deeply grateful that you participated in this experiment. Thank you!!
- As in the past, if you miss the live tweets, you can find a summary later at https://inflationguy.blog and I will podcast a summary at inflationguy.podbean.com . Those will continue in 2024 after the live tweeting stops.
- For this month, I’m on top of the consensus economists’ forecasts for core, but higher for headline. I left Cleveland Fed out because it’s routinely the worst.

- Here’s a rough sketch of where I get my core. Average of the last 3 core numbers is 0.28%; average of the last 6 is 0.26% but that includes a couple of outliers. Average of the last 6 median CPIs is 0.34%. Roughly, overall trend core is about 0.28%.
- But we have to add 1bp for Health Insurance; and I’m writing in -1% m/m for Used Cars which is a 3bp drag. That’s an abbreviated version of how I get 0.26%, but it’s pretty close.
- A quick word on Used Cars, which I have as a drag but some of the big shops have as a +. Black Book fell about 3.7%, seasonally adjusted, last month. The seasonals are an add back, but the add back is much less than the decline. I might be wrong on this, but I don’t see the add.
- That said, there were several months recently that SHOULD have been an add, and were a subtraction, so maybe some economists are expecting a correction. Or maybe my model is just bad.
- What I am NOT including is any drag from airfares. If you’ve followed these tweets in the past you know that airfares have been quite low for the level of jet fuel prices (see chart, red dot is end-of-Nov fuel and end-of-Oct SA fares)

- This month, jet fuel prices plunged, so I think some people have penciled in a decline in airfares. And it could happen. But all this really does is move fares back in line with the current jet fuel (yellow triangle, if NSA fares were unchanged).

- FWIW, there is no strong seasonal adjustment from Oct to Nov in airfares. They tend to drop in December, but that shouldn’t be in this report.
- Previously, I’d been assuming a boost from airfares moving back in the direction of the trendline. That hasn’t happened. If again the dots move just parallel to the line, the jet fuel drop implies about a -3.3% decline in airfares, which is worth 2.5bps on core.
- So if we get a low number like that, the first place I’m looking is shelter (just because it’s big); the second place is airfares.
- Obviously we’re still going to watch shelter. OER was +0.41% m/m and Primary Rents +0.50% last month. I expect both of those to be lower. On the other hand, Lodging Away from Home should swing in the other direction, so shelter overall should be similar to last month.
- Fair disclosure that my Primary Rents model starts to drop fairly rapidly now, so if I take the number naively then I’d be penciling in 0.32% m/m for Primary Rents. That would be much lower than anything we’ve seen m/m yet. And, anecdotally, I don’t see that yet.
- Finally – my headline ‘forecast’ is higher than others’. And that’s because of piped gas, and because I don’t get fired if I miss. Natural Gas spiked in October; given usual lags that SHOULD mean ‘Piped Gas’ is higher this month.
- That would add 7bps, while gasoline drags about 22bps. But subsequent to that, Nat Gas has dropped sharply. And I don’t think most people want to forecast HIGHER gas and try to catch the zig-zag. Safer to just forecast flat.
- If it’s flat, then my headline is exactly in line w/ CPI swaps: -0.21% m/m NSA, +0.10% SA headline. But if I’m taking the mechanical drag from gasoline then I’m taking the mechanical bump from Natty. (Although to be fair, gasoline passes into CPI directly and Natty doesn’t.)
- Turning to markets. Market movements this month are all lower, as the massive bond rally can be seen in real rates and in breakevens.

- Let’s not lose sight of the fact that the monetary metrics are continued good news. M2 is still negative y/y and q/q. And bank loan growth is also very soft (a lot of that is mortgages though).

- Now, you can kinda think of the ‘potential energy’ as the amount the line moved above some trend…say 5%, 6% money growth or loan growth…and it needs to ‘absorb’ that by being below by a certain amount (or the price level will be permanently higher, which is likely the case).
- How long can money growth be below 0? I’ve already been surprised! But if the market is right about the substantial Fed easing in 2024, then money growth will not stay low enough, for long enough, to get inflation back to where everyone wants it.
- OK, bottom line is that everyone is forecasting a SOFT 0.3% on core, meaning that it will round up and barely keep y/y rounding to 4.0%. If shelter comes in soft or airfares moves with jet fuel, it will be a downside surprise.
- But stocks are already on the roof and bonds are 75bps off the high yields. I am not sure an 0.23% or 0.24% on core will be greeted with a tremendous market rally. But 0.31%…or heaven forbid an 0.34% that turns Core CPI up a tick? That would be ugly.
- Ergo I think a downside surprise is the bigger chance, but the smaller effect. I’d sell the initial pop. An upside surprise: I wouldn’t try to catch the knife. Especially in illiquid year-end conditions.
- So that’s a wrap. Good luck today, and thanks again for your persistent support!
- Humorously, it looks like Twitter changed its authorization hooks again. So the auto chart will be manual again. Wish it could have been smooth for this last month! I’ll do it pretty quickly though.
- Well, +0.097% on SA headline, and +0.285% on SA Core. Higher than expectations, but not by much.
- Immediately jumping out is OER at +0.50%, higher than last month’s +0.41%. Primary Rents +0.48%, down slightly from last month but still wayy above my model. And my model is higher than what the Street has, which has been projecting deflation next year in rents.
- Used Cars was in fact an add. +1.58%, despite a 4% fall in (NSA) retail prices. The BLS seasonals just don’t have that much of a drop off, so it must be that some other survey was showing higher retail used car prices.
Some charts in a minute. BLS blocked everything for a bit.
- Airfares was -0.39%; recall I’d assumed flat despite a large decline in jet fuel. Feel good about that one. But Lodging Away from Home was -0.9% m/m.
- Last 12 Core CPI. The downside momentum is less evident now.

- Major subgroups. I will come back to this. Medical Care was an outlier compared to recent trends. Doctors’ Services rose more than 1% m/m. As I said I’ll come back to that.

- Core goods inflation got to 0, but core services inflation stayed at 5.1% y/y. I continue to think core goods inflation is just about done declining, but Used Cars keeps pulling it slowly lower.

- OER and Primary rents. Yes, they’re decelerating. But wayyyyyyyy less than people expected. 0.50% on OER m/m, and 0.48% on Primary Rents. Lodging Away from Home was the only drag on shelter.

- Some ‘COVID’ Categories:
Airfares -0.39% M/M (-0.91% Last)
Lodging Away from Home -0.93% M/M (-2.45% Last)
Used Cars/Trucks 1.58% M/M (-0.8% Last)
New Cars/Trucks -0.06% M/M (-0.09% Last)
- My early guess on Median CPI is a rise to +0.434%, above 0.4%. As with core, the downside momentum here isn’t clear any more. Leveling out in the mid 0.3s gets us 4.25% or so y/y. Not good enough.

- Piece 1: Food and energy was a bit of a drag. HOWEVER, Piped Gas was +4.05% m/m, which added 0.04% to headline inflation – that’s the main source of the headline miss. I should note, I pointed this out…overall, Energy was a -0.23% drag.

- Piece 2: core goods, back to flat.

- Piece 3: the most disturbing piece, because it’s ‘supercore’ and now hooking higher. This is medical and I’ll come back to it.

- Piece 4 rent of shelter. A loooooooong way to go before deflation!

- Food was +0.22% m/m (SA), after +0.30% last month. Food at home was softer thanks to declining shipping, packaging, and commodities costs: +0.11% SA m/m vs 0.26% last. Food Away from Home remains bubbly thanks to wages: +0.43% SA m/m vs +0.37% last.
- Doctors’ services jumped 0.55% m/m. Y/y, it’s still -0.7%, but this jump contributed to the surprise in core and in ‘supercore’. It’s mostly a payback for the -1% surprise plunge last month.

- Medicinal Drugs was +0.45% m/m vs 0.6% prior. But Prescription Drugs jumped to 3.77% y/y. Have no fear: the Biden Administration just threatened to seize patents for any drug increasing prices too much. https://inflationguy.blog/2023/12/07/beware-the-price-controller/

- Core inflation ex-housing rose to 2.13% y/y, the first sequential acceleration since March. Not alarming at 2.13%, but prior to COVID this was in the low 1s.
- Biggest m/m declines were Mens/Boys Apparel (-26% annualized), Car/Truck Rental (-24%), Infants/Toddlers Apparel (-15%), Womens/Girls Apparel (-13%), Motor Vehicle Fees (-13%), and Lodging Away from Home (-11%). The Apparel decline is seasonal holiday discounting.
- Biggest annualized m/m core increases: Used Cars & Trucks (+21%), Tobacco & Smoking Products (+15%), Public Transportation (+13%), and Motor Vehicle Insurance (+12%).
- I love it when a plan comes together.

- Glancing at the markets, I must say I haven’t the slightest idea why we rallied hard in both stocks and bonds on this data. This is not bullish data.
- Have to point out the inflation swap market nailed the headline figure. You can’t trade core in size, but the Kalshi market going in had it at +0.32%. That always seemed high to me.
- Overall, this was fairly close to expectations but the fact that it was shelter holding it up – which is why Median was high, also – is bad news. The entire mainstream thesis on inflation going back to target DEPENDS on something close to deflation in housing.
- …well, deflation in housing OR calamity elsewhere in services. Thanks to the lags in housing, core inflation is going to drip somewhat lower, but it won’t get below 3% before it is hooking higher UNLESS housing really does belly flop. No sign of that at all.
- I guess the counterargument is “but it’s ONLY housing holding it up.” That’s not really true, though. Actually the far left tail of goods in deflation is getting bigger – but that’s the short-cycle stuff (e.g. core goods) that will rotate back up. Services, housing still high.

- I shouldn’t obscure the good news, which is that the breadth of inflation is narrowing. And the decline in the monetary aggregates is promising. The problem is that we have just SO FAR TO GO and the market anyway is expecting the Fed to take its eye off the ball.

- In conclusion – yes, Virginia, this IS the hard part. Core and Median will drip lower thanks to shelter. That takes us from 4% to what, 3-3.25% in 2024 – before shelter’s disinflation is complete. Then what?
- I continue to expect inflation to settle in the high 3s, low 4s, although continued decline in the aggregates will have me push that a little lower. Maybe we’re mid-3s to high-3s in the medium term now, with cycle bottom around 3%. Is that good enough? Doesn’t feel like it.
- That’s all for today. And all for @InflGuyPlus! Thanks again for subscribing to this channel. Be sure to subscribe to the blog at https://inflationguy.blog and follow the podcast at https://inflationguy.podbean.com or your favorite podcast app – so we’ll stay in touch. Merry Christmas!
This number was a little bit above expectations, led by shelter, Used Cars, and Physicians’ Services. There weren’t a lot of large surprises (Physicians’ Services was an unexpected jump but last month it had an unexpected decline so this is best viewed as a give-back), which helps explain the relatively placid market response. Ultimately, how you feel about inflation these days comes mostly down to shelter although it is worth pointing out that ‘super core’ (core services ex-rent of shelter) hooked slightly higher too.
To get inflation back to target in 2024, we would need one or more of the following to happen:
- Shelter inflation indeed goes negative, as the mainstream forecast expects (but I do not – I believe rents will level off around 3% y/y and then likely rise from there); or
- Core goods goes into hard deflation, of -2%ish. With Used Cars already having given up 17% or so off its highs, it is unlikely to be the driver of that. Apparel? Medicinal Drugs? (chart below shows the striking relationship between the growth in M2 since the end of 2019 and the contour of Used Car prices – driving home again how important a continued decline in the money supply is, if we want inflation to get tame again); or

- Core Services ex-Shelter decelerates markedly. For that to happen, we’d probably need to see wages decelerate a lot more. The chart below shows the Atlanta Fed wages measure (y/y) in black, and ‘supercore’ as Bloomberg calculates it in blue. If you want Supercore down to 2%, then you probably need wages at 3-4%. We have a long ways to go there.

To repeat my recent theme: while the inflation numbers are better, and will keep getting better for a while in 2024 because of easy comps and positive trends, we are into ‘the hard part.’ The current trends do not point to inflation placidly returning to 2-2.25% in 2024, or in 2025 unless the money supply continues to shrink.
And that’s where we run into the issue. The market is pricing in something like 125bps of eases over the course of 2024. While it’s possible that the Fed could cut rates while continuing to shrink the balance sheet (since the Fed funds rate is now just stated, rather than being managed through pressure on reserve balances), it would be very odd for the Fed to do something that looks like easing with one hand and tightening with the other. They’d come under a tremendous amount of criticism for that. While that’s actually my recommended strategy for them, I don’t give it much chance of happening.
So, if that’s not going to happen, then one of two things is going to happen:
- The Fed eases in 2024, and ceases shrinking the balance sheet. This is great for the bond market in the short term, but it would mean inflation probably wouldn’t even get back to 3% on core before re-accelerating. And no one will be able to blame the next increase (probably not a spike) on COVID.
- The Fed does not ease in 2024, in which case at some point the bond and stock markets are going to have to stop pricing loose money. That would of course be very bad for stocks and bonds.
There aren’t any easy ways out. Yes, that’s what “this is the hard part” means!
Summary of My Post-CPI Tweets (Oct 2023)
Below is a summary of my post-CPI tweets. You can follow me on X at @inflation_guy. Sign up for email updates to my occasional articles here. Individual and institutional investors, issuers and risk managers with interests in this area be sure to stop by Enduring Investments! Check out the Inflation Guy podcast!
- Welcome to the #CPI #inflation walkup for November (October’s figure). This is the next-to-last month I will be doing this!
- If you miss the live tweets, you can find a summary later at https://inflationguy.blog and I will podcast a summary at inflationguy.podbean.com . Those will continue in 2024 after the live tweeting stops.
- Well, this report ought to be interesting. My forecasts are very different from the other forecasts out there. The Bloomberg consensus has +0.09% on SA headline, and 0.30% on core. The swap market, Kalshi, and Cleveland Fed are all in the same ballpark.

- I have 0.14% NSA, roughly 0.22% on headline, and 0.38% on core.
- It is a little wild to me that everyone else is so low, and it makes me concerned that I’m missing something. But I think it comes down to the fact that everyone must be expecting a big give-back on OER this month.
- Used car prices should add this month. Health care insurance pivots from an 0.04% drag to an 0.02% add. Even airfares could rise, despite sliding jet fuel, because fares are too low given the level of fuel.
- All of those are in my forecast (well, I conceded flat on airfares but it could go either way). I assume they’re in everyone’s forecast. So that leads me to believe that the assumption is a correction in OER is in store.
- OK, I see the chart too. It sure LOOKS like OER did something weird last month. If OER prints 0.45% m/m instead of 0.55%, then that takes 2.5bps off my forecast. That still doesn’t get there. You need an 0.35% or something.

- And oh by the way, I’d argue that the jump might just be payback for a too-rapid fall that happened earlier this year. There was no reason to expect monthlies to drop from 0.7% m/m in Feb to 0.48% in March. Rents are not collapsing and home prices are now going back up.
- I know that’s inconvenient to the deflation story but it’s right on par with where my model says it should be. (Our model is Primary Rents but OER is based on rents).

- So okay, I’ll drop my forecast 2.5bps on the assumption we go back to 0.45% m/m for OER. Now ya happy?!? But I’m not assuming any ‘payback’.

- Meanwhile, I haven’t even talked about the fact that I have +1% on Used Cars, but that might be too conservative given how strong auctions were in the latter part of September (not picked up in the last number).
- And I don’t have anything for New Cars – but thanks to the new wage agreement, car prices both New and Used are going to go up again.
- I’ve already spoken plenty about the reversal in Health Insurance; it shouldn’t take anyone by surprise this year.
- The change in method means that the shift from -0.04% to +0.02% per month should only last six months – it shortens the lag but this transition period increases the effect to synchronize.
- With all this, Core CPI should stay at 4.1% y/y, or rise (if my forecast is on point). As I said last month, getting it below 4% is going to be more of a challenge. And Median inflation will fall to probably around 5.25% this month, but again we’re in the hard part now.
- Breakevens have net slumped a bit this month, but that hides the fact that after last month’s CPI they spiked for a week or so. 10y breaks got to 2.50% in the bond market selloff before settling back.

- If the bond bear market continues (and the balance of large government budget deficits, smaller trade deficits, and a Fed in run-off means more pressure on rates to attract domestic savers), breakevens will go back up.
- Not sure that’s a good play in Q4, since this tends to be a good seasonal time for bonds, but a bad CPI could change that. And, naturally, with a recession coming (we think?) it’ll be harder to get higher rates immediately.
- However…the secular bull market in bonds is over so the real question is whether interest rates are aimless for a decade, or in a secular bear market. Too long a topic for a tweet storm!
- So that’s it for the walkup. Pretty simple task today: 1. check OER, 2. check core ex-housing, 3. check core services ex-housing (“supercore” for a finer read on the Fed (?))
- Keep checking the improving distribution of inflation – core below median means the tails are moving to the downside, in a disinflationary signature, but not sure that will outlast 2024.
- Good luck!
- Very soft number! Let’s see how much of this is ‘payback.’
- If it’s CPI day there must be I.T. issues. It’s a law. Headline was +0.045%, Core +0.227%. Used cars was a DRAG, which is completely at odds with surveys. OER dropped to 0.41% m/m, but that by itself wouldn’t be enough for the downside surprise.
- Airfares fell, Lodging away from home fell significantly, New Cars was a marginal decline…and health insurance didn’t add as much as it was supposed to (not sure why) although it was positive. Looks like a well-rounded soft number.
- Here is m/m OER. Back to prior level, but no payback.

- In the big picture, the 3-month average isn’t all that soothing, especially when we look at Used Cars and other quirks that will likely be repaid.

- So Black Book was -1.85% in September, NSA CPI Used Cars was -5.63%. BB was +1.07% in October, NSA CPI Used Cars was -1.40%. Private auctions were strong. This is confounding – might be a seasonal quirk that BLS reflects different seasonals, but the NSA pretty far off.
- m/m CPI: 0.0449% m/m Core CPI: 0.227%
- Last 12 core CPI figures

- M/M, Y/Y, and prior Y/Y for 8 major subgroups

- Primary Rents: 7.18% y/y OER: 6.85% y/y

- Further: Primary Rents 0.5% M/M, 7.18% Y/Y (7.41% last) OER 0.41% M/M, 6.85% Y/Y (7.08% last) Lodging Away From Home -2.5% M/M, 1.2% Y/Y (7.3% last)
- Some ‘COVID’ Categories: Airfares -0.91% M/M (0.28% Last) Lodging Away from Home -2.45% M/M (3.65% Last) Used Cars/Trucks -0.8% M/M (-2.53% Last) New Cars/Trucks -0.09% M/M (0.3% Last)
- Here is my early and automated guess at Median CPI for this month: 0.359%

- Now, this is really the important thing. Median is still 0.36%. That tells you this is left-tail stuff more than the rents stuff.
- Piece 1: Food & Energy: 0.17% y/y

- Food at Home was +0.26% SA; Food Away from Home +0.37%. Food added 0.04% to headline, which was right on my forecast. Look, talk to any restaurateur – wages are still a big problem. Food AFH isn’t going to deflate soon.
- Energy was -0.22% m/m NSA; I’d estimated -0.17% so it was very slightly more drag.
- Piece 2: Core Commodities: 0.0948% y/y

- Piece 3: Core Services less Rent of Shelter: 3.71% y/y

- Piece 4: Rent of Shelter: 6.76% y/y

- Core Goods: 0.0948% y/y Core Services: 5.5% y/y

- Core goods actually ticked up slightly. Despite the decline in Used and New cars.
- This is part of the core goods story – continued acceleration in Medicinal Drugs. Honestly this is something we’ve been expecting for a long time and just surprised how long it has taken. Many of the APIs for pharma come from China.

- Core ex-housing actually ticked up very slightly from 1.97% y/y to 2.05% y/y. That sounds great but prior to COVID it hadn’t been above 2% since 2012 so that’s still too high.
- Largest declines (annualized m/m) in core were Lodging Away From Home (which is quite surprising) at -26% and Car and Truck Rental (also surprising) at -17%. Both core services but only the latter is “supercore”.
- Largest advances Motor Vehicle Insurance +26%, Tobacco +25%, Jewelry and Watches +16%.
- I am probably not going to be exactly right on median because in my calculation the median category is Northeast Urban OER, which means we’re relying on my ad-hoc seasonal adjustment. Could be as low as 0.32% m/m, or a smidge higher. Either way, it’s not price stability.
- I guess on Health Insurance I’ll have to leave the explanation to someone with a pointier pencil. My calculations had the effect being about 2bps/month; this month is was about 0.8bps. I would call that negligible except that previously it had been a 4bps drag.
- Our housing model, updated with the latest data. Kinda right on par. But notice our model never gets anywhere close to deflation in housing. Those calling for such are going to be disappointed.

- This is a strange dichotomy and I wonder if some physician can explain it. Maybe doctors are making their money by channeling expensive services through hospitals. But it’s weird to see hospital inflation so buoyant while doctors’ services are deflating.


- Education and Communication was a little soft. Some of that was a curious (to me) -0.24% NSA m/m decline in College tuition and fees. Probably a quirk. Also Telephone hardware was -1.9% m/m.
- Apparel was soft – partly this is expected because of the lagged strength of the dollar on core goods, but the -5.1% decline in Women’s outerwear seems unusual.
- The EI Inflation Diffusion Index is back almost to flat. Note that doesn’t mean 0 inflation. To get back to persistently having Median CPI around 2-3%, you’d want to see the diffusion index quite a bit negative. I think that’s going to be difficult.

- Last chart, and it tells the story. Left tail is growing, but rest of the distribution is moving left only reluctantly. The big fingers on the right are housing. It’s encouraging that there is more diversity here – a sign that the money impulse that affects everything is waning.

- Here is today’s summary. Core was surprisingly tame but it was largely from some quirky one-offs. Median didn’t improve very much. Neither Core nor Median over the last 3 months is where the Fed wants it. This doesn’t change, therefore, the higher-for-longer meme.
- It also doesn’t demand further tightening, but that’s not news. We already knew the Fed was done.
- Looking ahead, there will be further slow progress on housing, although as I keep saying – not as much as some forecasters think. The problem is that outside of housing, core inflation doesn’t look like it wants to fall much further.
- Naturally all of this depends on what the Fed does going forward. If the money supply keeps bumping along around zero growth, then eventually the velocity rebound will run its course and inflation will go back to 2-3%.
- But higher rates mean that velocity is probably going to do more than just rebound, so higher for longer will need to be longer than people expect – or, possibly, than the Fed can maintain in the face of recession.
- That’s the hard part. This so far has been the easy part. If market rates rise again in sloppy fashion after the new year, despite recession signs…what does the Fed do? Inflation won’t be at target yet, or even close. Stay tuned!
- …and thanks for staying tuned. Have a good day.
The CPI was a happy surprise today, but not so much that I would throw a party. The low miss was partly caused by inexplicable declines in autos and lodging away from home, while the correction in rents basically just went back to the prior level rather than stepping down to a slower pace. Rents are still going to come down, and in some places in the country they are falling – but in some places they are still rising briskly.
That dispersion in experienced rental inflation is actually part of the good news, and it’s good news that we see throughout the CPI over the last several months. It’s the good news that the Enduring Investments Inflation Diffusion Index is capturing: all prices are not moving as one, as they mostly did during the upswing in inflation. A high correlation between unrelated categories tends to suggest a common impulse is causing the movement – and is yet another reason that the notion that inflation was coming from various idiosyncratic supply chain issues should never have been entertained. There was clearly a large impulse acting on all prices: the 20%+ spike in money growth. Now that the money supply is flat, though velocity is rebounding, price dispersion is reasserting.
(Spoiler alert: it isn’t yet happening on the inter-country experience – all countries saw their inflation move in synchrony when it went up, and all are seeing it move in synchrony coming down, so it’s early to say the battle is won.)
We’re still just starting the difficult part, from the standpoint of monetary policy but also from the standpoint of figuring out how quickly inflation can get tamped back down to target. And the dispersion makes that more difficult, because the signal gets lost in the noise – just as it used to, before the money gusher. Next month we’ll have to deal with likely rebounds in Lodging Away from Home as well as increases in autos, reversing this month’s surprises, but we’ll probably get slightly better rent numbers.
What I can say is that the market reaction to all of this is absurd. This just doesn’t move the needle on the Fed. There was no tightening and no easing in the pipeline before this number, and after this number that hasn’t changed an iota. But at this hour stocks are +2% and bonds are soaring. I know the conventional wisdom is that rates are going back to zero…it just seems kind of early to get on that train when median inflation is still 5.3%…
Where Inflation Stands in the Cycle
It’s important, I think, that I occasionally remind readers of a fact that is supported by overwhelming quantitative evidence, and yet virtually ignored by a wide majority of economists (and central bankers): inflation is a consequence of the stock of money growing faster than real economic growth. Period.
MV=PQ
That doesn’t mean that forecasting inflation is easy if we remember that fact, but at least we can make good directional predictions when, say, the stock of money rises 25% in a year, instead of mouthing some nonsense about inflation in such a case being “transitory.”
However, I realize that when someone mentions that equation a lot of people tune out, thinking this has become a religious argument between monetarists and Keynesians. So let me toss out some data. Keep in mind, there is measurement error in statistics for the money supply, real GDP (especially), and prices. And, as I’ve written before, sharp changes in M can cause a short-term impact on velocity until Q and P can catch up – my ‘trailer attached by a spring’ analogy. But over time, a shock move in velocity becomes less important (and reverses, which is what we are in the middle of), and so we would expect by simple algebra to see that a good prediction of the change in the price level is given by M/Q. Is it?
First let me share one of my favorite charts from a Federal Reserve Economic Review.[1] I’ve been using this for years.

This is over 5-year periods, and you can see that there’s a pretty good correlation – especially for large changes – in the change in the ratio of money/income and the change in prices. (By the way, the original article is still worth reading).
Here is another chart from that note, updated by me through the end of 2022.
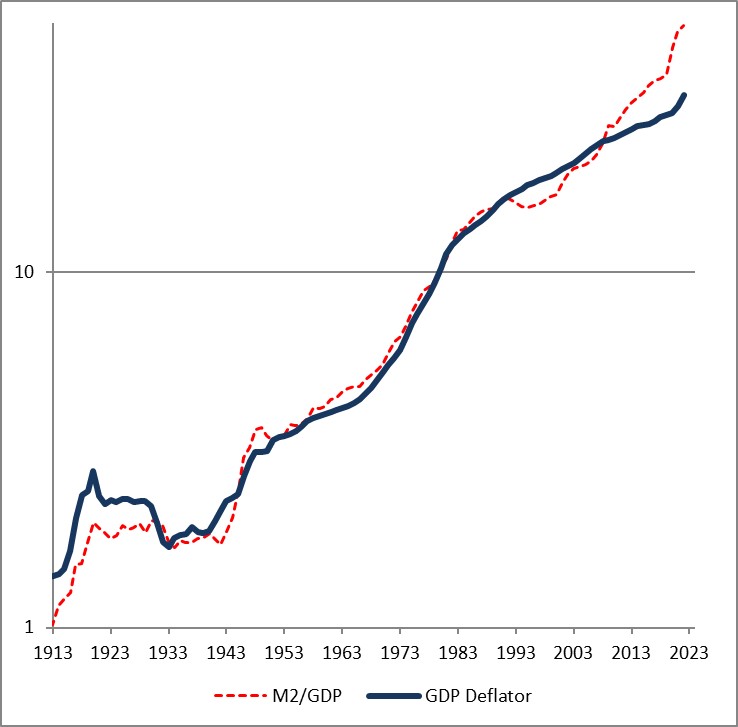
The fact that the price level has gone up a little bit less than the ratio of money to GDP over time is a reflection of the fact that money velocity has gone down slightly, and then more quickly, over the last 110 years. If you think velocity will fully revert, then the blue line will eventually converge with the red line – but in my mind there’s no reason to believe that velocity is stable or entirely mean-reverting over time…only that it doesn’t permanently trend higher or lower like money, prices, and GDP do.
Obviously, this leads us to the question of where we are now. Here is a chart of the change in headline prices (CPI) as a function of the change in M/Q for five countries/regions.
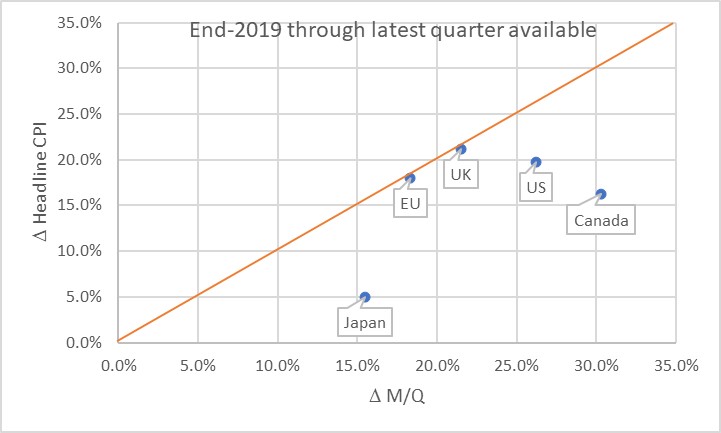
The chart basically says that the UK and EU have seen prices move almost exactly what you would have predicted, if you could have known in advance what M and Q were going to do. Naturally, none of us knew that. Japan, the US, and Canada haven’t seen prices rise as much as you would have expected, yet. Some of the reason why not is the effect I mentioned earlier: the dump of money into accounts during COVID was so fast that there was no time for prices to adjust. Actually, it’s only this close because food and energy adjust more rapidly…if you look at the picture with just core inflation, it appears there’s still some lifting to do to get back to the 45-degree line. As energy prices and food prices mean-revert some, core inflation should stay a little bubbly for a while.
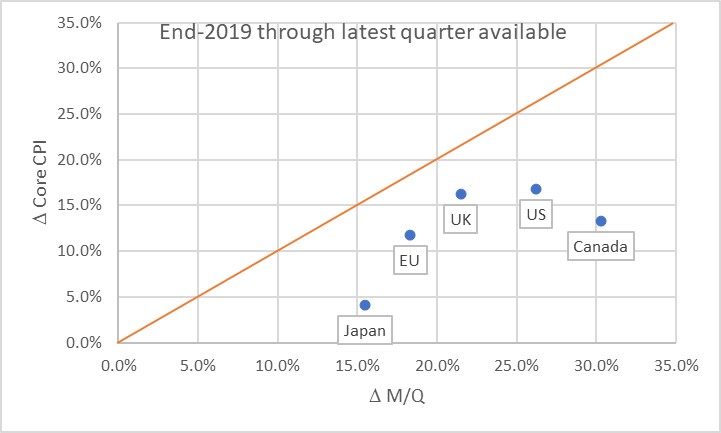
Now, there’s three ways to get back to the line. We can see prices rise. We can see GDP rise. Or we can see the money supply fall. The latter two effects are better for consumers. The “GDP rises” is the best for everyone, although that’s the slowest-moving of the pieces. The “money supply fall” option is the best for consumers, but the worst for investors. Presently, we’re seeing a little bit of all three. But here is where I should take a moment to highlight how important the Fed’s balance sheet reduction has been in this process. Here is a chart from 2019Q4 to the present, just for the US, showing how this relationship developed over time.
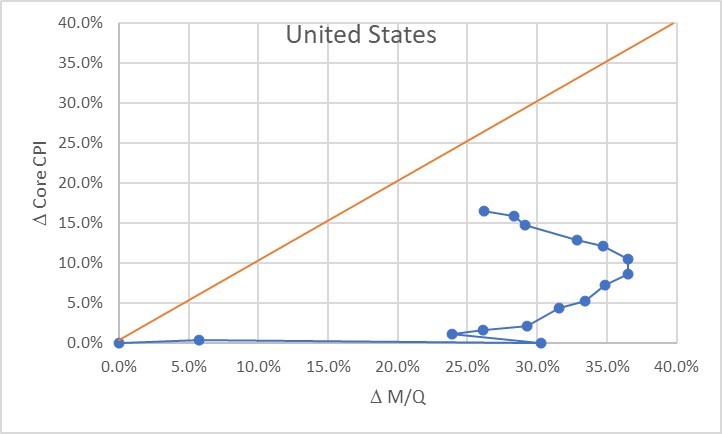
Initially, of course, there was a massive increase in money with no change in prices, as COVID hit in 2020. The point at (30%, 0%) is what the Fed had to work with as the lockdowns began to be lifted in late summer 2020. The sharp single-quarter reversal there was the result of the massive GDP spike in 2020Q3.
At that point, we would have anticipated that if nothing else happened, we would see a gradual 23% or so increase in the price level. If the Fed had immediately pulled back on the money printing, probably a lot less. Instead, the money printing continued for quite a while until by the middle of 2022 we were looking at a change in M/Q of about 37% since the end of 2019. Right about that time, the Fed got alarmed and began to shrink the balance sheet (and hike rates, although you will notice that the price of money does not show up on this chart but only its quantity!) That, combined with some decent growth, has decreased the pent-up pressure on prices. As of the end of 2023Q3, the aggregate M/Q change was 26.2%, while core prices had risen 16.4% (headline prices, including a 33% increase in energy and a 25% increase in food prices, are up 19.5% since the end of 2019).
If the money supply grows only at the rate of GDP from here, then this line will turn vertical and we have about a 10% increase in core inflation to ‘make up’ before we are back on the line. The good news is that the Fed currently is still reducing its balance sheet; the bad news is that M2 since April has stopped declining. More bad news is that GDP is likely to be soft or even negative here over the next few quarters, judging from payrolls, delinquencies, and other data. We could also hold out hope that velocity won’t fully rebound to pre-COVID levels, but there’s no reason other than “it sure would be nice if that happened” to expect that. Ergo, I think we’re still looking at higher-for-longer not just in the interest rate structure, but in the trajectory of inflation.
The most astonishing point on the charts above, in my mind, is the Japan point especially on the first chart. The amazing part isn’t that Japan’s inflation rate is lower than that of other countries here. They’ve added less money, so as a first pass you’d expect less inflation. But what’s amazing is that the Yen is also an absolute basket case, which means that imports – like, say, oil or gasoline – have gone up a lot more in price than for other countries. Crude oil in USD has risen about 22% in USD terms since the end of 2019. It’s up 66% in Yen terms! And yet, even with that Japanese inflation has stayed relatively low. So far. These charts tell me that I’d want to buy Japanese inflation and sell EU and UK inflation, where prices are closer to already reflecting the effect of the money geyser than they are in Japan.
[1] “Are Money Growth and Inflation Still Related?”, Economic Review, Federal Reserve Board of Atlanta, 2nd Quarter, 1999. https://www.atlantafed.org/-/media/documents/research/publications/economic-review/1999/q2/vol84no2_dwyer-hafer.pdf
Money Velocity Update!
Now that we have our first estimate of GDP for Q3, we also have our first estimate of M2 velocity for the third quarter. Because there is an amazing amount of uninformed hypothesis out there, I figured it was worth a quick review of where we are and where we’re going, and why it matters.
Why it matters: without the rebound in velocity, the slow-but-steady decline in M2 that we have experienced since mid-2022 would be outright deflationary. The money decline and the velocity re-acceleration are part and parcel of the same event, and that is the geyser of money that was squirted into the economy during COVID. Velocity collapsed for mostly mechanical reasons: it is a plug number in MVºPQ, and since prices do not instantly adjust to the new money supply float, velocity must decline to balance the equation. Another way of looking at it is that if you add money to people’s accounts faster than they can spend it then velocity will decline. I have previously presented an analogy that in this unique circumstance money velocity behaves as if it were a spring connecting a car, speeding away suddenly, with a trailer that has some inertia. Initially the spring absorbs the potential energy, and later provides it to the trailer as it catches up. Ultimately, the spring returns to its original length, when the car has stopped accelerating and the trailer is going at the same speed.
As M2 has declined in an unprecedented way, after surging in an unprecedented way, velocity has rebounded in an unprecedented way after plunging in an unprecedented way. All of these things are connected, episodically (but we will look at the underlying, lasting dynamics in a bit). With this latest GDP update, M2 velocity rose 1.9%, the 9th largest quarterly jump since 1970. Over the last four quarters, it has risen 10.4%, the largest on record, and 16% over eight quarters, also the largest on record.

https://fred.stlouisfed.org/series/M2V
To return to the level M2 Velocity was at, at the end of 2020Q1, it needs to rise another 4.8%. For M2 to return to the level it was at, at the end of 2020Q1, it needs to fall another 23%. One of these is likely to happen; the other one is not. The net difference, after subtracting cumulative growth (8.8% since then, so far), is a permanent increase in the price level. If M2 continues to come down, the net effect is a higher level of inflation over this period but not calamitous.
Note that there is no way we get the price level back to where it was, unless M2 declines considerably farther for considerably longer, or unless money velocity inexplicably turns around and dives again. I know that some well-known bond bull portfolio managers have been calling for that, but they were wrong the whole way along so why would you listen to them now?
I’ve been pretty clear that (a) I have been surprised that the Fed was successful in decreasing the money supply, since I thought the elasticity of loan supply would be more than the elasticity of loan demand (I was wrong), (b) I think the Fed deserves credit for shrinking the balance sheet, which they have long said doesn’t matter (it matters far more than interest rates, for inflation), (c) Powell deserves credit for turning into a hawk and pushing the institution of the Federal Reserve to become hawkish after decades under Greenspan, Bernanke, and Yellen where the only question being asked was ‘do we wait for the stock market to drop 10%, or only 5%, before we flood the system with money?’ Chairman Powell deservedly will go down in history as the guy who recognized the ‘spring effect’ that kept long-term upward pressure on inflation even as so many people were chirping about supply constraints and ‘transitory inflation’ (including, to be fair, Powell himself. But whatever he said, what he did was pretty reasonable).
However, the next bit is going to be challenging.
Velocity, being the inverse of the demand for real cash balances, is primarily affected by two main forces – one of them durable and one of them ephemeral. The ephemeral effect, which is rarely super-important, is that people tend to want to hold more cash when they are uncertain. Indeed, our model for velocity actually captured accidentally some of the ‘spring effect’ because for us it showed up as extreme uncertainty. Put another way, even if the Fed hadn’t flushed tons of money into the system, velocity would have had something of a sharp decline because of the high degree of economic uncertainty. Ergo, it was crucial that they flush in at least some money because otherwise we would have had outright deflation. They didn’t get the magnitude right, but they got the sign right. Anyway, the ‘uncertainty’ effect doesn’t last forever. The measure of uncertainty I use is a news-based index of economic policy uncertainty; it has retraced about 85% of its spike although it has been persistently high since political divisiveness became the main fact of US political life back in 2009 or so.

The more durable effect on the desire to hold cash is the presence of better-yielding alternatives to cash. When interest rates are uniformly zero and the stock market is on the moon, there’s very little reason to not hold cash. But when non-cash rates are high, and stocks and other investments more reasonably priced, cash is a wasting asset that people want to ‘put to work.’ The easiest way to see that is with interest rates, which for the last couple of decades have tracked the decline in money velocity closely as both declined.
And here is the problem. If interest rates are back at 2007 levels, then naïvely we would expect velocity to be back in the vicinity of 2007 levels also. But that is massively higher than the current level. In 2007, money velocity was around 1.98 or so: about 49% higher than the current level!

Needless to say, there’s no way the money supply is contracting that much. If velocity rose even, say, 30% then we would have a serious and long-lasting inflation problem. Fortunately, because of the economic policy uncertainty and other non-interest rate effects (I did say that “naïvely” we would be looking for 1.98, right?), the eventual rise in velocity beyond the snap-back level is much less than that. It actually only adds about 6% to the snap-back level. That still means 2% more inflation than would otherwise be expected, for three years, or 3% more for two years.

Of course, interest rates could fall again and ‘fix’ that problem. But it’s hard to see that happening while the money supply continues to contract, isn’t it? And that’s where it gets difficult. If you continue to decrease the balance sheet – which you need to do – and money continues to contract, then you probably get more velocity and inflation stays higher than you expect. Or, if you drop interest rates then you don’t get velocity much over the pre-COVID level, but you also get more money growth and inflation stays higher than you expect.
All of which adds up to one reason why I continue to think that inflation will stay sticky and higher than we want it, for a while. Powell has surprised me before, though, and this would be a good time to do it again.
Summary of My Post-CPI Tweets (September 2023)
Below is a summary of my post-CPI tweets. You can (and should!) follow me @inflation_guy. Sign up for email updates to my occasional articles here. Individual and institutional investors, issuers and risk managers with interests in this area be sure to stop by Enduring Investments! Check out the Inflation Guy podcast!
- Welcome to the #CPI #inflation walkup for October (September’s figure).
- At 8:30ET, when the data drops, I will pull down the data and then run a bunch of charts. Then I’ll comment and post some more charts. As usual. But nearing the end of this string. December is the last month I’ll do this live.
- Later, I will post a summary of these tweets at https://inflationguy.blog and then podcast a summary at inflationguy.podbean.com . Those will continue after the live tweeting stops in 2024!
- The estimates for this month’s CPI data are fairly uniform across sources in expecting 0.26% m/m core, and 0.31% or so on seasonally-adjusted headline. My forecasts are a bit higher on Core, but in-line on headline. Here’s why.

- First of all, while used car prices declined this month they fell by less than the seasonal adjustment factor would suggest. Instead of -1.9%, which is the non-seasonally-adjusted pace that Kalshi shows for its used car CPI market, I see +1.3% for the SA pace.
- However, there’s a huge amount of variance there so I am actually penciling in flat. Partly, that’s also because used car prices haven’t yet fallen as much in the CPI as the Black Book survey would project, so maybe I’m too high.
- Used car auctions in the latter half of this month were very strong, though, thanks to the strike against US auto makers. That hasn’t yet affected sales, but the auctions show it SHOULD affect prices since there is less reason to clear the lot if there are no more cars coming.
- But although used car auctions have been strong, I don’t expect CPI to LEAD the Black Book survey. CPI almost never leads.
- So if new car CPI isn’t strong this month, I expect it to be strong next month. Ditto with used cars. In fact, “if not this month, next month” will be a constant theme here.
- Same is true of airfares, which last month rose about 5% but still lag far behind jet fuel – which has continued to rise. I expect another add there. And Lodging Away from Home was a surprise decline last month, which I am expecting to reverse this month.

- Now, this month we do still have the 4bps drag from health insurance…but that reverses next month. Enjoy it while you can.
- We are coming to the end of several of these trends that have flattered the CPI (or flattened it) recently: health insurance & the drag from used cars being the big ones. Used cars still has downward pressure from rates, but the strike is more important.
- Thus, while y/y core CPI should get down to 4.1% or 4.2% this month (due also to easy comps vs 2022), getting it BELOW 4% is going to be tougher.
- One trend that will be continuing for a while is the slow (accent on slow) deceleration in shelter inflation. Last month, OER was +0.38% and Primary Rents +0.48% m/m. That was right on my model. This month I have Primary Rents at +0.40% m/m, and the combination at +0.38% m/m.
- Obviously the rent thing will continue for a while, but it won’t slow down as fast as people expect. I think that must be the reason that the consensus forecasts are soft given the obvious adds this month. So we will see.
- Interestingly, the consensus on headline is roughly where MY headline estimate is despite my higher core. That means economists see food and energy adding more than I do. I don’t see that. Gasoline was basically flat Sept/Aug. I have 1bp from energy and 1bp from food.
- Of course, with war in the Middle East – though weirdly, energy markets have been incredibly insouciant here – there is much more upside potential to energy prices going forward. And not much downside, unless growth collapses.
- And while there are plenty of people looking for a growth collapse…I don’t see that. A recession, definitely, but a deep one? One that damages the financial infrastructure? Not really. Might be long, but not deep. And with inflation as well.
- From a markets perspective, it has been a weird month in inflation. Real rates have shot up MORE than nominals, which is something you’d expect at the start of an expansion, not with recession coming on.

- Breakevens are DOWN even though overall rates are UP, in other words. It’s bizarre;as I said in my podcast last week TIPS are finally an absolute buy, not just a relative buy compared to very-expensive nominals. https://inflationguy.podbean.com/e/ep-84-is-it-time-to-buy-tips/
- Incidentally, also take a look at the nice Q&A that Praxis did with me this week. https://lnkd.in/emCrcnHs
- And while I’m thinking about it, take a look at the new Enduring website: https://www.enduringinvestments.com
- I said last month: “I think markets recognize that the narrative is turning, from “we are in an inflationary spiral” to “inflation is coming down” to “okay now it gets harder.” And that leaves breakevens a bit aimless for now.”
- Still true…but we are further into that turning. It gets more difficult now. The Fed’s job is also getting more difficult, but we’ll wait to see what this number is before talking too much about that.
- That’s all for the (short) walkup. Good luck today!
- We are at 0.323% on Core, and 0.396% headline, so higher than expectations. BLS made some more changes in the way they roll out the release, so I’m about 1 minute behind schedule.
- I can already see Used cars was a drag but rents a big gain as OER rebounded from last month and Lodging Away from Home bounced (as expected).
- m/m CPI: 0.396% m/m Core CPI: 0.323%
- Last 12 core CPI figures

- OK, so looking at this…it’s a bad number but a lot of this is probably going to trade to OER. Still, June and July start to look like the aberrations they were.
- M/M, Y/Y, and prior Y/Y for 8 major subgroups

- Nothing really stands out here…Housing obviously strong.
- Core Goods: 0.0221% y/y Core Services: 5.69% y/y

- The overall trends in core goods and services are positive. Core goods going negative y/y is lower than I think is sustainable, and it should start to turn. Although with the dollar as strong as it is, it’ll take longer than I had been expecting.
- Primary Rents: 7.41% y/y OER: 7.08% y/y

- So you can see no big change on the y/y trends. They’re slowing, but (as I’ve said) they’re not slowing as fast as everyone seems to think they will. OER’s jump this month will get the press, but overall the trend is in line.
- Further: Primary Rents 0.49% M/M, 7.41% Y/Y (7.76% last) OER 0.56% M/M, 7.08% Y/Y (7.32% last) Lodging Away From Home 3.7% M/M, 7.3% Y/Y (3% last)
- However, the m/m on primary rents also are higher than my model. Remember, costs for landlords are continuing to rise – it’s hard to imagine that rents will actually decline and landlords will just accept losses. There’s new supply, but way more new demand from immigration.
- Some ‘COVID’ Categories: Airfares 0.28% M/M (4.89% Last) Lodging Away from Home 3.65% M/M (-2.97% Last) Used Cars/Trucks -2.53% M/M (-1.23% Last) New Cars/Trucks 0.3% M/M (0.27% Last)
- The rise in airfares is still lower than it should be and I will expect a further increase next month. Lodging Away from Home was an expected bounce, and on par. The decline in Used cars is probably at least temporarily over thanks to the strikes – we will see it next month.
- Here is my early and automated guess at Median CPI for this month: 0.439%

- The caveat to my median estimate is that the median category is a regional OER, which I have to guess at seasonal adjustment for. But this is the highest median since February. Again, July was an obvious outlier and now it’s more obvious.
- Piece 1: Food & Energy: 1.96% y/y

- No surprise there’s a bounce in food and energy y/y this month.
- Piece 2: Core Commodities: 0.0221% y/y

- Piece 3: Core Services less Rent of Shelter: 3.56% y/y

- This includes Health Insurance…and that will reverse next month. Instead of dragging 4bps/month on core, and 10-12 on this subgroup, it’ll be adding back 2bps/month on core.
- Piece 4: Rent of Shelter: 7.2% y/y

- In the good-news category, Core ex-housing is down to 1.97% y/y. So, if you ignore housing, the Fed is at target. Except that’s largely thanks to Used Cars and Health Insurance decelerations, both of which are tapped out. As I said, it gets harder from here.
- Core Categories with the largest m/m declines (annualized): Jewelry/Watches (-27%), Used cars & Trucks (-26%), Women’s/Girls Apparel (-20%), Infants’ Toddlers’ Apparel (-18%), Motor Vehicle Parts & Equipment (-16%). This last one also is probably going to reverse due to strikes.
- Biggest annualized monthly gainers: Lodging AFH (+54%), Misc Personal Goods (+22%), Motor Vehicle Insurance (+17%), Misc Personal Services (+14%), Tenants/Household Insurance (+11%), Alcoholic Beverages (+10%).
- Further to that, Misc Personal Services was +1.1% m/m and Misc Personal Goods was +1.7%. Those only sum to one percent of the whole CPI so not a big deal. A big reason that the “Other” subindex was +0.57% m/m though.
- I have to confess a little surprise that yields and BEI aren’t up more on this. Yes, some will say it’s “just OER” and that looks like something of a makeup number…but at the VERY LEAST it should make the disinflationists question that KEY PART of their theory.
- Maybe…just maybe…rents aren’t going to collapse into deflation? I dunno, just spitballing here, but since there’s no sign of it, and home prices are rising again…a number like this ought to at least make you think about the possibility.
- OK, the response after the initial drop-and-bounce looks like people are having a think. I should say that I don’t think this changes the Fed’s trajectory – they’re done, although this brings in the chance for one more 0.25% to appease the hawks.
- But clearly, 500bps of rate hikes hasn’t done the trick so what will 25 or 50 more do? Or 200? All that will do is slow the economy, without hurting inflation. There is little to no evidence that rate hikes push inflation lower, and at this point even the hawks must be noticing.
- Running some diffusion stuff now. The story there continues to be positive. But we always knew the spike wouldn’t last forever – the question now is, where does inflation fall to? And so far, there’s no sign we’re going to plunge back to 2%. The hard part has started.

- Another diffusion chart. Slightly worse this month (this is based on y/y), but overall improving. However, again…if 55% of the CPI, or 30% + OER, are still inflating faster than 4%…you’re not back to target yet. Far from it.

- That’s enough for today. The summary is that the big surprise was rents, but outside of rents the news wasn’t so wonderful that we can ignore the fact that rents are not decelerating as fast as people expected. I continue to expect core of high 3s, low 4s for 2023. On track.
- Thanks for tuning in. Be safe out there!
I started out with the theme “if not this month, then next month,” but we can dispense with that theme. Although that can be said of Used Cars, and Airfares – both which were lower than I expected – the more accurate theme is the one I started teasing last month: “now it gets harder.”
The lion’s share of the deceleration in core goods is over with. While the dollar’s continued strength will remain a pressure on goods prices, we’re down to zero in a category that even before COVID was only deflating 1-2% per year. And in the post-COVID, de-globalizing world, we are unlikely to see core goods prices sustainably deflating.
The decline in health insurance CPI is over with. Over the last year, that declined almost 4% per month and dragged 4bps per month on core CPI. In the coming 6 months, that is going to be an add of something like 2bps per month. You were sailing with that wind but now the wind is in your face.
Energy prices, a continued drag since the Biden Administration started flushing the SPR, are no longer going to drag. Whether or not gasoline prices rise back to the level they were prior to the SPR releases, they’re not going to be headed much lower especially with war in the Middle East. While the market seems amazingly insouciant about the widening of that war – “hey, neither Israel nor Gaza produce much oil so we good” – this does not feel like prior Israeli-Palestinian conflicts to me. Recent oil inventory numbers have been volatile and confusing, but unless the US recession is sharper or deeper than I (or OPEC) expect the cartel is likely to be able to keep prices high especially in an era when the US is not producing with heartfelt enthusiasm.
Further decelerations in rent are still ahead. But none of my models have primary rents slowing to below 3%, and that’s in contrast to what seems to be a general consensus that rents will outright decline nationally. I don’t see it.
The decline in rents is a big part of why core is down to the low 4%s, and will drop further over the next year even with other things no longer dragging. But again, this is no longer about when the peak in inflation will get here – it’s about where inflation is going to decline to. From 6.6% to 4.1% was the easy part. From 4.1% to 3% is going to be difficult. From 3% to 2%? So far, I don’t see anything that gets us there.
Union Power and Inflation
One of the biggest stories of the past week has been the synchronized strike by the United Auto Workers (UAW) against the Big Three auto makers in Detroit. Although so far only 13,000 workers out of the 146,000 who pledge allegiance to the UAW have struck, the strategy of striking against each of the Big Three at the same time is interesting. In the past, the UAW would choose a particular automaker to strike, win concessions from that company, and then use the new contract as the basis to cudgel the other automakers into a similar deal. This would completely shut down one company, but not the entire country’s car-making capacity. In this case, the UAW is significantly impacting operations at all three while not completely shutting down any of them – although the implicit threat is that they could, at any time, do so.
What is also interesting is that the demands of the union are aggressive, not to say ambitious. The union is asking for a 36% increase in pay, implemented over four years…plus a reduction to a 32-hour work-week while being paid for 40 hours. Combined, those two demands represent a 70% increase in compensation per hour for a union employee (or, put another way, assuming that a car can’t suddenly be made with 20% less labor, it means the cost of labor going into the vehicle will increase 70%). Additionally, they want a restoration of defined-benefit pension plans and contracted cost-of-living adjustments, which isn’t included in that 70% figure.
Whether or not the union is able to get a sizeable portion of its demands (so far, the auto companies have offered 20% over four years, but the other components of the deal are at least as important), this clearly stands out as one of the most audacious labor asks of the last quarter-century. The timing should not be surprising. Historically, union size and activism is positively related to the level of inflation (see chart, source BLS).

You might think that unions also strengthen when unemployment is high. This is not as true as you would think: when unemployment is high, the union would be asking a company to deliver jobs even though there is no work to be done and the company’s viability may be threatened by a weak economy. Consequently, union actions in a recession tend to be less vigorous (the UAW in fact points out that they made concessions in the Global Financial Crisis to help keep automakers afloat), and unionization is less valuable to the workers in those cases. But in inflation, the union is asking the company to give more to the workers it has and needs, out of its growing revenues and profits (even though those revenues and profits look less impressive, and may even be shrinking, after inflation). Moreover, while unemployment hurts the workers who are unemployed (and unable to pay union dues, also), inflation hurts all workers. Consequently, it is inflation and not unemployment that energizes unions.
Naturally, this is part of the feedback loop that concerns policymakers. When I talk about the wage-price feedback loop, I’m generally talking about how it manifests in core services ex-shelter (“supercore”), where a large part of the cost of the product is labor. In the case of a car, labor is only about 15% – although the exact figure depends who you ask and whether you’re asking about the percentage of cost or the percentage of price. So a 70% increase in that cost would “only” add about 10% to the cost/price of a new car whereas a 70% increase in the cost of an accountant would raise the cost of getting your taxes done by something pretty close to 70%. However, union power has its own momentum, and it manifests in things like (for example) automatic cost-of-living adjustments and persistent pressure on fringe benefits and pensions from a union whose influence in this sort of environment is growing.
That’s not to say that it’s good or bad – but this is another cost of letting the short-term inflation spike linger on by not addressing it by aggressively shrinking the balance sheet early on. The longer inflation stays higher, the more power unions have. And the more power unions have, the more momentum inflation has.
Summary of My Post-CPI Tweets (August 2023)
Below is a summary of my post-CPI tweets. You can (and should!) follow me @inflation_guy. Sign up for email updates to my occasional articles here. Individual and institutional investors, issuers and risk managers with interests in this area be sure to stop by Enduring Investments! Check out the Inflation Guy podcast!
- Welcome to the #CPI #inflation walkup for September (August’s figure).
- At 8:30ET, when the data drops, I will pull down the data and then run a bunch of charts. I think I’ve figured out how to autopost these again, fingers crossed. Then I’ll comment and post some more charts.
- Later, I will post a summary of these tweets at https://inflationguy.blog and then podcast a summary at inflationguy.podbean.com . Thanks again for subscribing!
- This month, after some low prints recently, we’re going to get some higher ones. Not terrible like last year, mind you, but higher. The economist consensus…which I’m again closer to than the swap market estimate…is for a high 0.2% on core and a low 0.6% on headline.

- That will raise y/y headline and drop y/y core (all the way to 4.3%!). Core should also fall again next month due to a harsh comp from Sep 2022. After that, progress will be slower. If there’s progress.
- The last couple of prints have been very low: core of +0.16% in both June and July. These were due to non-repeatable things, and I’ll talk about some of them in a bit.
- But the point is that we’ve gotten most of the positive surprises for a while I think (although I guess that’s the nature of surprises!)
- A positive (drag) today, and ongoing for a while, will be the deceleration in rents. Last month Primary Rents were +0.42% and OER was +0.49%. I am penciling the combined ‘rent of shelter’ in for +0.41% this month. That might be aggressive. But it will keep slowing for a while.
- But there are a few things that are going to be reversing soon. One is health insurance. I wrote about this recently https://shorturl.at/agtCX . It will still drag today but that will reverse in October.
- Used Cars is a little indeterminate. I would have thought it was overdone on the downside but am less sure of that now. Here’s why:
- Black book implies continued downward pressure on used car prices. This is partly because auto finance companies have really jerked back on lending, sharply raising rates along with their cost of funding and actually checking credit occasionally.
- The rates make sense but the rationing not so much – delinquency rates have risen from the 2021 covid-funding inspired lows but are still at normal rates. Anyway the result has been downard pressure on used car prices.

- The rate effect is what people had been expecting from housing – the difference between a 5% car loan and a 0% car loan for 7 years is about 13% higher cost for the non-cash buyer so a budget-conscious buyer lowers his price somewhat as a result. Hasn’t happened in housing.
- But in housing the seller also has a loan with value and so is reluctant to sell at a lower price AND lose the low rate. That symmetry doesn’t exist in autos. I suspect that’s why used car prices have fallen farther than I expected (and I should have seen that).
- The Fed though is done (at worse, ALMOST done), and rates will level off for car loans. So this downward pressure will eventually ebb. And they should end up adjusting to a higher overall price level.
- Used cars will still be a drag today (I have a -3.5% fall in used cars penciled in), but that too should ebb soon.
- The real mystery from last month was airfares. That has been down >8% two months in a row, and the current level is about 15% too low for the level of jet fuel (which is rising).

- Do airfares recover 3%? 8%? 15%? I’m wild-guessing 6% but every 1% is worth 3/4 of 1bp on the core m/m. So I’m projecting it to add 4bps, basically. This is a big source of uncertainty, but mostly on the upside, this month.
- Now, we should also recognize that last month’s CPI was also pretty BROADLY low, which meant that median CPI also printed low.
- That would be wonderful if it happened again (but it’s unlikely). Indeed, between higher headline, core, and median, it will be very easy for some people to get carried away with negativity.
- But still, we’re talk ing about 0.23% on core, maybe rounding up to 0.3% if we get stuff a little high. That’s settling in towards the high-3s, low-4s, which is where I think we are going. But watch the breadth, and median.
- The markets, on net, have done almost nothing this last month. Real yields and nominal yields went up a touch, but longer breakevens and swaps are almost exactly unchanged. Shorter breakevens are wider on the strength in gasoline.

- I think markets recognize that the narrative is turning, from “we are in an inflationary spiral” to “inflation is coming down” to “okay now it gets harder.” And that leaves breakevens a bit aimless for now.
- I do think breakevens are too low!
- Energy is back rising, and this time there’s nothing left in the SPR to hold down gasoline prices. Government deficits are ballooning again, partly because interest costs are skyrocketing.
- Navigation from here, both macroeconomically and in a trading sense, starts to get difficult again. Good luck out there today!
- A bit on the high side. Core 0.278 to three decimals. Working on downloading data now.
- As I said, core was a little higher than expected, but still at the low end of what we’d seen for the prior year.

- CPI for Used Cars and Trucks was -1.23%, less than I expected. Airfares were +4.89% (I had +6%), so in the ballpark.
- M/M, Y/Y, and prior Y/Y for 8 major subgroups

- Core Goods: 0.234% y/y Core Services: 5.9% y/y

- Primary Rents: 7.76% y/y OER: 7.32% y/y

- Further: Primary Rents 0.48% M/M, 7.76% Y/Y (8.03% last) OER 0.38% M/M, 7.32% Y/Y (7.66% last) Lodging Away From Home -3% M/M, 3% Y/Y (6% last)
- Some ‘COVID’ Categories: Airfares 4.89% M/M (-8.09% Last) Lodging Away from Home -2.97% M/M (-0.34% Last) Used Cars/Trucks -1.23% M/M (-1.34% Last) New Cars/Trucks 0.27% M/M (-0.08% Last)
- A little surprising that we aren’t seeing the same effect on New Cars (loan interest rate effect) that we are on used cars.
- Here is my early and automated guess at Median CPI for this month: 0.328%

- OK, this is what I expected. The broad everything-was-soft month was a one-off. Median is still slowwwwwly decelerating, but not collapsing like it appeared.
- Piece 1: Food & Energy: 1% y/y

- The energy story is known – OPEC is cutting supplies in anticipation of weak growth, but so far the main economic driver globally (the US) isn’t having the weak growth. And supplies are low. So headline was bubbly and will probably get more of that next month.
- Piece 2: Core Commodities: 0.234% y/y

- Core Commodities driven lower this month partly by Used Cars of course. But it’s going to be challenging to push it a lot lower. That said, the strength of the USD is putting constant pressure in the traditional way here – but nearshoring is still going to make this sticky.
- Piece 3: Core Services less Rent of Shelter: 3.88% y/y

- This is a little interesting…it’s just a little hook to the upside, but remember one of the big downward pressures here is Health Insurance and that’s due to reverse soon.
- But the other big input is wages, and labor’s recent muscularity along with increases in minimum wage in California is going to keep this from decelerating as much as it ‘needs’ to.
- Piece 4: Rent of Shelter: 7.33% y/y

- This is going to keep decelerating. But not back to zero!
- I had penciled in Rent of Shelter as +0.41%. OER slowed to +0.38% m/m, while Primary Rents (about 1/3 of the impact) was faster this month at +0.49%. But ‘Lodging Away from Home’ dropped about 3%, and that’s why Rent of Shelter was so soft. This should rebound next month.

- Interesting and important dichotomy continues: Food at Home was +0.09% (NSA); Food Away from Home was +0.34% (NSA). The latter is wages. Keep an eye on that.
- Medicinal Drugs was +0.61%m/m. Series obviously bounces around a lot but to my eye it’s creeping higher. I remember in 2020 and 2021 it was confounding that with COVID, there was downward pressure here. Looks like that’s ebbed.

- Doctors’ Services was +0.11% m/m, and remains sort of soft. But Hospital Services (2.3% of CPI) was +0.67% m/m. It had been one of the soft categories last month at -0.44%.
- Lodging Away from Home, as I’d mentioned, dragged down the overall Rent of Shelter. But it’s at the low end of its monthly range of wiggles and will probably add next month rather than subtract.

- Worth pointing out because it’s been in the news. Motor Vehicle Insurance, which is 1.7% of CPI – has been steadily increasing. Causes are higher car prices, and big increases in carjackings as well as some natural disaster losses. This doesn’t look like it’s going away. (charts show m/m and y/y)


- Core ex-housing is down to 2.36% y/y. This sounds low, but prior to COVID it hadn’t been over 2% since 2012. As noted earlier, core goods has squeezed out most good news already and core services – outside of housing – still faces wages growing faster than 5%.
- The biggest-losers list (annualized monthly figures) among core categories is led by Lodging Away from Home (-30%), Misc Personal Goods (-25%), Infants/Toddlers’ Apparel (-20%), and Used Cars/Trucks (-14%).
- Biggest gainers are Public Transportation (+58%), Motor Vehicle Insurance (+33%), Car/Truck Rental (+17%), Footwear (+15%), Car Maintenance/Repair (+14%), Misc Personal Services (+12%).
- The dispersion stuff is actually decent news. Broadly, things are slowing down. That doesn’t mean we are going back to 2% inflation; in fact there are very few signs of that yet. But it does mean that the broad upthrust in the price level is ebbing.

- It would be nice to go back to worrying mainly about relative price changes instead of absolute price-level changes. We aren’t there yet. The volatility of prices, and some of the broad pressures like trade and wages, remind us that we are still in the inflation episode.
- This only FEELS like inflation is low, because we saw what high feels like. But 4% core/median inflation is no picnic. And it will keep correlations elevated.
- Last chart. Here is the weight of categories inflating faster than 4%. Obviously we are getting close to 4% being the median. Now, about a third of the basket is housing so that third is in the >4% category. But if we flip and look at <2%, it’s still not back to the old normal.

- …implication being the same as with the diffusion index, volatility, and correlations – we are on the right path, but not there yet.
- NOW – that does NOT mean that the Fed needs to keep raising rates. That’s fairly ineffective anyway although it looks meaningful in used cars. That’s not the issue though. What the Fed should, and probably will do, is just keep rates steady here. And I think they will.
- The real problem comes later: with burgeoning deficits and upward pressure on long rates (I worried about this here: https://inflationguy.blog/2023/08/02/three-colliding-macro-trends/ ), at some point the Fed is going to be under pressure to start buying Treasuries again.
- That’s a bad path, but it’s going to be hard to resist.
- That’s all for today. Thanks for tuning in! I’ll have the summary posted to the blog in an hour or two, and then the podcast later today. Have a good day.
The CPI number this month delivered broadly as expected (and, as expected, broadly). Used Cars continued to slide, and airfares did not repeat the -8% again. The surprise drop in Lodging Away from Home will likely reverse next month, and airfares will be another add. While Used Cars will remain soggy, we only have one more month of Health Insurance drag of 4bps/month before that reverses.
The upshot is that the balance of this year will likely see more 0.3s for the most part, with some high 0.2s (meaning that it rounds down). The easy lifting on core has been done. Due to base effects core will still drop next month, but after that…it is going to get difficult. Decelerating housing inflation will be a persistent following wind, but all of the other things that were rowing in one direction while housing was rising…are about to be rowing in the other direction. And housing’s drag is already reversing. (If you were looking 12 months ahead at the possible future declines in rents, to be fair you should be looking now at 12 months ahead when we’re going to start to see percolating through the re-acceleration that we’re seeing in spot rents and home prices.
There is no need for the Fed to tighten further. Rate hikes don’t really help very much (except in some categories like used cars!) to restrain inflation, and short rates are a bit above normal. But as noted in the tweet stream, we are converging on what will be a more difficult path to navigate. The Fed made a mistake and overdid the COVID response, and then held it too long. It deserves credit, on the other hand, for pivoting and throwing off the dovish history of the last two decades to begin shrinking the balance sheet and for being steady on that path even as the rate hikes cease. But those were, or should have been, easy decisions from the monetary policy standpoint as the central bank was leaning into the prevailing wind by pursuing restraint when the economy was robust.
Before too long, the Fed is going to face a circumstance where restraint remains necessary because inflation is sticky at too high a level, but longer-term interest rates begin to tick higher. This will put pressure on economic growth, and on the budget deficit, so that their restraint will be seen as wrong-headed. That’s the danger zone, and I think it probably is a 2024 problem. My fear is that it will be very difficult for the Fed to not give in, arguing to itself that “hey, slower growth means lower inflation” even though there’s no evidence for that, outside of energy, and start to temper its hawkish stance.
That would be a big mistake. But it’s probably next year’s mistake. For now, we can sit back and watch the core and median inflation numbers come down. Not as fast as people will be expecting, but the direction is right.
Summary of My Post-CPI Tweets (July 2023)
Below is a summary of my post-CPI tweets. You can (and should!) follow me @inflation_guy. Sign up for email updates to my occasional articles here. Individual and institutional investors, issuers and risk managers with interests in this area be sure to stop by Enduring Investments! Check out the Inflation Guy podcast!
- Welcome to the #CPI #inflation walkup for August (July’s figure).
- At 8:30ET, when the data drops, I will run a bunch of charts. Because Twitter has made auto-posting them difficult /impossible, I’ll post those charts manually with commentary as I go. Then I’ll run some other charts.
- Later, I will post a summary of these tweets at https://inflationguy.blog and then podcast a summary at https://inflationguy.podbean.com. Thanks again for subscribing!
- Get ready: today will be a low number, and good news. But it’s about as good as the news is going to get. Y/y core will decline again next month, but the monthlies won’t keep improving.

- This month, the forecasts get a large drag from Used Cars. And in fact, Used Cars creates downside risk to these numbers – it has surprised significantly on the high side for multiple months. If there’s payback, it could be a LARGE miss.
- The y/y figures for used cars have been in line with y/y figures from Black Book, so it’s possible that the recent misses have just been because of some odd seasonal quirk.
- If so, then no payback is necessary and we’ll get something like -2.5% (my forecast), plus or minus a couple of tenths. (That’s somewhat joking since this series is very volatile).
- I actually wrote a column (on the blog) about the volatility of these various series. While everyone thinks inflation is going to drop swiftly back to earth, the volatility of the numbers hasn’t done so. And that’s a tell.
- This is rolling 12-month volatility on used car CPI. The picture looks similar for lots of subcategories.

- The basic idea is that if everything was returning to normal in terms of the trend inflation level and the placid behavior of it…then we’d also see the VOLATILITY of inflation plunging back to normal. Not yet.
- Looking back at those forecasts, I should point out that I’m again (and annoyingly) right about where the consensus of economists is. Kalshi is lower, though it has been trending higher. Again, I do think there is downside risk to this figure.
- OER and Primary rents I have penciled in at +0.43%, sequentially slower from +0.45% last month. There is further slowdown coming, but we aren’t going to zero as NTRR and other models are predicting.
- I really like our new model, which is not just functionally a lag of property prices (which drives most models) or a straight lag of less-accurate (but current) rent figures. I write about the model in this quarter’s Quarterly Inflation Outlook (due out Monday).

- Because a lot of the drag this month is going to be from Used Cars, and we collectively feel pretty confident about that, it’s going to be critical to look at Median. Last month it was 0.36%, and the last several have been much better than those from the prior year.
- So again, all of this is good news. But we are using up a lot of the good news, and while everyone will extrapolate today’s CPI if it’s good news be careful about that.
- This month will also gets flattered on the headline from declines in piped gas, and the rise in gasoline won’t hit until next month. Oh, and gas is rebounding too.
- In the big picture, ‘supercore’ (core services less rents) is still the main category of interest, knowing though that it’s dampened by Health Insurance.
- Along those lines…the large rise in UPS compensation is emblematic of the new muscle of labor and a reminder that the wage-supercore feedback loop is still operating.
- Again, don’t get too excited by today’s good news! The big picture is: money stock contacting, but money velocity recovering (fastest 3q rise ever). Core goods down and dollar strong.
- But government deficits are rising again, partly because interest costs are skyrocketing. This federal dissaving isn’t seeing offsetting domestic (or international) saving. So expect more pressure on interest rates. And it sets up a future dilemma for the Fed.
- We aren’t out of the woods yet. I think inflation is going to ebb to the high 3s/low 4s on median CPI, but then get pretty sticky. And the next upthrust in inflation will start from a much higher level than before.
- But that’s all far away. In the meantime, inflation markets have been relatively calm with breakevens up a little bit over the last month and real yields hovering just below 2%.

- It would be a great place to have the market find balance, around long-term fair value on real yields. But…inflation volatility suggests it’s far too early to declare victory on inflation for all time.
- Good luck out there!
- OK, 0.167% on core. Numbers still coming in, waiting to see how much was Used Cars. Rents were behaved.
- Sorry, that was 0.160% on core. 0.167% was SA headline.
- Used cars was -1.34% m/m, so about half of what I expected and the general consensus. So what dragged?
- Charts will follow in a few. OER was +0.49%, a bit higher than I expected; Primary rents +0.42%. Lodging Away from Home -0.34%.
- Wow, another huge drop from airfares. Remember last month’s -8.11% drop was almost unprecedented? Well, we got a second month of the same. That seems implausible. Not sure what’s happening there!
- Core goods, thanks to Used Cars mainly, dropped to +0.80% y/y. Core services is still high, but fell from +6.2% to +6.1% y/y.
- The diffusion things will look interesting. Of the 8 major subcategories, Housing was +0.35% m/m but no other category was higher than +0.23% m/m (and that was food). Next highest was recreation at +0.12%.
- Not my normal first chart but here is y/y CPI for pharma. It was +0.58% m/m.

- OK folks – here’s m/m core CPI. As I said, don’t get used to this low level. But it sure LOOKS like we’ve gone back exactly to 2% and stuck the landing!

- Here are the 8 major subgroups I mentioned. Very tame m/m.

- Now THIS is the big chart. This is Median CPI. I want to look at the subcomponents – Other Food at Home was the median category. This is the best news in the report.

- Here is the rent chart. Our model has them going to ~3% over the next year. Unless core goods keeps dropping (which means the dollar continues to rally) it’ll be hard to get inflation back to 2% if housing is at 3%. Only reason it happened before was core goods deflation.

- To that point, core goods needs to go negative if you want to get back to 2%. And I think even then it’s difficult unless wages crash back down. No sign of that at the moment.

- Four pieces. The interesting bit is that core services ex-rents actually rose slightly y/y.


- More on Median. It clocks in at +0.19%. Amazingly, that’s despite all of the OER subcomponents being higher than that. Usually to get a low number you need at least one of the big-weight pieces to be there.
- But in this case, we had Recreation, Medical Care Services, New Vehicles, Housing Furnishings and Operations, all 4% or higher weights and all less than 1.5% annualized m/m.
- That starts to look a little quirky. If even one of the 1% categories had been higher then the median category would have been Fresh Fruits and Vegetables and the m/m would have been 0.29%. Still low but not the number we will see.
- I’ll have the diffusion charts in a minute and those are interesting. So, low core and median – you’d think a lot of really low categories right? But only ones below -10% annualized were Public Transportation (-54%, flag that!), Used Cars/Trucks (-15%), and Misc Pers Goods (-11%)
- On the high side we had Motor Vehicle Maint/Repair (+13%), Infants’/Toddlers’ Apparel (+17%), Motor Vehicle Insurance (+27%), plus a couple of non-core categories.
- But there were a LOT between -10% and +1.4% annualized.
- Core ex-shelter fell to 2.62% from 2.80%. It was lower in early 2021 but this is improvement obviously.
- as I said the airfares piece is really odd. Never have had 2 back to back months like that EXCEPT at start of pandemic and that was with jet fuel prices plunging. They’re not. This is…hard to believe. It’s a one-off last month I said we could be sure we wouldn’t get again! [First chart is m/m, second is y/y.]


- You really can go either way on this number. Here is the Enduring Investments Inflation Diffusion Index. The disinflation is continuing, and that’s good news. OTOH, we have some really crazy outliers like airfares.

- Here’s where CPI Airfare sits relative to jet fuel (seasonally adjusted). We are likely to see a catch-up in this next month. I am really curious which routes are getting lots cheaper. I haven’t seen it.

- Now, maybe airfares is a micro effect here that indicates a softening in travel and an early warning of decreased consumer spending. Maybe it’s a bullwhip – after “revenge travel” everyone is going back to normal travel demand. Still, betcha we don’t get another -8% next month.
- OK last chart. This is y/y but it looks similar m/m. The high bars on the right are shelter and they’re moving left. Few huge outliers on the right. Then lots of little categories strung out between 3 and 7%. Then about 22% less than 2% including 17% in outright deflation.

- The outright deflation ones are mostly core goods, and they’re not generally going to stay there. So what we are going to see over next year is all of these things starting to trend back towards the middle. Where’s the middle? I think it’s high 3s, low 4s. But that’s the question.
- Bottom line here. Overall number pretty close to expectations. There is nothing here that would argue that the Fed ought to keep raising rates – inflation is drifting lower, and nothing they can do will speed that up.
- Indeed, nothing the Fed has done so far has caused this, except inasmuch as higher rates helps the dollar which helps core goods to decline. Now…the Fed also oughtn’t ease any time soon. There’s no sign of deflation here or even stable sub-2% inflation.
- Ergo, I think we are going to see the Fed basically go to sleep here for a while, unless the bond market starts to get sloppy because of the huge demand from Treasury. If the Fed needs to intervene and buy bonds…that will be a very bad sign. But not going to happen today!
- Thanks for tuning in.
We knew going in that this would be a soft number, and that it also would likely be the softest in a while. We didn’t get as much of a drag from used cars as we expected, but we got some; the real culprit was the large drag from airfares. It’s hard to understand that one, but especially with jet fuel prices back on the rise we are going to get a give-back from that next month in all likelihood. Indeed, the August CPI is shaping up to be sobering. Core should be above 0.3% m/m again, and headline is currently tracking at 0.65% or so on a seasonally-adjusted basis. So store the party hats for now.
That said, it was encouraging to see so many categories with small changes on the month. There were enough changes that median inflation is going to print very low, 0.19% or so, this month. If that were to recur it would be a great sign. Alas, it’s very unlikely that we will see another median like that very soon. As it was, it was almost an 0.29% as the next category above the median one was that much stronger.
From a market perspective, this is positive. That’s partly because “the market” tends not to look ahead very much (yeah, I know you learned something different in school but “the market,” especially in a day dominated by mechanical trading based on parsing the news headlines, does not discount the future very well any more. That’s one reason why we keep having periodic mini crashes when reality abruptly intrudes). This inflation number gives no real reason for the Fed to hike rates again. As it was, the argument for another 25bps after 500bps have been done was always very weak, especially since there is no real evidence that interest rate hikes do very much to inflation. At some point, the beatings get to be gratuitous and sadistic.
The problem is that there is going to be pressure on longer-term interest rates given what’s happening with the budget. I’m watching that carefully. As I write this, 10-year interest rates are back above 4%. With data like this, that doesn’t make a lot of sense. But there’s a lot of paper out there and it may need higher rates to find its “forever home.”
So, enjoy this print. It’s legitimately positive news. Only the folks looking ahead to next month ought to be less cheerful but in the meantime eat, drink, be merry, and buy stonks.*
* This is tongue-in-cheek naturally.
Enough with Interest Rates Already
One of the things which alternately frustrates me and fascinates me is the mythology surrounding the idea that the central bank can address inflation by manipulating the price of money, even if it ignores the quantity of money.
I say “mythology” because there is virtually no empirical support for this notion, and the theoretical support for it depends on a model of flows in the economy that seem contrary to how the economy actually works. The idea, coarsely, is that by making money more dear the central bank will make it harder for businesses to borrow and invest, and for consumers to borrow and spend; therefore growth will slow. This seems to be a reasonable description of how the world works. But this then gets tied into inflation by appealing to the idea that lower aggregate demand should lower price pressures, leading to lower inflation. The models are very clear on this point: lower growth causes less inflation and more growth causes more inflation. The fact that this doesn’t appear to be the case in practice seems not to have lessened the fervor of policymakers for this framework. This is the frustrating part – especially since there is a viable alternative framework which seems to actually describe how the world works in practice, and that is monetarism.
The fascinating part are the incredibly short memories that policymakers enjoy when it comes to pursuing new policy using their preferred framework. Here’s the simplest of examples: from December 2008 until December 2019, the Fed Funds target rate spent 65% of the time pinned at 0.25%. The average Fed funds rate over that period was 0.69%. During that period, core inflation ranged from a low of 0.6% in 2010 to a high of 2.4%, hitting either 2.3% or 2.4% in 2012, 2016, 2017, 2018, and 2019. That 0.6% was an aberration – fully 86% of the time over that 11 years, core inflation was between 1.5% and 2.4%. Ergo, it seems reasonable to point out that ultra–low interest rates did not seem to cause higher inflation. If that is our most-recent experience, then why would the Fed now be aggressively pursuing a theory that depends on the idea that high interest rates will cause lower inflation? The most-recent evidence we have is that interest rates do not seem to affect inflation.
This isn’t just a recent phenomenon. But the nice thing about the post-GFC period is that for a good part of it, the Fed was ignoring bank reserves and the money supply and effecting policy entirely through interest rates (well, occasionally squirting some QE around, but if anything that should have increased inflation – it certainly didn’t dampen the effect of low interest rates). This became explicit in 2014 when Joseph Gagnon and Brian Sack, shortly after leaving the Fed themselves, published “Monetary Policy with Abundant Liquidity: A New Operating Framework for the Federal Reserve.” In this piece, they argued that the Fed should ignore the quantity of reserves in the system, and simply change interest rates that it pays on reserves generated by its open market operations. The fundamental idea is that interest rates matter, and money does not, and the Fed dutifully has followed that framework ever since. As I just noted, though, the results of that experiment would seem to indicate that low interest rates, anyway, don’t seem to have the effect that would be predicted (and which effect is necessary if the policy is to be meaningful).
And really, this shouldn’t be a surprise because for the prior three decades, the level of the real policy rate (adjusting the nominal rate here by core CPI, not headline) has been completely unrelated to the subsequent change in core inflation.

So, to sum up: for at least 40 years, the level of real policy rates has had no discernable effect on changes in the level of inflation. And yet, current central bank dogma is that rates are the only thing that matters.
I stopped the chart in 2014 because that’s when the Gagnon/Sack experiment began, but it doesn’t really change anything to extend it to the current day. Actually, all you get is a massive acceleration and deceleration in core inflation that all happened before any interest rate changes affected growth (seeing as how we have not yet had a recession). So it’s a result-within-a-result, in fact.
Any observation about how the Fed manages the price of money rather than its quantity would not be complete without pointing out that the St. Louis Federal Reserve’s economist emeritus Daniel L Thorton, one of the last known monetarists at the Fed until his retirement, wrote a paper in 2012 entitled “Monetary Policy: Why Money Matters and Interest Rates Don’t” [emphasis in the original title]. In this well-argued, landmark, iconic, and totally ignored paper Dr. Thornton argued that the central bank should focus almost entirely on the quantity of money, and not its price. Naturally, this is concordant with my own view, plus more than a century of evidence around the world that the price level is closely tied to the quantity of money.
To be fair, the connection of changes in M2 to changes in the price level has also been weak since the mid-1990s, for reasons I’ve discussed at length elsewhere. But at least money has a history of being related to inflation, whereas interest rates do not (except as a result of inflation, rather than as a cause of them); moreover, we can rehabilitate money by separately modeling money velocity.
There does not appear to be any way to rehabilitate interest rate policy as a tool for addressing inflation. It hasn’t worked, it isn’t working, and it won’t work.
Summary of My Post-CPI Tweets (May 2023)
Below is a summary of my post-CPI tweets. You can (and should!) follow me @inflation_guy, but subscribers to @InflGuyPlus get the tweets in real time and a conference call wrapping it all up by about the time the stock market opens. Subscribe by going to the shop at https://inflationguy.blog/shop/ , where you can also subscribe to the Enduring Investments Quarterly Inflation Outlook. Sign up for email updates to my occasional articles here. Individual and institutional investors, issuers and risk managers with interests in this area be sure to stop by Enduring Investments! Check out the Inflation Guy podcast!
- Welcome to the #CPI #inflation walkup for June (May’s figure).
- A reminder: At 8:30ET, when the data drops, I will post a number of charts and numbers, in fairly rapid-fire succession. Then I will retweet some of those charts with comments attached. Then I’ll run some other charts.
- This month I have to skip the conference call because my daughter has an awards ceremony I need to make. But later in the morning, I will post a summary of these tweets at https://inflationguy.blog and then podcast a summary at http://inflationguy.podbean.com .
- Thanks again for subscribing!
- Although both nominal and real interest rates have risen across the board since last month, breakevens have been fairly stable except at the very short end.

- That represents relative weakness in BEI, which at this level of yields should be moving about 67% as much as 10-year nominal ylds and 2x as much as real ylds. Expectations have been declining partly because of weak energy markets, but then why are short breakevens wider?
- In short, market pricing of medium-term inflation seems very confused right now.
- That’s perhaps not so surprising. In addition to energy market softness, you also can see plenty of talk about how ‘wages might not cause inflation’ and how rents are due to decline (“no, really this time!”).
- Let’s tackle these. First, rents. Ongoing argument on this one. Here’s my take: the former surge in rents was partly a catch-up from the eviction moratorium. I highlighted this divergence back when it first happened.

- Now asking rents are declining and effective rents are still rising, beginning to close this gap. But note that the BLS rents figure never did keep pace with the asking OR effective rents.
- The top lines haven’t converged yet (to be sure, these are quarterly figures) and the bottom line is behind. I know that current rent indicators had looked softer – although they’ve been recovering lately – but I don’t see a good reason to expect a LOT of softness here.
- But if you really think that housing and the rental market are going to collapse like in 2009-10, then you’re going to have a hard time buying breakevens very much higher than you were paying in 2010.
- Except wait…in 2010, 10-year breakevens averaged 2.06%. And they’re at 2.19% now. And we don’t seem to be close to any calamity remotely like we saw in 2008-2010.
- I think these days, investors avoid buying breakevens not because they don’t believe there aren’t long tails to the medium-term upside, but because they’re worried about the short-term spikes to the downside. It’s MTM fear, not value, I think.
- So, rents have been a persistent source of strength to CPI. They are ebbing, but not nearly as fast as the consensus thinks. Last month primary rents were +0.54% m/m. This doesn’t seem wildly high to me. The prior month is the outlier so far.
- The other persistent source of strength, ALSO a story I was on a long time ago, is the core-services-ex-rents or “supercore,” which is significant because that’s where wage inflation lives.
- There was an Economic Letter from the FRB San Fran a couple of weeks ago called “How Much Do Labor Costs Drive Inflation.” https://shorturl.at/fsvEN The author concludes that “labor-cost growth has a small effect on nonhousing services inflation…”
- Well, duh. Obviously, inflation causes more-rapid wage growth, not the other way around. Cost-push inflation isn’t real – if it was, every laborer would love inflation because they would be AHEAD of it. That’s clearly wrong.
- So everyone says “wow, this means that supercore doesn’t matter and the Fed might ease.” Except that nothing changes in this argument. Anyone who said core services ex-rents was important because it CAUSED inflation missed the point anyway.
- Core services ex rents matters because it causes inflation PERSISTENCE by feeding back inflation. It makes inflation sticky. It doesn’t cause it to spiral higher.
- Core services ex-rents will remain firm. That’s a good reason the Fed will not ease any time soon.
- Heading into today’s number, both mainstream economists and Kalshi’s markets are looking for core CPI to match or fall short of the lowest core CPI so far in 2023 (0.385%, in March). I am higher. More on that in a second.

- One reason I think core will be a little higher is that used car prices were roughly unchanged, but the seasonal adjustment expects a decline. So I think that will add about 3.5bps to the SA number by itself.
- Interestingly, the lag structure from Black Book to CPI-Used Cars seems to have changed from 1 month to 0 months. That’s why everyone has been off on used cars recently. No idea why this shifted. Maybe it hasn’t, just a weird recent coincidence. But I don’t think so.

- Headline CPI forecasts are pretty close between economists/market/me. I think Food isn’t going to add very much, which is why I’m below the consensus for headline even though above the consensus for core (Deutsche Bank made a similar point in a note out yesterday).
- Now, the interesting thing is that after this month and next month, the interbank market is projecting essentially zero headline inflation for the balance of the year. Ran this chart in my blog at the end of May. https://inflationguy.blog/2023/05/31/is-inflation-dead-again/

- June to December headline inflation is in the market at 0.125%. Total. That seems unlikely, even though the seasonal adjustment factors would turn that into a +1.4% which isn’t terrible. Still, it is hard to fathom that prices are just going to freeze in place NSA.
- Not today’s problem, however! One step at a time. Good luck. I’ll be up with charts and chats right after 8:30ET.
- Core +0.44%…worse than expected.
- Both stocks and bonds acting like this is good news, so we’ll have to see the breakdown…
- It might take people a minute to figure out that this was a solid miss on core. Yes, it was 0.4% versus 0.4% expectations, but it was just barely rounded down to 0.4% while the forecasts (except for mine) were rounded up.
- Still pulling down data…the BLS is working very hard to make sure people can’t get it quickly. I can see that Used Cars was +4.4% m/m, which was more than I expected. Core Services jumped to 6.8% y/y versus 6.6%. OER was steady at 0.52% m/m; Primary at 0.49%.
- Lodging was +1.80% m/m; but airfares -2.95% m/m (weak again…I just don’t see it!).
- Energy dragged about 9bps on the headline, which was in line with my forecast. Food was +0.21% NSA m/m, about same as last month, but that’s a higher SA contribution. Food at home was +0.05% SA; Food away from home (wages y’all) was +0.47% SA. m/m
- m/m CPI: 0.124% m/m Core CPI: 0.436%
- Consensus missed on core by almost 6bps. My forecast was 0.43%. Headline was soft relative to core.

- Last 12 core CPI figures
- There is absolutely nothing disinflationary about this chart recently. Haven’t even rounded down to 0.3% on core in 6 months.

- M/M, Y/Y, and prior Y/Y for 8 major subgroups
- “Other goods and services” bears some looking into. Otherwise no large surprises.

- Core Goods: 2.03% y/y Core Services: 6.57% y/y
- Core goods maintained its prior y/y level but didn’t extend the bounce despite a nice rise in apparel. Core services is coming off but…not exactly dramatically!

- Primary Rents: 8.66% y/y OER: 8.05% y/y
- Is this the top of the rollercoaster, and how steep is the drop? Yes is the first answer, but ‘not so steep’ is what I think we’ll conclude on the second. M/M annualized are running at 6% or so, and I think we’ll probably end up between 5-6%. Much better than now, but not great.
- Further: Primary Rents 0.49% M/M, 8.66% Y/Y (8.8% last) OER 0.52% M/M, 8.05% Y/Y (8.12% last) Lodging Away From Home 1.8% M/M, 3.4% Y/Y (3.3% last)
- …by the way, the reason is higher taxes, higher wages, short supply.
- Some ‘COVID’ Categories: Airfares -2.95% M/M (-2.55% Last) Lodging Away from Home 1.8% M/M (-2.96% Last) Used Cars/Trucks 4.42% M/M (4.45% Last) New Cars/Trucks -0.12% M/M (-0.22% Last)
- I thought Used would contribute but it was heavier than I thought. New cars being down is surprising. Interesting that core goods was still flat even after this contribution and the contribution from apparel.

- Here is my early and automated guess at Median CPI for this month: 0.427%
- Median category by my calculation was West Urban OER, so the usual caveats apply about my seasonal adjustment. Might be a bit higher or a bit lower than this, couple of bps either way. However you look at it…no continued disinflation.

- Piece 1: Food & Energy: -0.939% y/y

- Piece 2: Core Commodities: 2.03% y/y

- Piece 3: Core Services less Rent of Shelter: 4.38% y/y
- “Supercore” was a little lower, but still at 4.4% y/y.

- Piece 4: Rent of Shelter: 8.12% y/y

- Probably the best news overall is that core ex-housing is down to 3.45% y/y.
- Before I get to ‘other’, let’s look at Medical Care. 0.08% m/m. Pharma was +0.51%, and 3.99% y/y. Doctors’ Services was a drag at -0.50% m/m and -0.09% y/y. Medical Equipment and Supplies was +2.3% m/m (NSA), which is the reason this is positive. Health insurance the usual drag.
- Keep in mind that when Health Insurance gets readjusted next year, Medical Care is going to turn on a dime and be a following wind pushing inflation up, not down. The Health Insurance curiosity is a major source of the apparent core inflation disinflation this year.
- Other Goods and Services was +0.53% NSA M/M. And it was pretty broad. Cigarettes +0.6%, other tobacco products 0.44%, Personal care products +1%, Misc Personal Services +0.69%.

- This is interesting. Really bipolar inflation distribution. Nothing in the middle. A lot of weight to the right, and then a big slug of things to the left. That’s why core is so much lower than median.
- Only non-core things that declined more than 10% annualized in May were Car and Truck Rental (-33%) and Misc Personal Goods (-11.9%). Neither more than 0.15% of the consumption basket.
- OVER 10% are Used Cars/Trucks (+68%), Motor Vehicle Insurance (+26%), Lodging Away from Home (+24%), and Personal Care Products (+12.8%).


- Sort of reinforcing the distribution picture. The weight in “over 6% y/y” is declining but still heavy. Weight in <2% is about 25%, rising but still low.

- Finally the EI Inflation Diffusion Index telling the same story. Upward pressures remain but are lessening. This reinforces the ‘inflation has peaked’ story but does not yet support the ‘inflation will crash to exactly 2%’ story.
- Wrapping up: bonds like this because there is no reason in here for the Fed to reverse its promise of a pause, when they meet tomorrow. The Fed will stand pat. Stocks like this mainly because it removes that uncertainty.
- There is nothing in here that supports the notion that the Fed will soon be able to stop worrying about inflation. M/M core inflation continues to run at a 5% ish level. Y/Y core will likely ease a little further on base effects through September and then level off.
- My point forecast for 2023 Median Inflation has been around 5% since last May. It is starting to look like that might be slightly low but pretty decent I think.
- Sort of the best-case for core CPI at year-end will be 4.25% y/y. Unless rents and wages suddenly (and inexplicably) drop, it’s going to be really hard to get it below that.
- On the other hand, tightening further when inflation measures are gently declining will also be a hard argument. In short, I think the “Fed on hold for a long time” argument won the scorecard handily today.
- We not only need lower inflation prints, but the distribution needs to get more uniform. Wages rising at 6% (Cleveland Fed WGT) is holding up services even as core commodities stop declining. Meeting in the middle still looks like 3-4%. Again, hard to ease, hard to tighten.
- I think that’s about it for today. I’ll have a few more words in my blog and podcast summaries, but that’s the meat of it. I still think breakevens are too low for this environment!! Thanks for tuning in.
The chart of the day is the one of month/month core CPI figures. Here is another look at it, from Bloomberg. Tell me if you can spot the downtrend.

Nope, me neither. December’s was 0.40%, and the five core prints for this year were 0.41, 0.45, 0.38, 0.41, and 0.44. The six-month average is 0.42%. The 12-month average is 0.43%. The 24-month average is 0.46%. So, if there’s a downtrend, it’s a really gentle downtrend. Base effects from last year will cause the y/y number to glide down a little bit further, and base effects in headline inflation may cause that number to decline as well although that’s a lot less clear. We’re tracking towards something like 4-5% inflation. I’m a trifle more optimistic than that, thinking we will eventually settle in the 3-4% range, but my operating hypothesis for a while has been that we have entered a new distribution with a higher mean. I could still be wrong on that, of course, but so far there’s nothing to suggest that inflation is going back to 2%.
Unless, of course, you think rents are about to flop. There has been some recent research on that, and as a result there is near-unanimity of the view that rents are going to be flat to declining “soon.” I’ve read the research, and it’s not convincing. Error bars for the forecast period are very wide right up until we get actual data, and the period over which the relationship is purported to exist is not similar to the period we are in.
Remember, people also thought that home prices would collapse under the weight of higher interest rates. They dropped a couple of percent, and are rising again already. Not only that, but mortgage delinquencies just dropped to the lowest level in 20 years: not what you’d expect if higher rates are crushing homeowners. What higher rates are doing is hurting builders, who will build less as a result, and landlords, who will raise rents as a result. The fact that economists want monetary policy and inflation to work this way isn’t sufficient. It just doesn’t.
This is not to say that there aren’t some good trends in the data. Our diffusion index clearly signals that the pressures towards higher prices are slackening. Some products and services that had seen extreme spikes are retracing. But wage growth is still 6%, and there are still a lot of goods and services which haven’t yet fully adjusted to the new price level. So: there will continue to be volatility in prices for a while, with some good news and some bad news and a gentle trend towards less inflation.
Sounds like “Fed on hold” to me.
