Archive
Inflation Guy’s CPI Summary (October 2024)
I said two months ago that I didn’t think the Fed should ease, but they would anyway. And they did, by cutting overnight rates 50bps. Then last month I said “Getting rates back to neutral, around 4% or so, is not a bad idea as long as quantitative tightening continues. It isn’t the best idea, but it’s not a disaster. But this raises the stakes for the next FOMC meeting… I suspect 25bps is the only choice they can make which will make almost everybody equally unhappy. There’s more data to come before that meeting, but the FOMC’s path has narrowed considerably as inflation remains sticky.” And the Fed, on cue, cut rates 25bps.
But the Fed is getting into an uncomfortable position now, because inflation looks like it has leveled off. As I have said for a while it likely would.
We will get to that. First let’s look at the number.
The economists’ consensus has been drifting higher in recent days, as data on used cars was suggesting that component would be an add in October. Consensus going in was for +0.21% headline (SA) and +0.28% on core. The actual numbers were +0.24%/+0.28%, so pretty close to the consensus with y/y headline inflation at 2.58% and y/y core at 3.30%. It doesn’t seem to me, though, that the chart of core CPI for the last year is particularly soothing. More and more it appears that May-June-July were the outliers, and we are hanging out around 0.3% per month on core inflation.


Also, my early estimate for median inflation is 0.296% m/m, leaving y/y basically unchanged at 4.09%.

Used Cars was indeed high, at +2.7% m/m. But the real problem with Used Cars isn’t this month. The real problem is that for two and a half years Used Cars has provided steady disinflation as the COVID spike (caused because new cars were not being produced as quickly thanks to supply chain problems, but the deluge of money meant that people had lots to spend and wanted cars dammit) ebbed…but that game appears to be about over.

So if you want to get inflation lower from here, it’s going to be a challenge to get it from core goods, which was steady y/y at -1% this month but only because Apparel had a large decline. Core goods is likely to head back to small deflation or small inflation (with the dollar’s recent strength, small deflation is the better guess), but higher from here. We have known this for a while. The heavy lifting is going to have to come from shelter, or supercore, going forward.

So as for shelter…OER was +0.33% m/m in September but +0.40% m/m in October. Primary Rents were +0.28% last month and +0.30% this month. The y/y disinflation is continuing, but still no sign of the hard deflation we were promised.

The good news here for 2025 is that if Trump’s plan for mass deportations happens, and if “mass” means millions, then some of the pressure on shelter that developed over the last few years as ten million additional heads needed roofs over them will abate. Then maybe we can get shelter inflation lower. There is a modest additional “if” part, though, and that is “if landlord costs can stop increasing.” Our bottom-up landlord-cost-driven model has primary rents eventually converging just south of 4%. Better, but still not great.

So that leaves supercore, which unfortunately ticked higher this month.

The problem there also remains the same. Stop me if you’ve heard this one, but wages are moving only slowly downward, and supercore is where the wage/price feedback is the strongest. The red line below is Bloomberg’s calculation of supercore and the other line is the Atlanta Fed wage growth tracker. And the problem is that median wages don’t tend to move drastically differently than median inflation, which as we have discussed is proving sticky.

If core goods is no longer declining, and shelter isn’t doing the heavy lifting of deflation, and if core-services-ex-shelter (supercore) is leveling off…then gosh, that looks a lot like high-3s-low-4s village.

As an aside: I have been saying ‘high 3s, low 4s’ would be where inflation settles in…and I’ve been saying that for a couple of years. Even I am a little amazed that I haven’t had to tweak that forecast much, other than to allow that we might briefly dip below that if housing followed the dip-and-bounce that our model had. I don’t want to put on false humility, because I was saying that inflation would stay sticky and too high long before anyone else was saying that, and I had the correct reasons and I think I’ve guided readers and clients well. But getting the landing spot right, that far in advance, also clearly involved some luck. I am saying that partly to keep the Fates on my side. But you should also know that someday, it might turn out that ‘high 3s, low 4s’ needs to be adjusted. And I’ll still consider this a pretty good call!
The Fed’s actions can clearly affect that eventual equilibrium level, but it doesn’t look like they are yet taking this seriously. The game isn’t over and there will be more CPI reports and more after that. But for now, this looks like a policy error – or worse, a blatant attempt to influence the election – and unless something unexpected happens with prices it looks like the Fed is going to have to choose between the right policy move (which means continuing tight policy) that appears to be political, or continuing to loosen policy so as to not appear to be political, and temporarily surrendering on inflation. I suspect that the FOMC will vote to keep rates steady at the next meeting.
By the way, if you care about the crypto space at all and haven’t read my column on stablecoins, you should, and you should be sure to circulate it. The column is here.
Inflation Guy’s CPI Summary (September 2024)
I already have my title for today’s CPI Report podcast (you can find all of my podcasts at https://inflationguy.podbean.com/ ). I’m going to call it ‘Inflation Peek-a-Boo.’ With today’s number being definitely on the ‘boo’ part of things.
First, a review: last month, August’s report missed higher. But the miss was mostly due to the quirky jump in Owners’ Equivalent Rent. Outside of that, CPI had been okay – not great, but moving in the right direction. The Fed eased 50bps anyway (at the time I said the miss in CPI wouldn’t deter that), setting up what will be the headlines for the next week now. Because of the strength in the Employment report, some people were already questioning whether the Federal Reserve made a policy error in starting to move rates back towards neutral so quickly. But as long as inflation was heading back to their target, neutral would still make sense even if the jobs market wasn’t weakening (as it still looks like it is, outside of government spending). The questions now get a little more pointed because today’s CPI miss higher was not due to a one-off.
The consensus of economists coming into today was for a +0.10% rise in the seasonally-adjusted CPI. Now, energy this month was expected to be about a -0.17% drag on the number (it turned out to be 13bps rather than 17bps), so this low m/m print was scheduled to be mostly due to last month’s slide in energy prices. Still, decent optics especially with the last CPI we’ll see before the election. Economists saw +0.24% m/m on core. The actual figures were +0.18% m/m on headline CPI and +0.31% m/m on core CPI. This is unfortunate, because the y/y Core CPI number rose, instead of being flat, to +3.26% y/y. Moreover, the overall shape of the monthlies…well…see for yourself.

We have to be careful about the cognitive bias that makes us see stories and trends where there aren’t any, which is why it’s so very important to not focus on one month’s number. Or two. But if you look at this chart, it sure looks like the outlier might not be August and September, but May and June. Doesn’t it?
Ditto that for the Median CPI (last point estimated by me at +0.33% m/m).

Again, it could be a cognitive error but this sure looks like we’re pretty steady around 0.3%. If sustained, that would be in the ‘high 3s’, and it is time for my monthly reminder that I think median inflation will settle in the ‘high 3s, low 4s’ although it could dip into the low 3s first. (It’s looking more and more like the dip into the low 3s may not happen, as we get further along in the adjustment of rents.)
So where did this high miss come from? It wasn’t from OER and Primary Rents, which were back into their slowly-declining mode. OER was +0.33% m/m, and Primary Rents +0.28% m/m. Year over year, Primary Rents are down to +4.8% y/y. My model has them eventually ending up around 3.8%, after dipping lower. But they should be dipping right now, and they’re not. They may simply be converging on that 3.8%ish level.

But here’s an interesting chart. Remember how I have been saying for a long time that a good part of the overall deceleration in inflation had come from Core Goods, which would not continue to plumb new deflationary depths? This month, Core Goods was only -1.0% y/y, versus -1.9% y/y the last time we got these numbers.

Now, that doesn’t look wildly inflationary but if core goods inflation goes merely back to flat, then core services needs to do a lot more heavy lifting. Core Services did drop to 4.7% y/y from 4.9% y/y. But flat on core goods and 4.5% on core services wouldn’t get us back to the Fed’s target. Not even close.
In the core goods category, there were rises in Used Cars (+0.3% m/m) and New Cars and Trucks (+0.15% m/m), but nothing terribly out-of-the ordinary. Similarly, in core services there wasn’t much out-of-the ordinary. The problem is, ‘ordinary’ looks like it’s not at the Fed’s target. Medical Care Services were higher, with Doctor’s Services +0.9% m/m and Hospital Services +0.57% m/m. Airfares rose +3.16% after +3.86% last month. Motor vehicle insurance continues to rise, +1% m/m, with the only good news being that the y/y figure on insurance is now down to ‘only’ +16%. But +1% per month still is a rate above 12% per year – not too exciting.

Car and truck rental was also +1.2% m/m. So, in transportation outside of the cost of energy itself, it was a rough month (but that’s what happens, I guess, when you try and force people to buy electric cars when they don’t want them). But it wasn’t just transportation goods and services, either. This is the time of year when the jump in college tuitions happens. And it looks like the jump in tuitions this year is the largest since 2018. The seasonally-adjusted numbers will smooth this out, but that means tuition is going to be adding a little more over the next 12 months than it added over the last 12 months.

This is also somewhat surprising. Normally, when asset markets are going gangbusters we tend to see smaller increases in tuition because endowments are doing well and the financial model for colleges is basically (exogenous cost increases we don’t really try to control, minus endowment contributions or federal support, divided by number of students). If markets are doing well and college tuitions are still accelerating, it implies an increase in costs. My guess is that insurance is part of that, but so will be teachers’ salaries. Provision of education is ‘labor intensive,’ and wages continue to refuse to slip back down to the old levels. This is also the reason that Food-Away-From-Home was +0.34% m/m and continues to hang out around +4% per year.

And, as a result of wages refusing to moderate, ‘supercore’ (core services ex-shelter) also continues to refuse to slip back to the old levels.

The bottom line is that this number is not high because of any weird one-offs. In the same way that last month’s number was generally okay in a balanced way, outside of rents, this month’s number is generally less pleasant, in a balanced way. I don’t think we are at the start of another spike higher in prices. But we continue to aim for ‘high 3s, low 4s.’
And this will be an unfortunate story for the Fed as they will be peppered with questions about a potential policy error. I will repeat here what I said last month:
“To be clear, I personally do not think the FOMC should stop quantitative tightening and there’s no hurry to cut rates. The fight against inflation is not only unfinished, it won’t be finished for quite a while…and an ease now will just make it harder later. But that’s what I would do. What I am saying is that the Fed is not likely to change course on the basis of this number.” As expected, the Fed did cut rates 50bps. I am not sure this is necessarily a terrible policy error, although starting with 50bps now looks like an obvious mistake. Getting rates back to neutral, around 4% or so, is not a bad idea as long as quantitative tightening continues. It isn’t the best idea, but it’s not a disaster. But this raises the stakes for the next FOMC meeting. If the Fed skips the meeting, it will be a tacit admission that the first move was a mistake. If the Fed piles on another 50bps, it will show they are terrified about growth or simply don’t care about inflation. I suspect 25bps is the only choice they can make which will make almost everybody equally unhappy. There’s more data to come before that meeting, but the FOMC’s path has narrowed considerably as inflation remains sticky.
Inflation Guy’s CPI Summary (July 2024)
It was only a few months ago (with the March CPI report in April) that I was talking about a ‘Potential Pony Situation’ in my podcast when, after an unsettling Core CPI, I pointed out that the Median CPI was much less disturbing. Trying to tell the story of the economy is about figuring out where the underlying trends are, and trying to figure out what you can ignore as ‘noise.’ Back then, it was clear that inflation was heading lower, but not as fast as people were saying, so the bad core CPI was off-putting. It messed up that story. But because we were focused on Median CPI, that month was not so unsettling and we focused (successfully I think) on the fact that inflation was decelerating…but not collapsing back to target imminently. Fast forward, and the story we are looking at coming into today’s CPI is that inflation is still declining, but people are probably getting a bit out over their skis in anticipating (again) a rapid collapse in inflation after a couple of weak CPI prints. Once again, that’s not the story the data is really telling, but deviations from that belief are likely to be painful.
For what it’s worth – I saw a lot of commentary this morning about how “PPI is encouraging,” or “PPI means this or that.” No one in the inflation trading community cares much about PPI. There are some elements of the PPI report that can help with some of the parts of other inflation reports, but the overall number has very little correlation (and no lead) with the CPI. You and I are exposed to CPI. The Fed looks at consumer prices. My best advice about PPI is to ignore it.
When CPI actually came out, it was a touch better than expected on the surface. Economists had been looking for +0.19% m/m on core, and got +0.155% on the actual number. What was fascinating to me was the market reaction. Equity futures appear to be completely flummoxed by an as-expected number, vacillating around unchanged 20 minutes later as I write this. I think this tells you something, actually – folks coming into today weren’t trading the actual number but rather planning to trade what other people thought about the number. Everyone thought everyone else knew what a higher-than-expected or lower-than-expected number would do. An as-expected print means you have to dig into the details, and equity guys don’t like details. They like big pictures. Thick lines. Crayons.
So let’s look at some pictures. Here are the last 12 core prints and the 8 major subcomponent pieces.


The first thing that jumped out at me was that core goods again plumbed new 20-year lows. Yes, that’s 20-year lows, as the following chart shows. -1.9% y/y.

Folks, I am still waiting for the turn and I say every month “surely, it can’t go lower than that.” So far, so wrong. The dollar is no longer strengthening in a straight line, and hasn’t been for a while. If anything, it’s weakening. Apparel this month was -0.45% m/m, and only 1.1% y/y. Apparel is almost entirely imported, and at some point a steady-to-lower dollar will mean that core goods heads back to flattish. (Also, keep in mind that both Presidential candidates have expressed pro-tariff positions, but that’s a 2025 story at the earliest).
Within Core Goods, we also saw Used Cars decline yet again. This month it was -2.3%. CPI had diverged a bit from the private surveys, but with this month has basically converged back to the number implied by Black Book. That doesn’t mean Used Car prices won’t decline further, but there’s no longer a reason to expect “bonus depreciation” going forward.

Now, in the first chart above note that Core Services dipped to 4.9%, the lowest it has been in a while also. Within core services, we saw Airfares decline again (-1.6% m/m after -5% last month), but the interesting thing is Hospital Services. The other parts of Medical Care, that is Physicians’ Services and Medicinal Drugs, were both in line with recent trends and on top of last month’s figures. Hospital Services plunged -1.1% m/m. The y/y is still pretty high at 6.1%, but if this number is prologue (I sort of doubt it) then this upward pressure will abate.

The fact that services dropped so hard helped to bring “SuperCore” down a little bit. It is still elevated, and frankly the trend doesn’t look wonderful. You want 50bps in September? You need more than this, pal.

Do you know what I haven’t mentioned yet? Shelter. Shelter is the biggest and stickiest piece, and the foreordained deceleration of shelter is part of the religion of everyone who thinks we will decline to 2% core inflation and remain there (which is basically where breakevens are these days). Bad news – this month, Primary Rents rose 0.49% m/m and OER rose 0.36%, compared to 0.26% and 0.28% last month. This is where it’s useful though to look at the y/y numbers. That big surprise in Primary Rents produced an unchanged y/y number and OER still decelerated to 5.30% from 5.45%. The wonder of base effects!

So let’s harken back to the beginning of this piece. In ‘A Potential Pony Situation,’ the Median CPI warned us to not get too worried about the surge in core because Median was pretty well-behaved. In the current circumstance, Median tells us to not get too excited by all of those people who will be talking about how low the 3-month average is (I guarantee that old chestnut will make a reappearance this month), because Median will be something like 0.268% (my early estimate). This will be the highest since April, if I am right.

The bottom line remains the same, and that is that inflation continues to decelerate but median is going to end up in the “high 3s, low 4s.” I keep thinking that we will dip below that for a little while when the base effects of shelter pass through, before reaccelerating to what I think is the new ‘normal’ level, but shelter is being persnickety and resistant to that deceleration. Either way, there is nothing here that would encourage the Fed to aggressively ease 50bps. Or, for that matter, to ease at all. If the Fed eases in September (which I expect, even though if I were a member of the Board I wouldn’t vote for one), it will be because its members fear recession and not because there is evidence that inflation is licked. That evidence is still elusive.
Inflation Guy’s CPI Summary (June 2024)
Let’s set the stage. Last month (May’s data), core CPI printed at +0.16% and +0.25% on Median. But a lot of that, most of it, was core goods and the question was whether that month was a one-off due to be reversed at some point, or if shelter and other slower-moving things would come along. Coming into this month, the economists’ consensus was for +0.21% on core; the inflation swap market trades headline inflation but actually implied something a tiny bit softer than the economists were expecting. We knew Used Cars was going to be weak again, but it seemed like people were all-in on the idea that the worm has turned and now inflation is going to head sharply lower.
Whether this turns out to be true or not, it’s important to realize that the reason economists think that is because unemployment is rising, indicating that we are either in or very near a recession, and economists think (against logic and data) that wages lead prices so this should herald a disinflationary pulse. Now, I also think inflation is headed lower, but it’s because shelter is coming off the boil and not because the Fed successfully cracked the backs of labor.
So what happened this month?
We saw a very weak headline number of -0.06%, which was mainly the fault of a very weak core inflation number of +0.06%. That’s the second quite weak core figure in a row, and when median CPI comes out later today it should be even weaker than last month, at +0.195% or so. If we could repeat that median every month, it would be tantamount to inflation being at the Fed’s target because median normally tracks a little higher than core except when we are in an inflationary upswing.


But whereas last month’s inflation figure was all about core goods, this month we finally saw a bit of a deceleration in shelter. Okay, yes – core goods slipped further into deflation, because that category exists mainly to make me look stupid by going lower and lower when I keep thinking the disinflation must be nearly wrung out. Core Services dropped to 5.1% y/y from 5.3% y/y.

We had known Used Cars would be weak, and it was at -1.5% m/m. New cars also dragged. But I will say it again because I want to have the chance to appear stupid again next month: goods deflation is running its course. Global shipping costs are rising again, the dollar will be vulnerable if the Fed begins to ease, and while used cars should continue to show large y/y declines for the next few months that’s mostly base effects. On an index level, the used cars price index is almost all the way back to the overall price level. Since COVID, the general price level – what has happened to the average price of goods and services – is up 22.3%. Used Car prices are now only up 27.7%. Not all goods and services will move up exactly 22.3%; the point is that the dislocation in used cars is pretty much over and therefore we should expect at some point that used car inflation will start to look more like overall inflation.

But again, goods aren’t the story we really care about. The question is, what about services? The news here is all non-bad. (Some of it is good, some is just not bad.) This month, the story is that rents abruptly weakened on a m/m basis. Primary Rents were +0.26% m/m (was +0.39% last month), and Owners’ Equivalent Rent was +0.28% (was +0.43% last month). This dropped the y/y rates to 5.07% and 5.45%, respectively.


That’s good news, but it is not unexpected news. The conundrum over the last 3-6 months has been why this wasn’t already happening. On a m/m basis, the rent numbers probably won’t get a lot better, but if they print around this level consistently then the y/y rent numbers will decelerate gradually. Unfortunately, there is no sign of deflation in rents and they are likely to begin to reaccelerate later this year, or early next year. That is an out-of-consensus view, though, and you should keep in mind that the Fed believes we have imminent deflation in rents.

In addition to the softer rents numbers, Lodging Away from Home showed -2% m/m. However, like airfares (-5% m/m), LAFH is not something that is going to be a persistent large drag. It’s volatile. On airfares, this decline in prices matches nicely with the energy figures we saw yesterday that showed a surprising fall in jet fuel inventories. Prices dropped and people flew!
Moving on to “Supercore.” People made a lot last month of the m/m decline in core services ex-shelter, and they’ll make a lot of the fact that it declined m/m again this month. But that looks like a seasonal issue: last year the two softest months were also May and June. On a y/y basis, supercore showed another slight decline. Medical Care Services is 3.3% y/y, with Physicians’ and Hospital Services both holding pretty steady at a high level. I don’t see any major improvement in supercore yet.

Overall, there’s no doubting that this number is soothing for the Fed. It’s soothing for me too. Inflation is decelerating, and as I said last month I think the Fed will almost certainly deliver a token ease in the next couple of months.
The potential issue is that inflation isn’t slowing for the reason the Fed thinks it is. The economy is slowing, and unemployment is rising. I don’t know when Sahm first said it, but for decades I’ve been noting that when the Unemployment Rate rises at least 0.5% from its low, it always rises at least 1% more (here’s a time when I said it in 2011: https://inflationguy.blog/2011/07/10/no-mister-bond-i-expect-you-to-die/ ). Not that I’m bitter that it’s called the “Sahm Rule” now.
So yes, the economy is weakening and the labor market is softening. And that presages a deceleration in wage growth – or, really, a continuation in that deceleration. But the connection between wages and prices is loose at best, and that’s not why inflation will stay low, if it does. In fact, I continue to believe that median inflation will end up settling in the high 3s, low 4s. There has always been an ‘unless’ clause to that belief, but it isn’t ‘unless we enter recession.’ We will enter into one, and probably already are, but recessions and decelerations in core inflation are also only a loose relationship at best. It isn’t the recession which is causing disinflation (after all, the disinflation started long before now). What may is the slow growth in the money supply, combined with the rebound in velocity eventually running its course. We are closer to the end of the velocity rebound than to the beginning, and while M2 is accelerating it isn’t problematic yet. Those are the nascent trends to watch closely.
In the meantime – the Fed has what it wants for now. Soft employment and softening inflation. An ease will follow shortly. Whether that is followed by further eases remains to be seen, but…for now…the trends are favorable for the central bank.
Inflation Guy’s CPI Summary (May 2024)
The CPI report for May was definitely good news. In April, core CPI was +0.29% and Median CPI was +0.35%; this month those figures were +0.16% for core and +0.25% (est) for median. That would be the best median CPI print since last summer and this was the best m/m core CPI print since 2021.


Core goods decelerated to -1.7% from -1.3%, y/y. I have long admonished that we are running out of room for deceleration in inflation to be driven by core goods as it’s hard to imagine goods deflation of a couple percent continuing for very long. Yet, so far, that is what we have gotten! Core services, meanwhile, was steady at +5.3% y/y.

But while there’s optimism in some quarters that we have seen the light at the end of the tunnel, this data was not unequivocally good news. The disinflation going forward cannot be all about goods, but in this report it mostly was. New car prices declined (although Used Car prices rose). Apparel declined, with some of the largest m/m declines in the CPI this month for its subcategories. Durable goods declined, and ‘education and communication commodities’ (things like computers, software and accessories, telephone hardware, etc) was a measurable drag. Those are all good things, but while Bullard today was talking about ‘immaculate disinflation’ (which is an idiotic term) there wasn’t really any sign of broad immaculateness. It was mostly in core goods.
As I mentioned, core services was steady year over year. But medical care – both goods and services, actually – both accelerated. I have been watching hospital services, within medical care, and it actually decelerated (7.2% y/y from 7.7%, chart below). Yay! On the other hand, the long-suffering Doctors’ Services accelerated to 1.4% y/y from 0.9%, and Medicinal Drugs rose to 3.4% from 2.6%. Boo. The +1.3% m/m rise in Medical Care Commodities was actually one of the month’s biggest gainers in the CPI.

Airfares dropped -3.6% m/m! And motor vehicle insurance -0.25% in a welcome respite. And car/truck rental -1.2% m/m. Thus “supercore”, which is core services ex-housing, actually declined m/m for the first time in a very long time even with medical care services going up, and the y/y number took a very small deceleration on the following chart.

That is welcome news, to be sure. But if goods prices were down and core services ex-housing were down (collectively), then obviously the fact that the overall inflation number was positive means rents are still percolating. Primary rents rose +0.39% m/m, and Owners’ Equivalent Rent rose +0.43% m/m. Those are both accelerations compared to the prior month, which is not expected! Y/Y, the numbers are still slowing, but not as fast as anyone would like.

This has led some people this morning to say that inflation right now is still ‘all about rents,’ and dismiss the 40% of the consumption basket that ensures people don’t get wet when it rains. What’s funny about that is that a few months ago, economists were pointing to rents as being the main reason to be optimistic about inflation because it would soon be in deflation! Remember?
Rents are decelerating y/y, but they’re not even decelerating as fast as I thought they would (and I was on the side of ‘they’ll go down a lot slower than you think, and not as far’).

The optimist here will say that the part we don’t have a long lead time to forecast – core goods and to some extent core services ex-rents – are looking good and ‘we know’ that rents will get better so ring the bell, the Fed’s job is basically done. That would be valid, if there was reason to think that core goods would continue to contribute the deflation that we have seen recently while rents continue to decelerate. But rents are sticky, and goods are not. To that point, consider the story of Wal-Mart, which announced last week that they will be replacing paper shelf labels with electronic labels over the next couple of years. You don’t do that to make it easier to lower prices. https://finance.yahoo.com/news/walmart-replace-paper-shelf-labels-221637323.html Typically, sellers try to raise prices quickly and lower them slowly. If you think goods prices are going to go back to the old regime of basically flat, with a small downward tilt, you’d keep using a slow pricing gun.
On the goods side, we also have to deal with the rising tide of global protectionism over the last few years (see picture, source Global Trade Alert), and the mass immigration to the US which puts pressure on demand long before the new source of labor contributes to supply (as with: housing). So far, a dollar which has generally risen over the last decade has helped to blunt those effects. But that won’t be the case forever.

The bottom line is that while this is a good CPI report – in some ways, one of the best reports we have had in some time – it is not an unvarnished positive. The failure of rents to decelerate according to plan, and the stickiness of wages so far at a fairly high level, is the underlying story. Goods and airfares are what painted the pretty picture this month. But if the picture keeps getting pretty over the balance of this year, it will be using paints from a different palette. I continue to expect housing costs to decelerate some (before re-accelerating), but I am not sanguine that goods and airfares will continue to drop at the pace which made today’s report so pleasant. Indeed, I expect that next month some of these categories will likely have some give-back so unless rents start to drop faster we could have a surprise in the other direction.
Naturally, as I always admonish, it is wise to not make major investing decisions based on one data point. One month’s figure should never cause you to change your medium-term forecast, unless it represents an accumulation of data that causes you to reject your prior hypothesis. This data point does not do that, since after all it is really the first really positive data point we have had in a while. I continue to expect median inflation to settle in the high 3s, low 4s. And as I said in our Quarterly, and in the podcast recently, I think that while the FOMC has no real reason to ease they likely will lower rates a token amount, at least once over the next few months prior to the Presidential election.
Inflation Guy’s CPI Summary (Apr 2024)
The CPI for April came in pretty close to expectations. CPI came in at 0.31% m/m, and 0.29% on core, versus a priori expectations for 0.37% and 0.30%. This relative accuracy does not necessarily mean that economists now know exactly what is going on in this index, only that all of the misses canceled out. But the misses are interesting, and worth looking at, and we will do that here. Ultimately, reports like this mostly create an opportunity for framing the debate on whichever side you are on. But to my mind, this report does not meaningfully move the ball towards ‘price stability’ and leaves the Fed – if they’re being honest – still in a bind between slowing growth and sticky inflation.
Not all parts of the CPI were sticky, and that’s the point here. Actually, that has been the point for quite a while, but it was very stark in today’s report. Here’s the distribution of y/y changes in bottom-level components in the CPI. Today, the left hand stuff got lefter, the right-hand stuff got a little righter, and the middle stuff stayed about the same.

I don’t usually lead with the distribution, but it is important to keep this in mind. Inflation is not, especially at lowish levels (say, less than 5-8%), a smooth process. I used to liken this to the process of popcorn popping in a bag; the bag inflates but not because all of the kernels popped at once. The good news is that the popping is slowing, as the Fed has removed some of the heat from the bag, but the pops are still happening.
Now, here’s the good news. Thanks to core CPI being on target, the 3-month, 6-month, 9-month (well, never mind that one), and 12-month averages all decelerated.

Median inflation won’t be out for a couple of hours, but my estimate this month is 0.348% m/m, essentially unchanged from last month. That’s sort of the bad news – the y/y median CPI should be stable this month at 4.5%.

So, I think the bold type for the top line is this: inflation is decelerating, but slowly, and in a sticky fashion. The markets loved that answer and stocks and bonds leapt on the report. But that’s all framing. The debate coming into today was never about whether inflation was declining – it has been, for a while, and is expected to (even by me, and I’m on the high side of Street expectations by a fair amount) until at least Q3 and probably into Q4. That wasn’t the question – we have known since the middle of last year that 2024 would see decelerating inflation. The question is whether the deceleration will continue after that, and whether it is decelerating to 3.75%-4.25% or 1.75%-2.25%. There is as yet no sign of the latter and all signs still point to the former, because the sticky stuff is not yet unstuck.
And that continues to boil down to this: deceleration is still being driven by core goods, and resistance to that deceleration by core services.

Core goods fell to -1.3% y/y this month. I have been saying that we’ve squeezed about all we can out of core goods, and then it drops from -0.7% to -1.3%, the lowest y/y figure in 20 years! This happened even though Apparel rose 1.2% m/m. As usual, the main culprits were autos with Used Cars -1.38% m/m after -1.11% last month, and New Cars -0.45% m/m. Ironically, I think the continued softness in autos is due partly to the continued rise in motor vehicle insurance costs (which were +1.4% m/m again). We hear a lot about the affordability of housing, but you gotta have housing. You don’t gotta update your car.
The softness in core goods is welcome, naturally, but that’s the volatile part of CPI. And such low levels are only sustainable if the dollar continues to strengthen.
On the other hand, core services only softened to 5.3% y/y from 5.4%. A lot of that is housing, with OER +0.42% m/m (was +0.44% last month) and Primary Rents slowing to 0.35% from 0.41%. But outside that, ‘super core’ (core services less rent of shelter) is actually still bouncing higher. It’s 4.91% y/y – below the 6.5% it got to in late 2022, but well above the lows from October (3.75%).

Some people will like the fact that the m/m Supercore was “only” 0.42% or so, which is down from recent months. But that’s a little deceiving. Airfares were -0.81% m/m, car/truck rental -4.6%, and the monthly health insurance bump has run its course and is back to a more normal m/m change (positive, but at a 3.5% annualized rate). Longer-term, we still have to worry about the continued acceleration in, say, hospital services, which is +7.7% y/y. I pointed this out last month, and the picture is no prettier this month.

One other comment/update on rents. It is proceeding according to expectations, although I expect a slightly faster rate of deceleration for the next quarter or so. But then, all the signs are that rents are going to re-accelerate. Even those terrible indicators that inflation dummies (this includes Yellen and most of the Fed) relied on to forecast that rents would be in deflation this year…even those indicators are showing a bounce to come. Home prices are accelerating again. And none of this is surprising given that landlords are facing higher costs and increasing demand (6 million immigrants need roofs). And this is why the inflation dummies are inflation dummies – there was never, never, a good argument for why rents should be in free fall, if you just spent 10 minutes talking to an actual landlord. Get your heads out of your models and look around occasionally, dummies.

Okay, so that was a little strident but I am getting a little tired of asking potential clients how they are addressing inflation and hearing them tell me about their economist. Inflation hedging ≠ economists. Come on, people.
Let’s take this around to what we care about, and that’s policy. The Administration is trying to help the inflation figures by delaying the refilling of the Strategic Petroleum Reserve if prices go up, but is also implementing new tariffs on Chinese goods. That answers the first WWJD question (what will Joe do) – in an election year, actions which cause inflation next year are fine…just not anything which causes inflation this year. The other WWJD question (what will Jerome do) is still interesting. Growth is indeed slowing, and has been slowing for some time. Consumers are looking a bit tired, and unemployment is rising slowly. But inflation is not behaving. Median inflation won’t get below 4% until September at the earliest, and even optimistically won’t get to 3% before it starts to bounce. Before, the Fed could pretend that the new rent indicators showing widespread deflation gave it some latitude to move before the rent decreases actually arrived, but that isn’t a plausible argument any more.
However, the FOMC has started to lean more dovish. The significant decrease in the rate of taper that was announced at the last meeting clearly shows which way they are leaning. The case for a rate cut later in the summer (absent some financial crack-up that needs to be addressed) would be based on the Committee members’ sense that the current policy rate is above neutral and can be moved back towards neutral as the risks become ‘more balanced.’ Additionally, doves could argue that they don’t want to be seen easing right before the election so an ease at the end of July is a ‘down payment’ on looser policy later. The inflation data don’t support that, but the Fed doesn’t care only about inflation data. If I was on the Committee, I would not vote to loosen the taper or lower rates, but I would not be surprised to see a token ease at the end-of-July meeting. It would be cavalier, and possibly political, and not supported by the data we currently have in hand…but it wouldn’t surprise me.
One final administrative notice to those of you who subscribe to the Quarterly Inflation Outlook. The Q2 issue is expected to be published this Sunday, so look for it! (And subscribe, if you haven’t).
Bounce in Money Growth is Good News and Bad News
The monthly money supply numbers are out. I have bad news and good news.
The bad news is that the contraction in the money supply appears to be over. That’s not bad news per se (see below), but it’s bad in that the anti-inflationary work that was happening is coming to an end before it’s quite finished. Although I would be reluctant to annualize any one month’s change in M2, the $92bln increase in M2 in March was the largest increase since 2021. It only annualizes to 5.5%, so it isn’t exactly running away from us – but it’s positive. The 3-month and 6-month changes are also positive, and the highest since early 2022 in each case. Again, we’re only 0.72% above the ding-dong lows of last October, but the sign is now positive.
With the money supply figures now in, and with the advance Q1 GDP report due this week, we can revisit our chart of “how much more inflation ‘potential energy’ remains.” (see “Where Inflation Stands in the Cycle,” November 2023). As that article (and this chart) illustrates, if M2 doesn’t go down then this gets more difficult. M2 in Q1 rose at a 1.24% annualized rate over Q4. GDP is expected to rise 2.5% annualized. So M/Q…barely moves, as the chart shows.

We will eventually get back to the line, unless velocity is permanently impaired. Despite all of the crazy people who told you it was, there’s no evidence of that. M2 velocity will rise about 1% (not annualized), if the GDP forecasts are on point. That will be the smallest q/q change in several years, and velocity will be getting very close to the 2020Q1 dropping-off point. But there frankly is no reason for velocity to stop there; higher interest rates imply higher money velocity. However, we are getting close.

(Incidentally, if you’re curious how we can be almost back to the dropping-off point of velocity and yet still be 5% below the line in the first chart above, it’s because I’m using core inflation. With food and energy, we’re a little closer to the line and have used up more of the ‘potential energy.’ But food and energy are of course volatile and so while a good spike in energy prices would look like we’ve used up all of the potential energy, that could just be a one-off effect.)
Either way, we aren’t too far away from getting back to home base and that’s good news. Yes, prices by the time we are done will have risen 25% since the end of 2019, and that can’t really be characterized as a ‘win.’ Let’s go Brandon. But we are getting closer.
The good news about the new rise in M2 is that it’s timely. Markets and the economy were starting to show signs of money getting a little tight; losing a little lubrication in the machinery. An economy does need money to run, and while the only way we can get back to the old price level is to have money supply continue to decrease, that’s also a painful process. In the long run, we would have price stability if the change in M was approximately equal to the change in GDP. If we want 2% inflation, then we need M to grow about 2% faster than GDP. Vacillating velocity means that it isn’t purely mechanical like that – the steady decline in velocity since 1997 is the only reason that inflation stayed tame despite too-fast money growth over that period – but the long downtrend in velocity is likely finished since the long decline in rates is finished. Thus, if we get money supply growth back to the neighborhood of 4%, we can get our 2-2.5% growth with restrained inflation over time.
I am not super optimistic that all of that will work out so nice and cleanly like we draw it up on the chalkboard, but I am more optimistic about it than I was two years ago. We still have some sticky inflation ahead of us, but if the Fed keeps reducing its balance sheet then eventually we will get inflation below the sticky zone and back towards ‘target’ (even though there isn’t a target per se any more).
Inflation Guy’s CPI Summary (Mar 2024)
After a week when the NY/NJ area saw an earthquake, an eclipse, and a gorgeous 75-degree spring day, it is time to get back to work.
Today’s CPI report was not expected to be particularly great. In fact, one of the biggest conundrums of market behavior recently has been the question of why investors seemed to remain very confident that the Fed will cut rates several times this year, even as forecasts for the path of inflation have backed off of what they were last year (when most forecasters had core CPI returning placidly and obediently to the neighborhood of 2% this year). The a priori consensus forecasts for today’s CPI figure were +0.28% m/m on core and +0.33% m/m on headline. The Kalshi market was in line with that, although CPI swaps were a touch lower on headline at +0.29% (seasonally adjusted, but CPI swaps trade NSA CPI). That’s not wonderful: 0.28% on core would annualize to 3.4% y/y.
The assumption has been that even if in March we are annualizing to 3.4%, the coming deceleration in rents will push everything back down to where it needs to be. The problem with this has always been (a) the strongly-held belief that rents would slip into deflation this year were never based on good analysis, and more importantly (b) this assumed that nothing unforeseen would happen in the other direction. It is characteristic of inflationary periods, of course, that bad things happen on the upside. So this was always sort of assuming a can opener,[1] but at least forecasts for the current data were reflecting that these things had not happened yet. To be fair, the consensus on core has been low relative to the actual print for four months in a row, but at least folks are forecasting mid-3s, rather than 2.0.
Now, let’s review one other thing before we look at some charts. The recent story boils down to this: sticky rents, sticky wages. While core goods has been pulling down core inflation, that game was running out of room. The next part of core deceleration relies on un-sticking the sticky rents, and sticky wages.
So here we are. Today’s figure +0.36% on core CPI, +0.38% on headline (seasonally adjusted on both). This makes the last 3 core CPIs 0.39%, 0.36%, and 0.36%. The chart below of the m/m core CPI figures does not really give the impression of a decelerating trend.

We always look these days first at rents, because that is so important to the disinflation story. Rent of Primary Residence was +0.41% m/m, down from 0.46% last month. Owners’ Equivalent Rent was steady, at +0.44%. Remember that there had been some alarm two months ago, when OER for January jumped to 0.56%, that this was due to a new survey method or coverage and it was going to be repeated going forward. That was always pretty unlikely, but now we have had two months basically back at the old level and the January figure appears to be an outlier. 0.41% on Primary and 0.44% on OER is not hot, just sticky. It isn’t going up; it’s just not going down very fast.

Rents will continue to decline. But the failure of rents to slip into deflation is a source…maybe the source…of the big forecast error made by economists about 2024 CPI. Our cost-based model for primary rents, which never got even vaguely close to deflation, has now definitively hooked higher with the low coming in November. Rents haven’t been decelerating as fast as our model had them, but if anything that’s a source for concern on the high side.

Outside of rents, core inflation ex-housing rose to 2.38% y/y. That sounds like “most of the economy is on target,” but that’s not how inflation works. There’s a distribution, and if the ‘rents’ part of the distribution is going to be higher than the target then everything else needs to average something below the target. We aren’t there. And, as I noted above, we’ve squeezed out just about everything we can from core goods. Actually, y/y core goods dropped to -0.7% thanks partly to continued declines in Used Cars (-1.1% m/m) and some decline this month in New Cars (-0.2%). I think the latter might partially reflect discounts on the EV part of the fleet, where cars for sale have been piling up as manufacturers under political pressure have been producing far more of them than people want.

Note that core services, even with the decline in y/y rents, moved higher this month to 5.4% from 5.2% y/y. Some of that was medical care, which was +0.49% m/m driven by another jump (+0.98% m/m) in Hospital Services. The y/y rise in Hospital Services is now up to 7.55% – the highest since October 2010.

Partly driven by hospital services, the ‘super core’ (core services ex-rents) continues to re-accelerate.

Again, this is not what the Fed wanted to see; and it’s driven partly by the stickiness in wages. The Atlanta Fed’s Wage Growth Tracker has decelerated but is still at 5.0% y/y. That’s not the stuff that 2% core inflation is made of.
Let’s take one moment to look at a piece of good news from the report. My estimate of median CPI, which is my forecast variable because it is not subject to outliers like Core CPI, is +0.32% for this month. Because I have to estimate seasonals for the regional housing numbers, actual Median might be a teensy bit higher or lower but in any event the chart of Median CPI is much less alarming than the chart of Core CPI.

I should observe that the news there is not completely good, since a signature of inflationary environments is that tails are to the upside – that is, core is persistently above median. That was true during the upswing, but during the moderation core has gone back below median. But this bears watching, and if core starts to routinely print above median it will be a negative sign. For now, though, the Median CPI is good news. Relatively.
So let’s talk policy.
The Administration always seems to be confused about why, despite strong jobs numbers, consumers consistently report dissatisfaction with the economic situation. There really shouldn’t be any confusion. Consumers, especially those not in the upper classes, hate taxes. And in addition to a high direct take from the government in explicit taxes, consumers are also facing persistent inflation that the Administration says isn’t there. Inflation is a tax, and it sucks worse than direct taxation because you can’t rearrange your consumption very well to avoid it. (You can rearrange your investment portfolio, but a strikingly small number of people seem to have actually done that even three years into this inflation episode. If you’re curious about how, you really should visit Enduring Investments and ask.)
On the other question of policy, and that’s the Fed: I can’t see any rational argument for cutting rates in June. Actually, on the data we have in hand I can’t see an argument for cutting rates in 2024, except for the one the Fed doesn’t consider and that’s that interest rates don’t affect inflation. To cut the overnight rate, the Fed would have to rely on forecasts that inflation is going to get better. And to do that now, when forecasts have been persistently wrong (and not by just a little bit but about the whole trajectory) since 2020, would be incredibly cavalier. The FOMC still consists of human beings, so never say never. And the inflation data should improve as the year goes along and rents moderate. I just don’t see any sign that it’s going to moderate enough to say ‘we’ve reached price stability.’ Sticky in the high-3s, low-4s is still where I think we’re coming out of this.
[1] A physicist, an engineer, and an economist are stranded on the desert island with nothing but a crate of canned food. “How are we going to get the food that is inside of these cans?” asked one. The physicist says “well, we could heat the cans, carefully, in a crucible we make from ocean clays. Eventually the heat will cause the can to burst and we can get the food inside.” The engineer says “that will take too long. What we need to do is take some of these coconuts, raise them up to a great height with a series of ropes I will design, and allow them to smash down onto the cans, breaking them open.” The economist says “I have a solution that is far easier than what you fellows are doing. Here is how we do this. First, assume a can opener….”
When to Own Breakeven Inflation
It is interesting to me that, with as important and liquid as the inflation-linked bond market is, tactical allocation between TIPS and nominal bonds is at best an afterthought for most investors. Perhaps this is because TIPS – if you think in nominal space, like most investors do – can be quirky and complex to analyze on a bond-by-bond basis. Here’s a picture of the TIPS yield curve. The red line is the way that TIPS real yields are calculated, and therefore the curve as perceived in the market. The green line is the true yield curve, adjusting for the way the seasonality of inflation prints affects each particular bond.
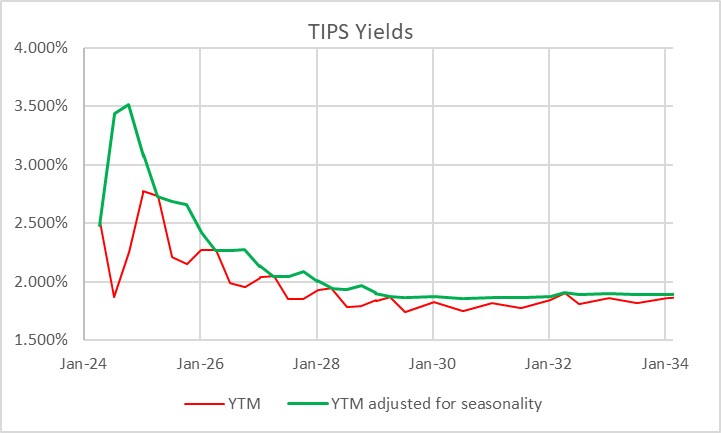
That’s understandable, but I don’t think it’s sufficient. Most investors do not invest in individual bonds, especially in TIPS space. They invest via mutual funds or ETFs, although the ‘laddering’ of TIPS to form a crude inflation-linked annuity is a popular approach amongst do-it-yourselfers. So why do so many investors own nominal bonds, instead of inflation-linked bonds, as an immutable strategic allocation? Even those who make occasional tactical shifts into TIPS seem to do so when they are expecting inflation to rise, and so are making a macro call instead of a quantitative call. But there are lots of times when owning TIPS instead of nominal bonds is just a good bet, regardless of your immediate inflation view. The most obvious one I wrote about back in March 2020 in “The Big Bet of 10-year Breakevens at 0.94%,” and I’ve also written generally about why you might want to be long inflation-linked bonds even if the current level of implied inflation (aka ‘breakevens’) is near to fair on the basis of your own view about the trajectory of inflation (see “A Guess at the Value of Long Inflation Tails” as an example).
But the times when just being long TIPS instead of nominals…or being long breakevens or inflation swaps if you do it as a leveraged play…is advantageous are not limited to unusual circumstances. TIPS also have tended to be systematically cheap over long periods of time, which I’ve also documented. Another way to consider the same question is to ask, “if I bought 10-year breakevens when they were at a particular level, how would I have done historically?” Or, equivalently, “if I had switched into 10y TIPS, instead of 10y Treasuries, when the spread was at a particular level, how much would I have out- or under-performed historically?” The chart below answers that question.

I went back to February 1998. For each of 6,453 days (ending in June 2023 since I had to look forward 6 months) I considered the starting 10-year breakeven rate and calculated the return to being long that breakeven over the next 6 months.[1] That return is dependent on the relative yields of the different securities, how those yields (and hence the breakeven) changed over time, and how actual inflation developed. It’s worth pointing out that this time period, core inflation was below 3% for 90% of the time. Ergo, you wouldn’t expect to have lots of big wins because of inflation surprise, although of course toward the end of the historical period you did.
The chart shows for each bin (I threw all 58 days with 10-year breakevens lower than 0.75% into the same bucket, which turned out to be equal to the number of days in the 2.75%-3.00% bucket) what the average 6-month return was to being long 10-year breakevens along with the 10th percentile and 90th percentile. So you can see that on average, you didn’t lose money being long breakevens anywhere under 2.50%, despite the fact that inflation throughout this period was very low. That’s a function of what I said before, that TIPS in general were cheap throughout this period. And if you bought breakevens (or switched into TIPS) any time that the breakeven was below 1.5%, you had a 90% or better chance of winning.
Naturally, it shouldn’t be a surprise that if you buy breakevens at a cheap level – as with any asset – you stand a better chance of winning than if you bought it at a dear level. What is a little more of a surprise is that there hasn’t historically been very much pain, on average, to being long breakevens even when they are high. In fact, unless you bought breakevens above 2.75% – basically, one event in 2022 – you had at least a 40% chance of winning your bet (10y TIPS outperforming).

This isn’t to say that there aren’t a lot of ways to lose, trading or investing in TIPS. Like any other investment, they can lose money and in 2022-2023 being naked long TIPS was almost as painful as being naked long any other fixed-income instrument. Almost. You did lots better than if you’d owned nominal Treasuries through the same episode!
[1] I used the Bloomberg US 10 year Breakeven Inflation Index, which is a total return index (BXIIUB10 Index on Bloomberg), from its inception in 2006; prior to that I used Enduring Investments calculations which utilized roughly the same methodology.
Inflation Guy’s CPI Summary (Dec 2023)
You can follow me on X at @inflation_guy. Sign up for email updates to my occasional articles here. Individual and institutional investors, issuers and risk managers with interests in this area be sure to stop by Enduring Investments! Check out the Inflation Guy podcast!
I’m changing the way I do the monthly CPI analysis. Doing it live for an audience was always stressful, especially with the inevitable data issues from time to time. Of course, as an inflation investor/trader I’ll still do it live; I just don’t have an audience. The nice part about doing it live was that the monthly report had a very similar structure to it with the same charts all of the time, and that will change. But it also means that I can lead with the important stuff sometimes, like this month. So I’m going to start today’s discussion of the slightly above-consensus CPI report (+0.31% on core, vs expectations for +0.25%) by saying the quiet part out loud:

Rents aren’t collapsing. They are decelerating, and they will continue to do so, but they are not going into deflation. Everyone today seems to be acting as if this is some huge shock, but it really isn’t. The only reason to ever have thought there would be rental deflation in an environment of housing shortage was that some of the high-frequency rent indices (which are not designed to be high-quality data; they’re data derived from a business that have been packaged as if it is high-quality data) suggested declines in rents, and an influential article – I talked about it in episode 74 of the Inflation Guy podcast – popularized the notion that you could get more information from the BLS by looking at less data. But the cost side has never improved for landlords – in fact, it keeps getting worse – so it was hard to see how there would be a general decline in rents. In some parts of the country, from which people are migrating away, e.g. perhaps inner cities, rents may fall. But those people have to go somewhere. Big migration means the housing stock is now all in the wrong places, and rents go up when there’s a shortage faster than they fall when there’s a glut.
Anyway, both my costs-based rents model above and my old rents model below suggest the same destination for rents – middle of this year or just afterwards, y/y rents should get to around 2-3%. That’s a lot lower than the current run rate for rents, of +0.47% m/m for OER and +0.42% for Primary rents this month, but it’s also far above what the general expectation has been for this large part of the consumption basket. Moreover, it appears that the longer-term pressures are for that part of inflation to scoop back higher, not lower.

So, today’s rents number was a little surprising, but not that surprising. Some are attributing the miss today to ‘just rents,’ as if it’s okay for the largest part of the CPI to have a trajectory that’s confounding many forecasts, but it wasn’t just rents. Median inflation was +0.42% m/m, keeping the y/y number above 5%. And three of the last four figures have been in that zone. Median should keep decelerating too, but it is not collapsing.

Now, I’ll note that Used Car prices were weird, again. They rose +0.49% m/m, when I (and most folks) had expected a decline. They’ve been a bit squirrelly for a while, with official inflation printing higher than the private surveys fairly persistently for 6-9 months. But on the other hand, airline fares have been persistently squirrelly lower compared to jet fuel, so these two things were ‘errors’ in the opposite direction. This month, airfares also rose, by about 1% m/m – but that was right about where it should have been given the change in fuel prices and not a surprise.

Now, the diffusion stuff is looking better, and supports the idea that median inflation will continue to decelerate.

Such a deceleration has been and continues to be my forecast. I expect median inflation to settle in the high 3%s, low 4%s, and be hard to push much below that. In the near-term, meaning maybe by early H2 of this year, we could get some numbers a little below that as the rent deceleration continues. But then the hook happens. It will be hard to get inflation below 3% for very long, especially if the Fed decides to stop shrinking its balance sheet and money supply growth recovers.
So the system is normalizing after COVID (and more relevantly, after the spastic and dramatic fiscal and monetary response to COVID). But normal is no longer sub-2%. Core services ex-shelter (so-called “supercore”) abstracts both from the deceleration in housing and the sharp drop in core goods, and it is hooking higher (this is partly because Health Insurance had been artificially depressing it and that effect is waning).

Supercore is unlikely to really plunge either. Wages remain robust. The Atlanta Fed just released its Wage Growth Tracker, at 5.2% for the fourth month in a row. The spread between median wages and median inflation, which had been stable around 1% for a long while, is heading back there (see chart). So again, we’re looking at something around 4% for median inflation unless wages start to decelerate…and there’s as yet no sign of that.

The bottom line is that while this number was only a little bit surprising, it was surprising for all the wrong reasons. There is nothing in this figure that suggests the Fed can comfortably abandon a tight-money policy and think about easing soon, and I don’t expect them to do so.
