Archive
Half-Mast Isn’t Half Bad
As I watch the stock market, implausibly, rise to levels no one expected so soon after the crash, I am also sickened by the cheerleading from those whose fortunes – not to mention egos – are wrapped up in the level at which the Dow trades. Stock market fetishism always fascinates me as much as it repels me. Although my experience as a trader (and a short-term options trader, at that) would seem to suggest otherwise, my makeup is as a long-term investor. I want to buy value, and the mathematics of investing for me is that I want (a) high intrinsic value at (b) a low price. While people who are buy-and-hold investors of a certain age clearly benefit from higher prices, young investors clearly benefit from lower prices since they’re going to be net buyers for a long time. And the price at which you acquire intrinsic value matters. So does the price at which you sell, but not until you sell.
So to me, there’s nothing great about a price that’s high relative to intrinsic value, unless I am preparing to sell. In a broader sense, the idea that we should cheer for higher prices (as opposed to higher intrinsic values) is not only unseemly, but destructive and I’ll explain why in a minute. I will note that the fascination with watching prices ticking every second goes back a long ways: you can read in Reminiscences of a Stock Operator about the bucket shops of the early 1900s where speculators would watch and trade the stock market tape. The general increase in investor twitchiness and short-termism that has accompanied the growth of financial news TV, online investing, and the development of ETFs to trade broad market exposures intraday certainly adds numbers to the cheerleading crowd. But it isn’t new. Depressing, but not new.
The most fascinating example of this belief in the (non-intuitive, to me) connection between the value of the stock market and the value of ‘Merica was presented to me in the aftermath of 9/11. When we first trudged back to lower Manhattan, there were people handing out these cards:


Fight Osama! Buy Cisco! I never did see the connection, and it seemed to me at the time either delusional (the terrorists win if my investment in Lucent goes down) or nakedly self-serving. Certainly the way I feel about my country has nothing to do with where I’m able to buy or sell eBay today. And actually, they really weren’t coming for our 401(k)s, they were coming for our lives. But I digress.
The point I actually want to make is that when the Fed works to stabilize market prices, they’re having a negative effect by destabilizing economic variables. An analogy from manufacturing might be an entry point to this explanation: a truism in manufacturing is that you can stabilize inventory, or you can stabilize production, but you can’t stabilize both (unless your customers are accommodating and provide very smooth demand). If you want to stabilize inventory levels, then you need to produce more when business is high and less when business is low, so you’re on the production roller-coaster. If you want to keep production level, then inventory will be low when business is high and high when business is low, so you’re on the inventory roller-coaster. Only if business itself is stable – which is rare – can you do both.
A similar thing happens in capital markets. You can stabilize the cost of capital, but then you destabilize growth rates. Or you can stabilize growth rates, and the cost of capital (stock and bond prices) will fluctuate. This is true unless you can do away with the business cycle. If you choose, as the Fed has in recent years, to try and stabilize market prices at very high levels (stabilizing the cost of capital at very low levels), then when underlying activity is strong you’ll get a ton of speculative investment in capacity, new ventures that depend on the availability of cheap capital, and strong growth. And then when economic activity heads lower, you’ll find that lots of businesses go bust and the recession is deeper. In fact, it’s not just the speculative businesses that go bust, but the overbuilding in the expansion can cause even prudent enterprises to have more difficulties in the downturn.
The Fed’s historical response to this has been to let the speculative activity happen when the cost of capital is held too low, but not let companies go bust when economic activity wanes…so they lower the cost of capital even further.
I’m obviously not the first person to point out that the Fed’s constant intervention has deleterious effects and tends to increase the amplitude of boom and bust. And, for what it’s worth, I’m not blaming the current recession on the Fed. Clearly, the proximate cause of this recession was COVID-19 and the global economic shutdown. What made it worse was that the Fed, by holding down the cost of capital, had previously precipitated the development and preserved the success of many more speculative enterprises. And the fetishism about stock prices, and about how important it is to have lots of money “working for you” in the stock market, is also one of the reason that people don’t save enough.
Of course, right now is probably not the time for the Fed and Congress to pull back and let huge numbers of people and companies go bankrupt. There’s a case to be made for the sort of government response we are having in this episode, in which personal income is being replaced by money creation while workers are ordered to stay home. There will be a piper to pay for that policy – a loss of price stability which is a consequence of trying to preserve output stability, but a consequence that it’s arguably acceptable to pay. Afterwards, though, I hope that central banks can start to let natural rhythms replace the autocratic ones. I am not hugely optimistic on that score, but one place to start is this: stop lowering the bar for central banks to intervene in markets. Stop targeting equity prices and interest rates. It’s okay to let the Dow trade at half-mast, and the bull will come back without the Fed’s help.
In fact, if we don’t keep trying to artificially increase the length of the mast, the Dow might never need to trade down to half-mast in the first place. Certainly, intrinsic values don’t retrace 50% in a recession!
Why Bond Folks Are More Afraid of COVID-19
On Friday I tweeted a picture from our daily chart pack, and mused that either credit is too negative or stocks are not negative enough.
 I spent the weekend musing about why the bond guys seem to be so negative about the effects of the COVID-19 virus compared to the stock guys. Equity investors tend to tell me things like “well, the fundamentals are pretty sound” (ignoring the role that multiples play in stock market levels), which sometimes manifests in super-dumb things like Larry Kudlow’s admonition a few thousand points ago that people should buy the dip. (By the way, all those folks who bought the dip because Larry said so…will the government make them whole? Didn’t think so. Rule to remember: never take the advice of someone who has a vested interest in the outcome.)
Meanwhile, bond investors had put bond yields at all-time lows. This is especially amazing compared to the levels that yields reached in the Global Financial Crisis; back then, a housing bubble was in the process of imploding and, since shelter is a major part of core inflation it was a done deal that inflation was going to plunge, and far (Core CPI eventually got as low as 0.6%, although it didn’t get very low at all ex-housing). So low nominal yields made sense. But today, this does not seem to be in the offing. Core inflation is more likely to accelerate with the effects of the supply shock, unless the virus gets so bad that we really do have a major demand shock. And even then it should not fall very far. So the message from the bond market is super negative on growth, and stocks are only a little off their all-time highs (at least, until tonight. Right now S&P futures are -4%, although a lot of that has to do with the collapse of energy prices thanks to the disintegration of OPEC+). So again, I wonder, why?
After long thought I think it is because bond investors understand much more viscerally the power of compound interest. Compound interest is the concept that money grows not linearly, but exponentially over time. If I start with $400 and grow it at 12% per year, here is what it becomes.
 So that little $400 ends up being a really big pile of money after 60 years! From little acorns do mighty oak trees grow, and all of that. But equity folks don’t love this chart because the first 20 years looks incredibly uninteresting, not at all like Tesla. Now, if we look at this in log scale, it looks much more boring but this next chart says the same thing: stuff is compounding at 12%.
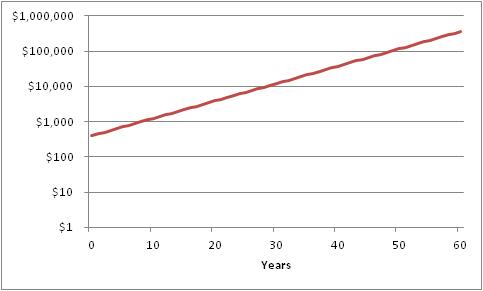 And that chart actually looks kinda similar to this chart, sourced here.
 This is a plot of COVID-19 cases outside of China, and the left axis is log scale. What this chart says is that there is no sign that the rate of growth of cases of COVID-19 is slowing. In fact, its spread has been remarkably consistent since the beginning of February. Roughly, the number of cases in the US has been growing at around 12% per day. Which means that the chart looks a whole lot like the chart of $400 turning into $360,000 over 60 years, except that now it is 400 cases (Friday’s figure) turning into 360,000 cases over 60 days.
 So when people say “the flu kills more people than this virus,” I know they’re equity folks. They see 400 cases and compare to 36,000 flu deaths and scoff. But that just tells me they don’t appreciate the power of compounding. Yes, COVID-19 hasn’t killed 36,000 Americans yet. But the flu kills that many per year despite the fact that (a) it isn’t generally communicable for very long outside of the period when the carrier has symptoms – which is why it’s okay to go back to school when you’re fever-free for 24 hours, (b) it has a pretty low fatality rate in the 1-2% range, and (c) almost everyone is inoculated against the flu. COVID-19 beats the flu on all three of those metrics.
That doesn’t mean that this bug will kill everyone, but it does mean that it is fairly likely to kill more than the flu unless something changes with the rate of exponential growth. By the end of May, the same growth rate would mean more than 6 million Americans have gotten the virus, which means a couple hundred thousand would die.
This is not a prediction, and I really hope that the rate of contagion slackens and the survival rate increases. I don’t know what would cause that to happen: I am not an epidemiologist. I’m just a bond guy, and I understand compounding. In investments, compounding is your friend. In disease, compounding is your enemy.
Tariffs and Subsidies…on Money
Many, many years ago (27, actually) I wrote a paper on how a tariff on oil actually has some beneficial effects which needed to be balanced against the beneficial effect that a lower oil price has on economic growth. But since the early 1990s until 2015 or so I can count on the fingers of one hand how many times the issue of tariffs came up in thoughts about the economy and markets. To the extent that anyone thought about them at all, it was to think about how lowering them has an unalloyed long-term positive effect. Which, for the most part, it does.
But the economics profession can sometimes be somewhat shamanistic on the topic of tariffs. Tariffs=bad; time for the next chapter in the book. There is much more complexity to the topic than that, as there is with almost any economic topic. Reducing economics to comic-book simplicity only works when there is one overwhelmingly correct idea, like “when demand for a good goes up, so does the equilibrium price.” The end: next chapter.
Tariffs have, though, both short-term and long-term effects. In the long-term, we all agree, the effects of raising tariffs are deleterious. For any given increase in money and velocity, we end up with lower growth and higher inflation, all else equal. It is important to realize that these are largely one-time effects although smeared out over a long period. That is, after equilibrium is reached if tariffs are not changed any longer, tariffs have no large incremental effect. It is the change in tariffs that matters, and the story of the success of the global economy in terms of having decent growth with low inflation for the last thirty years is largely a story of continuously opening trade. As I’ve written previously, this train was just about running out of track anyway so that we were likely to go back to a worse combo of growth and inflation, but reversing that trend would lead to significantly worse combinations of growth and inflation in the medium-to-long term.
In the short-term, however, tariffs can have a positive effect (if they are expected to remain) on the tariff-imposing country, assuming no retaliation (or even with retaliation, if the tariff-imposing country is a significant net importer). They raise employment, and they raise the wage of the employed. They even may raise the real wage of the employed if there is economic slack. The chart below shows the y/y change in manufacturing jobs, and ex-manufacturing jobs, for the last 40 years. Obviously, the manufacturing sector has been shrinking – a story of increased productivity, but also of trade liberalization as manufacturing was offshored. The Obama-era work programs (e.g. “Cash for Clunkers”) temporarily reversed some of that differential decline, but since 2016 – when we got a new President – manufacturing payrolls growth has caught up to non-manufacturing. That’s not a surprise – it’s the short-term effect of tariffs.

The point is that tariffs are a political winner in the short-term, which is one reason I think that people are overestimating the likelihood that “Tariff Man” is going to rapidly concede on trade and lower tariffs. If the Administration gets a clear “win” in trade negotiations, then I am sure the President is amenable to reversing tariffs. But otherwise, it doesn’t hurt him in the heavy manufacturing states. And those states turn out to be key.
(This is a relative observation; it doesn’t mean that total payrolls will rise. The economic cycle still has its own momentum, and while tariffs can help parts of the economy in the short term it doesn’t change the fact that this cycle was very long in the tooth with lots of imbalances that are overdue for correction. It is no real surprise that employment is softening, even though it is a lagging indicator. The signs of softening activity have been accumulating for a while.)
But in the long run, we all agree – de-liberalizing trade is a bad deal. It leads among other things to bloat and inefficiency in protected sectors (just as any decrease in competition tends to do). It leads to more domestic capacity than is necessary, and duplicated capacity in country A and country B. It promotes inefficiency and unbalanced growth.
So why, then, are investors and economists so convinced that putting tariffs or subsidies on money has good (or even neutral) long-term effects? When the Fed forces interest rates higher or lower, by arbitrarily setting short-term rates or by buying or selling long-term bonds – that’s a tariff or a subsidy. It is protecting interest-rate sensitive sectors from having interest rates set by competition for capital. And, as we have seen, it leads in the long run to inefficient building of capacity. The Fed evinces concern about the amount of leverage in the system. Whose fault is that? If you give away free ice cream, why are you surprised when people get fat?

The only way that tariffs, and interest rate manipulations, have a chance of being neutral to positive is if they are imposed as a temporary rebalancing (or negotiating) measure and then quickly removed. In the case of Federal Reserve policy, that means that after cutting rates to address a temporary market panic or bank run, the central bank quickly moves back to neutral. To be clear, “neutral” means floating, market-determined rates where the supply and demand for capital determines the market-clearing rate. If investors believed that the central bank would pursue such a course, then they could evaluate and plan based on long-term free market rates rather than basing their actions on the expectation that rates would remain controlled and protective.
It is no different than with tariffs. So for central bankers criticizing the trade policy of the Administration, I say: let those among you who are without sin cast the first stone.
A Real Concern About Over(h)eating
I misread a headline the other day, and it actually caused a market analogy to occur to me. The headling was “Powell Downplays Concern About Overheating,” but I read it as “Powell Downplays Concern About Overeating.” Which I was most delighted to hear; although I don’t normally rely on Fed Chairman for dietary advice[1] I was happy to entertain any advice that would admit me a second slice of pie.
Unfortunately, he was referring to the notion that the economy “has changed in many ways over the past 50 years,” and in fact might no longer be vulnerable to rapidly rising price pressures because, as Bloomberg summarized it, “The workforce is better educated and inflation expectations more firmly anchored.” (I don’t really see how an educated workforce, or consumers who have forgotten about inflation, immunizes the economy from the problem of too much money chasing too few goods, but then I don’t hang out with PhDs…if I can avoid it.) Come to think of it, perhaps the Chairman ought to stick to dietary advice after all.
But it was too late for me to stop thinking about the analogy, which diverges from what Powell was actually talking about. Here we go:
When a person eats, and especially if he eats too much, then he needs to wait and digest before tackling the next course. This is why we take a break at Thanksgiving between the main meal and dessert. If, instead, you are already full and you continue to eat then the result is predictable: you will puke. I wonder if it’s the same with risk: some risk is okay, and you can take on more risk up to a point. But if you keep taking on risk, eventually you puke. In investing/trading terms, you rapidly exit when a small setback hits you, because you’ve got more risk on than you can handle. Believe me: been there, done that. At the dinner table and in markets.
So with this analogy in place, let’s consider the “portfolio balance channel.” In the aftermath of the Global Financial Crisis, the Fed worked to remove low-risk securities from the market in order to push investors towards higher-risk securities. This was a conscious and public effort undertaken by the central bank because (they believed) investors were irrationally scared and risk-averse, and needed a push to restore “animal spirits.” (I’m not making this up – this is what they said). It was like the Italian grandmother who implores, “Eat! Eat! You’re just skin and bones!” And they were successful, just like Grandma. The chart below (source: Enduring Investments) plots the slope of the securities market line relating expected real return and expected real risk, quarterly, going back to 2011. It’s based on our own calculations of the expected real return to stocks, TIPS, Treasuries, commodities, commercial real estate, residential real estate, corporate bonds, and cash, but you don’t have to believe our calculations are right. The calculation methodology is consistent over time, so you can see how the relative value in terms of risk and reward evolved.
 The Fed succeeded in getting us to eat more and more risky securities, so that they got more and more expensive relative to safer securities (the amount of additional risk required to get an increment of additional return got greater and greater). Thanks Grandma!
But the problem is, we’re still eating. Risk is getting more and more expensive, but we keep reaching for another cookie even though we know we shouldn’t.
Puking is the body’s way of restoring equilibrium quickly. Abrupt market corrections (aka “crashes”) are the market’s way of restoring equilibrium quickly.
This isn’t a new idea, of course. One of my favorite market-related books, “Why Stock Markets Crash” by Didier Sornette, (also worth reading is “Ubiquity” by Mark Buchanan) talks about how markets ‘fracture’ after bending too far, just like many materials; the precise point of fracture is not identifiable but the fact that a fracture will happen eventually if the material continues to bend is indisputable.
My analogy is more colorful. Whether it is any more timely remains to be seen.
[1] To be fair, I also don’t rely on Fed Chairman for economic advice.
Being Closer to the ‘Oh Darn’ Inflation Strike
The time period between spikes of inflation angst seems to be shortening. I am not sure yet about the amplitude of those spikes of angst, but the concern seems to be quickening.
This is not without reason as it seems that concerning headlines are occurring with more frequency. This week the Bloomberg Commodity Index again challenged the 2016 and 2017 highs before backing off today (see chart, source Bloomberg).

Somewhat more alarming than that, to people who watch commodities, is how the commodity indices are rallying. The culprits are energy as well as industrial metals, and each has an interesting story to tell. Energy has been rallying partly because of global tensions, but also partly because US shale oil production appears to be running into some bottlenecks on production (wages, shortages of frack sand) as well as delivery (capacity constraints on pipelines), and part of what has kept a lid on energy prices over the last couple of years was the understanding that shale oil production was improving rapidly and becoming lots more efficient due to improved technology. If shale is limited, the ‘lid’ on prices is not as binding as we had thought. On industrial metals, some of the upward pressure has been due to fallout from US sanctions on Rusal, a major supplier of aluminum and alumina. Since those sanctions were announced, aluminum prices have risen around 25%, and alumina (a raw input to aluminum production) about 50%, with knock-on effects in other industrial metals.
Both of these items bear on the market’s recent fears about new pressures on inflation – capacity constraints (especially rising wages for long-haul truckers) and potential fracturing of the global trade détente.
And 10-year breakevens are at new 4-year highs, although it is worth remembering that this is nowhere near the 10-year highs (see chart, source Bloomberg).

Shorter inflation swaps look less alarming, and not at new four-year highs. However, even here the news is not really soothing. The reason that shorter inflation swaps are lower than they have been in the past is because the energy curves are in backwardation – meaning that the market is pricing in lower energy process in the future. In turn, this means that implied core inflation – once we strip out these energy effects – are, in fact, at 4-year highs (see chart, source Enduring Investments).

So there is legitimate cause to be concerned about upside risks to inflation, and that’s one reason the market is a bit jumpier in this regard. But there is also additional premium, volatility, and angst associated with the level of inflation itself. While as I have pointed out before much of the rise in core inflation to date due to optics arising from base effects, that doesn’t change the fact that the ‘oh, rats’ strike is closer now. That is to say that when core inflation is running at 1.5%, stuff can go wrong without hurting you if your pain threshold is at 3%. But when core inflation is at 2.5% (as it will be this summer), not as much “bad stuff” needs to happen to cause financial pain. In other words, both the ‘delta’ and the ‘gamma’ of the exposure is higher now – just as if one were short a call option struck at (say) 3% inflation. Because, implicitly, many investors are.
If inflation is low, then even if it is volatile in a range it can be consistent with high market valuations for stocks and bonds. But when inflation starts to creep above 3%, those markets tend to suffer in non-linear fashion.
And this, I believe, is why the market’s nervousness about inflation (and market volatility resulting from that nervousness) is unlikely to soon abate.
Inflation and Castles Built on Sand
Note: my articles are now released somewhat earlier on the blog site and on my private Twitter feed @inflation_guyPV, which you can sign up for here, than they are released on my ‘regular’ Twitter feed. Moreover, my monthly live tweets during the CPI report are only available on that feed.
Also note: if you haven’t heard it yet, you can listen to my appearance on the Bloomberg Odd Lots podcast last month here. For that matter, you can listen to it at that link even if you have heard it yet.
Now that we can stop focusing on the imminent destruction of wealth in the stock market, for at least today (I am underwhelmed at the rebound on light volume), we can get back to something that matters: inflation.
The chart below shows a straight, unweighted average of core or median inflation in the US, Europe, Japan, the UK, and China. (The chart looks similar if we only include the US, Europe, and China and exclude the recent ‘outlier’ Japan and UK experiences).

We know that, in the US, measured inflation is going to be rising at least until the summer, as the one-offs from 2017 drop out of the data. The prior decline, and the current rise, obscure the underlying trend…which is for steady acceleration in prices. But it’s important to realize that this is not merely a US trend, caused supposedly by ‘tight labor markets’ or somesuch. It is a much broader phenomenon. The chart below shows four of those five countries.

In the US, inflation has been rising steadily (other than that one-off burp caused by cell phones etc) since 2013. In the UK, China, and Europe, inflation has been rising since ~2015, to lesser or greater degree. In the UK, core inflation is showing some signs of topping as the Brexit-related spike fades, and the trend is less convincing in Europe so far. In Japan (see below), inflation has been rising since 2010, but the tax-induced spike in 2014 has messed up the steadiness of the trend. And of course, it is worth pointing out that 0.3% is only high relative to the average of -0.3% since 1999!

I point out these trends because inflation is less of a concern if it happens in one country than if it happens as part of a global inflation process. Imagine that inflation is represented by the proportion of the sand on a beach that is wet rather than dry. There are two ways that sand can get wet: because of random wave action that comes and goes, or because the tide is coming in.
Where you build your sand castle depends on which of these two – tide or waves – is responsible for wetting the sand on the beach.
This isn’t an idle question or speculation. In 2005, two researchers at the ECB[1] discovered that the first principal component of inflation in the G7 countries accounted for about 60-70% of the inflation in those countries. They theorized that this factor was a “global inflation” process and that FX rates compensated for the accumulated idiosyncratic inflation in each country pair. (Enduring Investments subsequently confirmed their work and we actually use this insight to drive some of our strategy models). It makes sense that there is an inflation “tide,” since central bank behaviors as well as fiscal behaviors (and cross-border interactions such as trade liberalization) are somewhat synchronized globally. Over the last decade, everyone has been easing monetary policy and running stimulative fiscal policy. Since the early 1990s, until lately, everyone was liberalizing trade policy and reaching more free trade agreements. So it isn’t a stretch to think that to at least some degree, the global inflation cycle should be synchronized as well.
(Indeed, I would argue that if there had been less synchronization in policy, then the idiosyncratic factor of an aggressively easing Japanese central bank would probably have led to a much weaker Yen and higher inflation in Japan than we have seen. Easy monetary policy is only inflationary in the short-term if there is an FX response – the waves that impact inflation idiosyncratically – which don’t really happen when everyone is doing it.) In the long-run, of course, excessively easy monetary policy changes the tide level. And, like the tide, it isn’t that easy to reverse.
The signs suggest the tide is coming in. Place your sand castle accordingly.
[1] M. Ciccarelli & B. Mojon, “Global Inflation”, ECB Working Paper N⁰537, October 2005.
Nudge at Neptune
Okay, I get it. Your stockbroker is telling you not to worry about inflation: it’s really low, core inflation hasn’t been above 3% for two decades…and, anyway, the Fed is really trying to push it higher, he says, so if it goes up then that’s good too. Besides, some inflation isn’t necessarily bad for equities since many companies can raise end product prices faster than they have to adjust wages they pay their workers.[1] So why worry about something we haven’t seen in a while and isn’t necessarily that bad? Buy more FANG, baby!
Keep in mind that there is a very good chance that your stockbroker, if he or she is under 55 years old, has never seen an investing environment with inflation. Also keep in mind that the stories and scenes of wild excess on Wall Street don’t come from periods when equities are in a bear market. I’m just saying that there’s a reason to be at least mildly skeptical of your broker’s advice to own “100 minus your age” in stocks when you’re young, which morphs into advice to “owning more stocks since you’re likely to have a long retirement” when you get a bit older.
Many financial professionals are better-compensated, explicitly or implicitly, when stocks are going up. This means that even many of the honest ones, who have their clients’ best interests at heart, can’t help but enjoy it when the stock market rallies. Conversations with clients are easier when their accounts are going up in size every day and they feel flush. There’s a reason these folks didn’t go into selling life insurance. Selling life insurance is really hard – you have to talk every day to people and remind them that they’re going to die. I’d hate to be an insurance salesman.
And yet, I guess that’s sort of what I am.
Insurance is about managing risks. Frankly, investing should also be about managing risks – about keeping as much upside as you can, while maintaining an adequate margin of safety. Said another way, it’s about buying that insurance as cheaply as you can so that you don’t spend all of your money on insurance. That’s why diversification is such a powerful idea: owning 20 stocks, rather than 1 stock, gets you downside protection against idiosyncratic risks – essentially for free. Owning multiple asset classes is even more powerful, because the correlations between asset classes are generally lower than the correlations between stocks. Diversification works, and it’s free, so we do it.
So let’s talk about inflation protection. And to talk about inflation protection, I bring you…NASA.
How can we prevent an asteroid impact with Earth?
The key to preventing an impact is to find any potential threat as early as possible. With a couple of decades of warning, which would be possible for 100-meter-sized asteroids with a more capable detection network, several options are technically feasible for preventing an asteroid impact.
Deflecting an asteroid that is on an impact course with Earth requires changing the velocity of the object by less than an inch per second years in advance of the predicted impact.
Would it be possible to shoot down an asteroid that is about to impact Earth?
An asteroid on a trajectory to impact Earth could not be shot down in the last few minutes or even hours before impact. No known weapon system could stop the mass because of the velocity at which it travels – an average of 12 miles per second.
NASA is also in the business of risk mitigation, and actually their problem is similar to the investor’s problem: find protection, as cheaply as possible, that allows us to retain most of the upside. We can absolutely protect astronauts in space from degradation of their DNA from cosmic rays, with enough shielding. The problem is that the more shielding you add, the harder it is to go very far, very fast, in space. So NASA wants to find the cheapest way to have an effective cosmic ray shield. And, in the ‘planetary defense’ role for NASA, they understand that deflecting an asteroid from hitting the Earth is much, much easier if we do it very early. A nudge when a space rock is out at the orbit of Neptune is all it takes. But wait too long, and there is no way to prevent the devastating impact.
Yes, inflation works the same way.
The impact of inflation on a normal portfolio consisting of stocks and bonds is devastating. Rising inflation hurts bonds because interest rates rise, and it hurts stocks because multiples fall. There is no hiding behind diversification in a ’60-40’ portfolio when inflation rises. Other investments/assets/hedges need to be put into the mix. And when inflation is low, and “high” inflation is far away, it is inexpensive to protect against that portfolio impactor. I have written before about how low commodities prices are compared with equity prices, and in January I also wrote a piece about why the expected return to commodities is actually rising even as commodities go sideways.
TIPS breakevens are also reasonable. While 10-year breakevens have risen from 1.70% to 2.10% over the last 9 months or so, that’s still below current median inflation, and below where core inflation will be in a few months as the one-offs subside. And it’s still comfortably below where 10-year breaks have traded in normal times for the last 15 years (see chart, source Bloomberg).

It is true that there are not a lot of good ways for smaller investors to simply go long inflation. But you can trade out your nominal Treasuries for inflation bonds, own commodities, and if you have access to UCITS that trade in London there is INFU, which tracks 10-year breakevens. NASA doesn’t have a lot of good options, either, for protecting against an asteroid impact. But there are many more plausible options, if you start early, than if you wait until inflation’s trajectory is inside the orbit of the moon.
[1] Your stockbroker conveniently forgets that P/E multiples contract as inflation rises past about 3%. Also, your stockbroker conveniently abandons the argument about how businesses can raise prices before raising wages, meaning that consumer inflation leads wage inflation, when he points to weak wage growth and says “there’s no wage-push inflation.” Actually, your stockbroker sounds like a bit of an ass.
John Mauldin and Long Soapy Showers
I feel like I am falling behind in my articles and commenting on other articles that people have recently written about inflation. After years – literally, years – in which almost no one wrote anything about inflation, suddenly everyone wants to opine on the new shiny object they just found. At the same time, interest in the solutions that we offer – investment strategies, consulting, bespoke inflation hedges, etc – has abruptly picked up, so it feels like the demand for these articles is rising at the same time that my time to write them is shrinking…
But I try.
I want to quickly respond to an article that came out over the weekend, by widely-read author John Mauldin. I’ve corresponded over the years from time to time about inflation, especially when he got way out on the crazy-person “CPI is made up” conspiracy theory limb. To be fair, I think he considers me the crazy person, which is why he’s never referred to me as the inflation expert in his articles. C’est la vie.
His recent article “State of Inflationary Confusion”, though, was much more on-point. Honestly, this is the best article Mauldin has written on this topic in years. I don’t agree with all of it but he at least correctly identifies most of the issues correctly. He even seems to understand hedonic adjustment and the reason we need it, and the reason the PCE/CPI debate exists (which is no easy thing – it depends on what you’re trying to do, which one is ‘better’), and that hasn’t always been the case.
Where I agree with him is when he says that ‘None of us are average’. This is obviously true, and is one reason that we have on our website a calculator where you can look at your own CPI by adjusting the components for what you personally spend (though it doesn’t take into account where you live, which is one reason your experience differs).
But I disagree with him when he says “Reducing this complexity to one number and then using that number to guide monetary policy is asking for trouble.” What an odd remark. We do that for every other piece of data: GDP, home sales, home prices, durable goods sales, retail sales, unemployment, and so on, and we use that information to guide all sorts of policy. Why would it be the case that CPI, of all of the figures, isn’t very useful for this reason? Look, your personal unemployment number is not 4%. It is either 0% or 100%. Totally binary. If Mauldin was making a compelling argument here, you’d throw out the Unemployment Rate long before you’d throw out CPI.
Indeed, if you play with the numbers on our calculator you will find that unless your consumption basket is wildly different, your CPI is likely to be fairly similar to the average. This is why TIPS make sense for many investors – it’s “close enough” to what your consumption basket is actually doing. And it is certainly close enough for policy.
The problem with monetary policy isn’t that they’re using PCE or CPI when they should be using the other, or that neither PCE nor CPI reflects the exact experience of most people. The problem with monetary policy is that policymakers don’t know what the right policy response is given the numbers because they don’t believe in monetarism any more. So their models don’t work. And that’s the problem.
Here’s an analogy (and you know I love analogies). You’re taking a shower, and your impression is “hey, this seems too hot.” It doesn’t really matter if you are using Celsius or Fahrenheit, or just a general visceral sense that it’s too hot. You simply think the water is too hot. So, to solve your problem you apply more soap.
That’s what the Fed is doing. The water is too hot, so they’re applying soap. And they’re really confused when that doesn’t seem to make the water any colder. So they say “gosh, our model must be wrong. The water temperature must be somewhat less sensitive to the amount of soap applied than we thought it was. So let’s recalibrate and apply more soap.” It never occurs to them that they’ve got the wrong model.
That’s the problem with central banking. It isn’t what you use to measure the water temperature, as long as you’re close; it’s how you respond to it that matters. And policymakers don’t understand inflation and, as a result, don’t understand how to affect it.
Kicking Tails
Like many people, I find that poker strategy is a good analogy for risk-taking in investing. Poker strategy isn’t as much about what cards you are dealt as it is about how you play the cards you are dealt. As it is with markets, you can’t control the flop – but you can still correctly play the cards that are out there.[1] Now, in poker we sometimes discover that someone at the table has amassed a large pile of chips by just being lucky and not because they actually understand poker strategy. Those are good people to play against, because luck is fickle. The people who started trading stocks in the last nine years, and have amassed a pile of chips by simply buying every dip, are these people.
All of this is prologue to the observation I have made from time to time about the optimal sizing of investment ‘bets’ under conditions of uncertainty. I wrote a column about this back in 2010 (here I link to the abbreviated re-blog of that column) called “Tales of Tails,” which talks about the Kelly Criterion and the sizing of optimal bets given the current “edge” and “odds” faced by the bettor. I like the column and look back at it myself with some regularity, but here is the two-sentence summary: lower prices imply putting more chips on the table, while higher volatility implies taking chips off of the table. In most cases, the lower edge implied by higher volatility outweighs the better odds from lower prices, which means that it isn’t cowardly to scale back bets on a pullback but correct to do so.
When you hear about trading desks having to cut back bets because the risk control officers are taking into account the higher VAR, they are doing half of this. They’re not really taking into account the better odds associated with lower prices, but they do understand that higher volatility implies that bets should be smaller.
In the current circumstance, the question merely boils down to this. How much have your odds improved with the recent 10% decline in equity prices? Probably, only a little bit. In the chart below, which is a copy of the chart in the article linked to above, you are moving in the direction from brown-to-purple-to-blue, but not very far. But the probability of winning is moving left.

Note that in this picture, a Kelly bet that is less than zero implies taking the other side of the bet, or eschewing a bet if that isn’t possible. If you think the chance that the market will go up (edge) is less than 50-50 you need better payoffs on a rally than on a selloff (odds). If not, then you’ll want to be short. (In the context of recent sports bets: prior to the game, the Patriots were given a better chance of winning so to take the Eagles at a negative edge, you needed solid odds in your favor).
Now if, on the other hand, you think the market selloff has taken us to “good support levels” so that there is little downside risk – and you think you can get out if the market breaks those support levels – and much more upside risk, then you are getting good odds and a positive edge and probably want to bet aggressively. But that is to some extent ignoring the message of higher implied volatility, which says that a much wider range of outcomes is possible (and higher implied volatility moves the delta of an in-the-money option closer to 0.5).
This is why sizing bets well in the first place, and adjusting position sizes quickly with changes in market conditions, is very important. Prior to the selloff, the market’s level suggested quite poor odds such that even the low volatility permitted limited bets – probably a lot more limited than many investors had in place, after many years of seeing bad bets pay off.
[1] I suspect that Bridge might be as good an analogy, or even better, but I don’t know how to play Bridge. Someday I should learn.
The Limits to Trusting the Robots
After another day on Thursday of stocks starting to look mildly tired – but only mildly – only to rally back to a new closing high, it hardly seems unusual any more. I have to keep pinching myself, reminding myself that this is historically abnormal. Actually, very abnormal. If the S&P 500 Total Return Index ends this month with a gain, it will be the second time in history that has happened. The other time was in 1936, as stocks bounced back from a deep bear market (at the end of those 12 months, in March 1936, stocks were still 54% off the 1929 highs). A rally this month would also mean that stocks have gained for 19 out of the last 20 months, the longest streak with just one miss since…1936 again.
But we aren’t rebounding from ‘oversold.’ This seems to be a different situation.
What is going on is confounding the wise and the foolish alike. Every dip is bought; the measures of market constancy (noted above, for example) are at all-time highs and the measures of market volatility such as the VIX are at all-time lows. It is de rigeur at this point to sneer “what could go wrong?” and you may assume I have indeed so sneered. But I also am curious about whether there is some kind of feedback loop at work that could cause this to go on far longer than it “should.”
To be sure, it shouldn’t. By many measures, equities are at or near all time measures of richness. The ones that are not at all-time highs are still in the top decile. Buying equities (or for that matter, bonds) at these levels ought to be a recipe for a capitalistic disaster. And yet, value guys are getting carried out left and right.
Does the elimination (with extreme prejudice) of value traders have any implications?
There has been lots of research about market composition: models, for example, that examine how “noise” and “signal” traders come together to create markets that exhibit the sorts of characteristics that normal markets do. Studies of what proportion of “speculators” you need, compared to “hedgers,” to make markets efficient or to cause them to have bubbles form.
So my question is, what if the combination of “buy the dip” micro-time-frame value guys, combine with the “risk parity” guys, represents a stable system?
Suppose equity volatility starts to rise. Then the risk-parity guys will start to sell equities, which will push prices lower and tend to push volatility higher. But then the short-term value guys step in to ‘buy the dip.’ To be clear, these are not traditional value investors, but rather more like the “speculators” in the hedger/speculator formulation of the market. These are people who buy something that has gone down, because it has gone down and is therefore cheaper, as opposed to the people who sell something that has gone down, because the fact that it has gone down means that it is more likely to go down further. In options-land, the folks buying the dip are pursuing a short-volatility strategy while the folks selling are pursuing a long-volatility strategy.[1]
Once the market has been stabilized by the buy-the-dip folks, who might be for example hedging a long options position (say, volatility arbitrage guys who are long actual options and short the VIX), then volatility starts to decline again, bringing the risk-parity guys back into equities and, along with the indexed long-only money that is seeking beta regardless of price, pushing the market higher. Whereupon the buy-the-dip guys get out with their scalped profit but leaving prices higher, and volatility lower, than it started (this last condition is necessary because otherwise it ends up being a zero-sum game. If prices keep going higher and implied volatility lower, it need not be zero-sum, which means both sides are being rewarded, which means that we would see more and more risk-parity guys – which we do – and more and more delta-hedging-buy-the-dip guys – which we do).
Obviously this sort of thing happens. My question though is, what if these different activities tend to offset in a convergent rather than divergent way, so that the system is stable? If this is what is happening then traditional value has no meaning, and equities can ascend arbitrary heights of valuation and implied volatility can decline arbitrarily low.
Options traders see this sort of stability in micro all the time. If there is lots of open interest in options around, say, the 110 strike on the bond contract, and the Street (or, more generally, the sophisticated and leveraged delta-hedgers) is long those options, then what tends to happen is that if the bond contract happens to be near 110 when expiry nears it will often oscillate around that strike in ever-declining swings. If I am long 110 straddles and the market rallies to 110-04, suddenly because of my gamma position I find myself long the market since my calls are in the money and my puts are not. If I sell my delta at 110-04, then I have locked in a small profit that helps to offset the large time decay that is going to make my options lose all of their remaining time value in a short while.[2] So, if the active traders are all long options at this strike, what happens is that when the bond goes to 110-04, all of the active folks sell to try and scalp their time decay, pushing the bond back down. When it goes to 99-28, they all buy. Then, the next time up, the bond gets to 110-03 and the folks who missed delta-hedging the last time say “okay, this time I will get this hedge off” and sell, so the oscillation is smaller. Sometimes it gets really hard to have any chance of covering time decay at all because this process results in the market stabilizing right at 110-00 right up until expiration. And that stabilization happens because of the traders hedging long-volatility positions in a low-volatility environment.
But for the options trader, that process has an end – options expiration. In the market process I am describing where risk-parity flows are being offset by buy-the-dip traders…is there an end, or can that process continue ad infinitum or at least, “much longer than you think it can?”
Spoiler alert: it already has continued much longer than I thought it could.
There is, however, a limit. These oscillations have to reach some de minimus level or it isn’t worth it to the buy-the-dip guys to buy the dip, and it isn’t worth reallocation of risk-parity strategies. This level is much lower now than it has been in the past, thanks to the spread of automated trading systems (i.e., robots) that make the delta-hedging process (or its analog in this system) so efficient that it requires less actual volatility to be profitable. But there is a limit. And the limit is reach two ways, in fact, because the minimum oscillation needed is a function of the capital to be deployed in the hedging process. I can hedge a 1-lot with a 2 penny oscillation in a stock. But I can’t get in and out of a million shares that way. So, as the amount of capital deployed in these strategies goes up, it actually raises the potential floor for volatility, below which these strategies aren’t profitable (at least in the long run). However, there could still be an equilibrium in which the capital deployed in these strategies, the volatility, and the market drift are all balanced, and that equilibrium could well be at still-lower volatility and still-higher market prices and still-larger allocations to risk-parity etc.
It seems like a good question to ask, the day after the 30th anniversary of the first time that the robots went crazy, “how does this stable system break down?” And, as a related question, “is the system self-stabilizing when perturbed, or does it de-stabilize?”
Some systems are self-stabilizing with small perturbations and destabilizing with larger perturbations. Think of a marble rolling around in a bowl. A small push up the side of the bowl will result in the marble eventually returning to the bottom of the bowl; a large push will result in the marble leaving the bowl entirely. I think we are in that sort of system. We have seen mild events, such as the shock of Brexit or Trump’s electoral victory, result in mild volatility that eventually dampened and left stocks at a higher level. I wonder if, as more money is employed in risk parity, the same size perturbation might eventually be divergent – as volatility rises, risk parity sells, and if the amount of dip-buyers is too small relative to the risk parity sellers, then the dip-buyers don’t stabilize the rout and eventually become sellers themselves.
If that’s the secret…if it’s the ratio of risk-parity money to dip-buyer money that matters in order to keep this a stable, symbiotic relationship, then there are two ways that the system can lose stability.
The first is that risk parity strategies can attract too much money. Risk parity is a liquidity-consumer, as they tend to be sellers when volatility is rising and buyers when volatility is falling. Moreover, they tend to be sellers of all assets when correlations are rising, and buyers of all assets when correlations are falling. And while total risk-parity fund flows are hard to track, there is little doubt that money is flowing to these strategies. For example one such fund, the Columbia Adaptive Risk Allocation Fund (CRAZX), has seen fairly dramatic increases in total assets over the last year or so (see chart, source Bloomberg. Hat tip to Peter Tchir whose Forbes article in May suggested this metric).

The second way that ratio can lose stability is that the money allocated to buy-the-dip strategies declines. This is even harder to track, but I suspect it is related to two things: the frequency and size of reasonable dips to buy, and the value of buying the dip (if you buy the dip, and the market keeps going down, then you probably don’t think you did well). Here are two charts, with the data sourced from Bloomberg (Enduring Intellectual Properties calculations).

 The former chart suggests that dip-buyers may be getting bored as there are fewer dips to buy (90% of the time over the last 180 days, the S&P 500 has been within 2% of its high). The latter chart suggests that the return to buying the dip has been low recently, but in general has been reasonably stable. This is essentially a measure of realized volatility. In principle, though, forward expectations about the range should be highly correlated to current implied volatility so the low level of the VIX implies that buying the dip shouldn’t give a large return to the upside. So in this last chart, I am trying to combine these two items into one index to give an overall view of the attractiveness of dip buying. This is the VIX, minus the 10th percentile of dips to buy.

I don’t know if this number by itself means a whole lot, but it does seem generally correct: the combination of fewer dips and lower volatility means dip-buying should become less popular.
But if dip-buying becomes less popular, and risk-parity implies more selling on dips…well, that is how you can get instability.
[1] This is not inconsistent with how risk parity is described in this excellent paper by Artemis Capital Management (h/t JN) – risk parity itself is a short volatility strategy; to hedge the delta of a risk parity strategy you sell when markets are going down and buy when markets are going up, replicating a synthetic long volatility position to offset.
[2] If this is making your eyes glaze over, skip ahead. It’s hard to explain this dynamic briefly unless I assume some level of options knowledge in the reader. But I know many of my readers don’t have that requisite knowledge. For those who do, I think this may resonate however so I’m plunging forward.