Archive
Is A Bond Rally Due?
As we head into a very busy week of economic data, the bond market remains drippy with the 10-year yield up to 2.59%. (Just writing that makes me laugh. Who would have thought, only a few years ago, that 2.59% was a high-ish yield?)
How we got here, from the ultra-low levels of the last two years, is well-traveled territory. The Fed’s swing from “QE-infinity” to “someday, maybe, we might not buy as many bonds” helped trigger a run for the exits, and then negative convexity inflection points kept the rout going for a long time. Most lately, the threat of muni bond convexity has been looming as the next big concern.
But my message today is actually one of good cheer. The worst of the bond selloff was now more than three weeks ago, without a further low being established. In my experience, convexity-inspired selloffs typically end not with a sharp rebound but with a sideways trade as “trapped” long positions gradually work their way out and buyers start to nibble. But it remains a buyer’s market for several weeks, at least.
We are getting far enough along in that process that I suspect we have a rally due. This has nothing to do with any economic data coming up. There is enough data coming this week, from Consumer Confidence to Payrolls to GDP to the Fed statement, that both bulls and bears will be able to find something to point to. And I am not pointing to technicals, exactly. I am just saying that markets rarely move in a straight line, and even bear markets – such as the one I think we have now entered, in bonds – have nice rallies from time to time.
But here’s a reason to expect this to happen relatively soon. The chart below is a neat “seasonal heat map” chart from Bloomberg showing the monthly yield change for the last 10 years and the average monthly change on the top line.
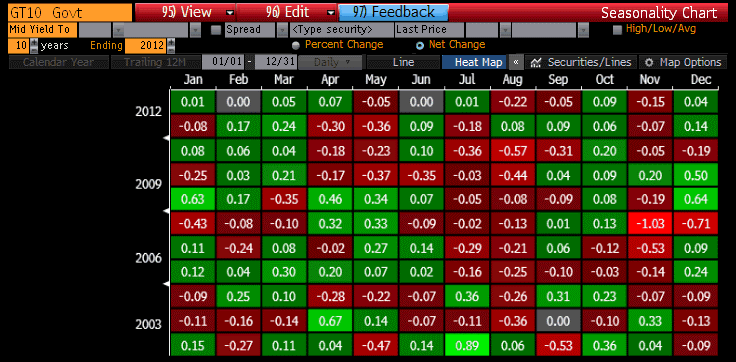 For a long time, I have been following the rule of thumb I learned as a mere babe in the bond market, and that’s that the best time of the year to buy bonds is the first few days of September. From at least the late 1970s until today, September until mid-October has been the strongest seasonal period of the year (not every year, but with enough consistency that you wanted to avoid being short in September). But the heat map above shows that this tendency may have shifted. The month that has seen the best average bond market performance over the last decade has been August, with yields falling an average of 22bps with rallies in 8 of the last 10 years. If we were sitting with 10-year yields at 1.59%, I would be less interested in this observation, but at 2.59% I am looking for the counter-trade.
To be sure, yields in the big picture are headed higher, not lower. But I am looking for signs that the recent selloff has over-discounted the immediate threat of ebbing Federal Reserve purchases. And I don’t expect growth to suddenly leap forward here, either.
As an aside, 10-year TIPS yields have also experienced one of their best months in August, with the other clear positive month being January. But, because nominal yields have been so strong, August has been the worst month for breakevens, with 10-year breakevens falling 10bps on average over the last ten years. No other month has seen breakevens decline as much as 6bps, on average.
Now, although I am a bond bear in the big picture, I don’t think that the housing market is doomed because interest rates will go up one or two or three percent. I am fascinated by how many analysts seem to think that unless 10-year rates are below 3%, the housing market will collapse. I argued about six weeks ago that higher mortgage rates should not impact sales of homes very much as long as the interest rate is less than the expected capital gain the homeowner expects to make on the home. (Higher rates will, however, cut fairly quickly into speculative building activity, which is much more rates-sensitive). And here is another reason not to worry too much about the housing market. A story in Bloomberg last week says that adjustable-rate mortgages are booming again, with mortgagees taking them out at the highest pace since 2008. Faced with higher rates, and a Fed with is not likely to raise short rates for a long while – as they have taken pains to keep reminding us – homebuyers have rationally decided to take the cheaper money and let the future refinancing take care of itself.
Whether that is sowing the seeds of a future debacle I will leave to other pundits to debate. From my perspective, the important point is that higher rates are not likely to slow home sales, or the recent rise in home prices, very much…unless they get a lot higher.
A Quick Thought on Municipal Bankruptcy
On CNBC today, analyst Meredith Whitney commented that “everybody loses” from the Detroit declaration of bankruptcy.
If that is the case, then why in the world are they seeking bankruptcy? If everybody loses, then it means nobody wins from declaring bankruptcy, and if that’s the case then it would be truly idiotic to seek it.
But of course, this is nonsense. There is no wealth being either created or destroyed in a bankruptcy proceeding; it is merely being forcibly reallocated. In this case, the winners are the taxpayers of Detroit. More to the point, it is the future taxpayers of Detroit, who were on the hook for a bunch of liabilities that they were going to have to figure out how to pay someday, but are not now going to have to pay. Those folks win big. And it’s a good thing, too, because Detroit needs more of these future taxpayers to move to Detroit.
The losers are many in number. Bondholders will lose a lot. Pensioners will, unfortunately, lose a lot. Many of the public service unions will lose a lot as their contracts are rolled back. But their losses are equal in magnitude to the gains of the future taxpayers.
Another prediction that Whitney made is on firmer ground. She said that this bankruptcy would touch off a wave of other municipal bankruptcies. I think there is a very good chance of that. I am not saying that because I have analyzed the balance sheets of many municipalities in great detail, as Whitney have (although I have seen enough, in trying to persuade some of them to hedge their post-employment medical liabilities, to be concerned). I say it because we have seen such phenomena before in industries which were overburdened. Consider telecommunications in the early 2000s. Once one big telecom company declared bankruptcy, it suddenly had a big cost advantage over its rivals, and could underprice them until its rivals followed the same path. We’ve also seen this in airlines. It seems to me that it is entirely possible that, if Detroit is able to lower taxes and reinvigorate the economy once it no longer needs to service these overwhelming liabilities, and begins to attract migrants from high-tax neighboring cities and states, then it makes the finances of places like, say, Chicago that much worse as their taxpayers leave.
Babies and Bathwater
Before I descend into the mundane discussion of economies and markets, let me first congratulate the Duke and Duchess of Cambridge on the birth of their son. In watching the pictures of the royals leaving the hospital with their child, I was struck at the fact that when his wife passes off the child, Prince William looks as uncomfortable holding a baby as most first-time fathers are. He did, however, have more luck with the mechanics of the car seat…as, again, most new fathers do.
However, when he drives home, he won’t have to worry about the rising cost of housing, and probably doesn’t fret much about whether his child will be able to afford a comfortable life in an inflationary future. “Will my son be better off than I am?” is a question for non-royals!
I have no idea what the rents are for a Kensington Palace apartment, but I will bet they are rent-controlled. Meanwhile, housing prices in the U.S. continue to rise rapidly. Today’s announcement of the FHA Home Price Index suggested prices have risen 7.3% over the last year (the fourth month in a row over 7%), while the median price of a home in the Existing Home Sales report yesterday was 13.2% above the year-ago level (see chart).

Aside from inflation, however, where the future trajectory is clear, the performance of the economy is probably best characterized by the word “muddled” (thank you, John Mauldin). Last Thursday, the Philly Fed index was published at 19.8 – a two-year high – versus expectations for 8.0; on Monday the Chicago Fed index showed -0.13 versus expectations for flat, and today the Richmond Fed index was -11 (the second-worst since 2009) versus expectations for +9.
And, in the meantime, Microsoft (MSFT) and Google (GOOG) missed earnings badly and Detroit declared bankruptcy. Apple (AAPL) is just out with earnings and pulled the old trick of “beat on current earnings, match on revenues, but guide lower for next quarter.” The current consensus for Q2 GDP (the advance estimate is due out next week) is a mere 1.3%.
With all of this, equity prices are doing well with stocks up 5.4% for the month. Bond yields are fairly flat, with 10-year yields up 4bps from the end of June, but TIPS are doing relatively well (10y real yields -14bps; 10y breakevens +18bps). And even the DJ-UBS Commodity index is +4.3%. Gold is up nearly 10%.
Three weeks do not a turn in sentiment make, but I do find it interesting that real estate, inflation breakevens, gold, and commodities generally are all enjoying a renaissance right after inflation-linked bonds and commodities were buried in late June, with large outflows especially from TIPS funds (the shares outstanding of the TIP ETF went from 183 million at year-end, to 165 million in late May, to just 139 million now). It got so bad that my company reached out to customers in late June with a thorough explanation and presentation of why we thought the market was ‘getting it wrong.” Investors were throwing out the baby with the bathwater.
To be sure, I think real yields, breakevens, and nominal yields will eventually be much higher. But if nominal yields can simply avoid breaking higher for the next few weeks, I think the stage will be set for a fixed-income rally into September and October. As I have written before, in the aftermath of a convexity event such as we have just seen, a “cool down” period of a few weeks is usually necessary to work off the bad positions induced and trapped by the market’s sudden slide. Once these positions are worked off, I think the weak economic growth and weakening corporate internals will pressure stocks lower and the stock and bond markets will get back into some semblance of what static-equilibrium types think of as “fair value” relative to one another.[1]
Even so, I think that commodities, breakevens, and even gold might have already seen the worst of their markets. In this suspicion I have been wrong before. Money velocity in Q2 will have declined further (probably to about 1.50 from 1.53 in Q1), but I think it will be higher – or at least not much lower – in Q3. And once velocity turns, time has run out. I am reminded of an old quote from Milton Friedman, from his book Money Mischief: Episodes in Monetary History
“When the helicopter starts dropping money in a steady stream – or, more generally, when the quantity of money starts unexpectedly to rise more rapidly – it takes time for people to catch on to what is happening. Initially, they let actual balances exceed long-run desired balances, partly out of inertia; partly because they may take initial price rises as a harbinger of subsequent price declines, an anticipation that raises desired balances; and partly because the initial impact of increased money balances may be on output rather than on prices, which further raises desired balances. Then, as people catch on, prices must for a time rise even more rapidly, to undo an initial increase in real balances as well as to produce a long-run decline.” (p.36)
When this happens, stocks will take a beating. But it may be the final beating in this long, drawn out, secular bear. I guess it is far too early to say that, but I recently saw two news items that I have long been waiting for. The first is that CNBC is having ratings “issues,” and it is starting to get bad enough that the producers are thinking about “tinkering with primetime.” The second, which is clearly related, is that Maria Bartriromo is thinking of leaving business news to take her inestimable talents elsewhere.
As with commodities and inflation breakevens recently, a sine qua non for the start of a new bull market of substantial magnitude – not a 100% rally from the lows, but a 100% rally above the old highs – is that everyone stops thinking that stocks are smart and exciting investments, that they are “where it’s at,” and that all the cool people are buying stocks. And I have never been able to figure out how an environment sufficiently depressing to germinate a new bull market can occur if the cheerleaders are televised 24/7. Honestly, I had just about given up. While we still need cheap valuations and rotten sentiment to start a bull market (and we are very far from both of those standards in equities), a move towards general indifference among investors would be a good start.
[1] As the quote marks suggest, I don’t think that they will be right when you hear people declare that “stocks now offer good value relative to bonds again.” I think the people who use the “Fed model” tend to overprice stocks generally…and they tend to be much more diligent disciples of the model when yields are falling than when they are rising. When yields rise, they tend to say that stocks are better values than bonds because bond yields are going to rise, while when yields are low they tend to say that stocks are better values than bonds because of the current level of bond yields.
The Baby is Calm … For Now
So, the bond market has had another few days of riding the yo-yo. A 20-bp bond selloff on Friday (followed by a 10bp rally today) was precipitated by a stronger-than-expected Employment Report, with the actual number of jobs created exceeding estimates by 100k (including revisions to the prior two months). Interestingly, the Unemployment Rate rose, but on the whole the data was clearly better than most observers expected even if the net result is that the economy is still limping along at almost precisely the same pace it has done so for the last few years (see chart, source: Bloomberg).
 And so the equity market reaction makes some sense. The jobs report was strong enough so as to alleviate (or at least salve, temporarily) fears that the economy is about to slip back into recession, while not being so strong that it could lead to a premature taper which leaves everyone gasping but unsatisfied.
The bond market, though, was routed. The bad convexity profile, combined with the poor liquidity of a trading session stranded between a holiday and a weekend, throttled fixed-income and drove rates to the highs of the move. Ten-year Treasury yields (2.74% on Friday) reached the highest levels in almost two years.
I was wrong about stocks, but right about bonds, when I said I expected the prior trends to re-assert themselves after quarter-end. Given an Employment number that missed expectations one way or the other, it was going to be hard to be right on both in the short-term.
But in the slightly longer-term, the imbalances between equities and fixed-income are building in a way they haven’t been for a long time. As the chart below shows, the rally in equities has been fueled importantly by a long decline in long-term real interest rates, from 3% to -1%, since 2008.
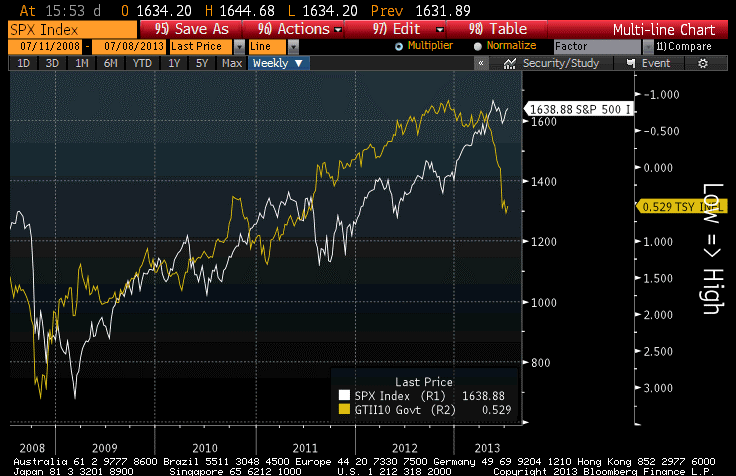 A further equity rally is not out of the question, of course. The real equity premium (the excess expected real return of stocks relative to TIPS) in mid-2011 was as low as it is now, and that “unattractive condition” preceded a 40% rally in the stock market over two years. The difference is that in 2011, real interest rates were low, but (we know in retrospect) were destined to go much lower. It seems unlikely – although not impossible! – that real rates are about to rally again from +0.53% to -1.00%, thereby precipitating an additional rally.
Indeed, although it may be a trick of the eye the chart above seems to suggest that equity price turns lag the turns in real yields. The regression of real yield levels versus equity levels happens to have its best fit with a lag of 19 weeks. Not to worry, however: if that’s not merely spurious, then it means you still have about a month before the big equity slide is due to begin!
Interestingly, the international backdrop is heating up again, although in prior incarnations the Arab Spring (now replaced by the Egyptian Summer) and Grexit crisis (now replaced with the Portuguese government stability crisis and …the Grexit crisis) didn’t cause any lasting damage to equities. However, it bears repeating that those crises occurred in the context of steady and significant declines in interest rates.
Calm, anyway, is inherently destabilizing. The Troika wouldn’t be pressing Greece for more concessions, or holding Portugal’s feet to the fire, if markets were going crazy. However, because markets (and especially, equity markets) are comparatively calm, it seems like a fair time for policymakers to send trial balloons aloft. Similarly, the FOMC seems oddly relaxed about the carnage in bond markets, with officials content to waggle fingers in disapprobation at market action rather than to reverse course and speak soothingly about how additional quantitative easing could be provided. I expect a one-thousand point Dow fall would change that perspective rather quickly. As parents know, it is easy to hold the line on good parenting until Junior throws a fit, and then it is so tempting to give him a lollipop to quiet him down. But, while he’s behaving, why not ask him to try broccoli today?
Wahhhhhhh![1] And then we’ll see whether central bank discipline is real, or merely threatened.
[1] This is not autobiographical. My son loves broccoli.
The Healing Power of Quarter-End
Ah, it is so nice to be in this illiquid period right before quarter-end, when interested parties can easily ramp up prices to where they need them to be in order to get good end-of-period marks. One would think this game would diminish somewhat, given the crusades against the LIBOR and possibly FX price-setting conspiracies, but there’s no conspiracy here. There’s no need for investors and dealers to discuss putting the stock market up; everyone knows it happens and everyone knows why. The hedgies who flush microcaps higher because they can ought to be stopped, but there’s no way to stop the general tendency, especially when you have very clear indications of when that trade is supposed to begin…such as when Fed officials show up and start chanting “stocks shouldn’t go down!” in unison.
For the last couple of days, Fed officials have been out in force saying that the “market overreacted.” (Mostly, they mean the bond market, but for many people “the market” equals “stocks” because they think CNBC is about “markets” rather than “stocks”.) Today, New York Fed President Dudley, Fed Governor Powell, and Atlanta Fed President Lockhart pursued the overreaction theory in separate speeches, echoing Minneapolis Fed President Kocherlakota’s sentiment from yesterday. Yes, yes, we all know that everyone else will treat that as a signal to get long again (both stocks and bonds) into quarter-end, but what it really shows is that utter cluelessness of the people in charge at the Fed. Powell said that “Market adjustments since May have been larger than would be justified by any reasonable reassessment of the path of policy.” Well, duh. As I pointed out a while ago – before the real selloff – such a virulent selloff was entirely to be expected at some point due to convexity demands. The most-virulent part of the selloff may have coincided with Bernanke’s statements last week, and that might have triggered some of the convexity selling, but the degree of selloff had nothing to do with the Fed.
Someone should tell these guys that not everything is controlled by the Fed. Sometimes, rates move for other reasons.
To be sure, the Fed is correct about the fact that their communication is helping to cause the volatility. But it isn’t because they haven’t been clear enough, or that what they said was misinterpreted. The problem is too much communication, and making the path of policy (and any inflections in that policy path) crystal clear. When policymakers are opaque about monetary policy, then investors change their opinions stochastically, at random intervals; when policymakers set off a flare for every minor change in the trajectory, all investors change positions simultaneously. Transparency not only doesn’t reduce volatility, it is a prescription for creating volatility.
Clarity on the fiscal and regulatory front, incidentally, is quite different. Volatility in business ventures is high enough already to ensure that entrepreneurs don’t have an incentive to get too far out over their skis no matter how clear the regulatory environment, and decisions made in a business context don’t have the hair-trigger half-life of decisions in financial markets. Uncertainty, when long-term decisions have to be made, impairs that decision-making. But uncertainty is good when decisions are easily reversible and the cause of volatility is that consecutive orders to sell aren’t spread out enough. For stable markets, you want buys and sells to come all jumbled up, rather than all the buys together or all the sells together. For maximum economic growth, you want risk-takers to have the ability to make long-term decisions with confidence.
So while equity markets have rallied as we approach quarter-end, I don’t think this rally will far outlast quarter-end, because there are just too many negatives at the moment for equities – high multiples, rising interest rates, softening global growth, a less-benign regulatory environment etc. The selloff in stocks was never very bad (compared to bonds), because there’s not the same kind of convexity problem in stocks, but it also has a lot further to go than bonds do.
Fixed-income markets have rallied along with stocks, with TIPS leading the way up as they led the way down. The interpretation here is different, because in the case of the bond market we are looking at the well-known phenomenon of convexity selling. My advice for fixed-income investors, from long and painful experience, is this: don’t jump in with both feet yet. These bounces are normal in this kind of flush. It does probably mean we are closer to the end of the flush than to the beginning, but usually you need a period of a couple of weeks of sideways action before you can start to retrace the “convexity selling” damage and get back to something like fair value.
The healing period is necessary because every prospective bond buyer knows (or should know) that there are large trapped sellers out there who are waiting to pitch bonds overboard (at the new, improved levels!) if there is any sign of further market weakness. The rally over the last few days is fast money, doing what they think the news is telling them to do, and they will be back out as quickly as they got in.
We’ll see what happens next week. On the one hand, dealers will have more ability to hold positions (although they’re not supposed to, under the Volcker Rule); on the other hand, quarter end will be past and any inclination to hold off to avoid making a bad situation worse will be past as well. It will still be fairly illiquid, with a half-day on Wednesday, the Independence Day holiday on Thursday, and then Payrolls on Friday. I suspect we will see a resumption of prior trends in fixed-income and equities – although I hasten to add as a reminder that there will eventually be a rally off these rates. I just don’t think we’ve exhausted all of the sellers yet.
Bond Beatings Continue
The beatings are continuing, and apparently morale really does improve with such treatment. Consumer Confidence for June vaulted to the highest level since early 2008, at 81.4 handily beating the 75.1 consensus. Both “present situation” and “expectations” advanced markedly, although the “Jobs Hard to Get” subindex barely budged. It is unclear what caused the sharp increase, since gasoline prices (one of the key drivers, along with employment) also didn’t move much and equity prices had been steadily gaining for some time. It may be that the rise in home prices is finally lifting the spirits of consumers, or it may be that credit is finally trickling down to the average consumer.
Whatever the cause, it is not likely to prevent the rise in money velocity that is likely under way, driven by the rise in interest rates. Between the rise in home prices – the Case-Shiller home price index rose a bubble-like 12.05% over the year ended April, and Existing Home Sales median prices have advanced a remarkable 14.1% faster than core inflation (a near record, as the chart below shows) over the year ended in May. (Lagged 18 months, such a performance suggests about a 3.9% rise in Owners’ Equivalent Rent for 2014).
 But of course, we must fear deflation more than ever!
The nonsense about deflation is incredible to me. Euro M2 growth hasn’t been this high (4.73% for year ended April) since August of 2009. Japanese M2 growth hasn’t been this rapid (3.4% for year ended May) since May 2002. US money supply is “only” growing at 6.5% or so, down from its highs but still far too fast for a sluggishly-growing economy to avoid inflation unless velocity continues to decline. But you don’t have to be a monetarist to be concerned about these things. You only need to be able to see home prices.
Core inflation in the US is being held down by core goods, as I have recently noted. In particular, CPI for Medical Care just recorded its lowest year-on-year rise since 1972, and Prescription Drugs (1.32% of CPI and an important part of core goods) declined on a y/y basis for the first time since 1973. The chart below (source: Bloomberg) illustrates that as recently as last August, that category was rising at a 4.0% pace.
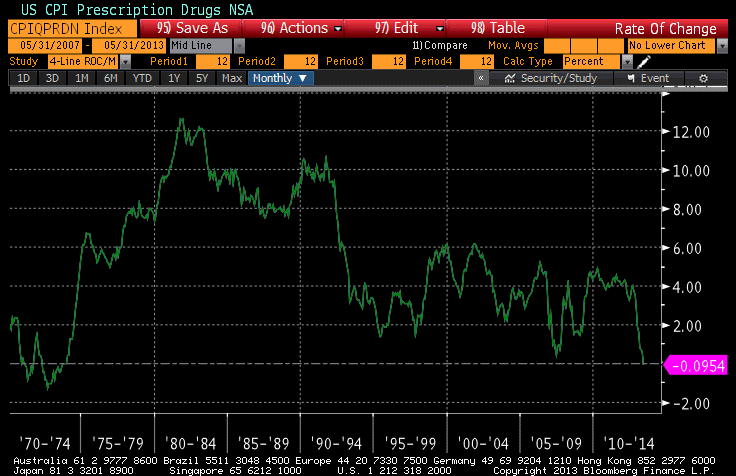
Now, I suspect that this has something to do with Obamacare, but no one seems to know the full impact of the law. Keep in mind that Medical Care in CPI excludes government spending on medical care. So, one possible narrative is that the really sick people are leaving for Obamacare while the healthy people are continuing to consume non-governmental health care services. This would be a composition effect and would imply that we should start looking at CPI ex-medical for a cleaner view of general price trends. I have no idea if this is what is happening, but I am skeptical that prescription meds are about to decline in price for an extended period of time!
But that’s the bet: either core inflation is going to go up, driven by things like housing, or it’s going to go down, driven by things like prescription medication. Place your bets.
Equity prices recovered today, but bond prices continued to slide into the long, dark night. For a really incredible picture, look at the chart below (source: Bloomberg), which shows the multi-decade decline in 10-year yields on a log scale, culminating in the celebrated breakout below that channel. Incredibly, the recent selloff has yields back to the midpoint of the channel and not outrageously far from a breakout on the other side!
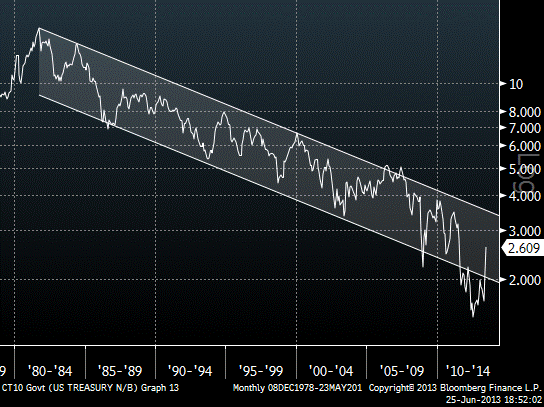
Incidentally, students of bond market history may be interested to know that the selloff has now reached the status of the worst ever bond market selloff (of 90 days or less) in percentage terms. Since May 2nd, 10-year yields have risen from 1.626% to 2.609%, a 98.3bp selloff which means that yields have risen 60.5% in less than two months.
And we are probably not done yet. I wrote about a month ago about the “convexity trade,” and I made the seemingly absurd remark that “This means the bond market is very vulnerable to a convexity trade to higher yields, especially once the ball gets rolling. The recent move to new high yields for the last 12 months could trigger such a phenomenon. If it does, then we will see 10-year note rates above 3% in fairly short order.”[emphasis in original] Incredibly, here we are with 10-year yields at 2.61%, up 60bps over the last month, and that statement doesn’t seem quite so crazy. As I said: I have seen it before! And indeed, the convexity trade is partly to blame for what we are seeing. I asked one old colleague today about convexity selling, and here was his response:
“massive – the REITs are forced deleveraging and there are other forced hands as well. The real money guys are too large and haven’t even sold yet – no liquidity for them. The muni market has basically crashed and at 5% yields in muni there is huge extension risk on a large amount of bonds: something like $750bln in bonds go from 10-year to 30-year maturities as you cross 5%.” (name withheld)
Now, I am not a muni expert so I have no idea what index it is I am waiting to see cross 5%. But the convexity trade is indeed happening.
Lots of bad things have happened to the market, but they really aren’t big bad things. In fact, I move that we stop using the term “perfect storm” to mean “modestly bad luck, but I had a lot of leverage.” The Fed was never going to be aggressively easy forever, and as various speakers have pointed out recently they didn’t exactly promise to be aggressively tightening any time soon. There is bad news on the inflation front, but the market is clearly not reacting to that. Some ETFs have had some liquidity issues, and emerging markets have tumbled, and there was a liquidity squeeze in China. But these are hardly end-of-the-world developments. What makes this a really bad month is the excess leverage, combined with the diminished risk appetite among primary dealers who have been warned against taking too much “proprietary risk.”
And markets are mispriced. Three-year inflation swaps imply that core inflation will be only 1.9% compounded for the next three years (the 1-year swap implied 1.6%; the 2y implies 1.75%). That is more than a little bit silly. While I have not been amazed that the convexity trade drove yields very high, and probably will drive them higher, it has surprised me that inflation swaps and inflation breakevens have continued to decline. Still, investors who paid heed to our admonition to be long breakevens rather than TIPS have done quite a bit better, as the chart below (source Bloomberg), normalized to February 25th (the date of one of our quarterly outlook pieces) illustrates.
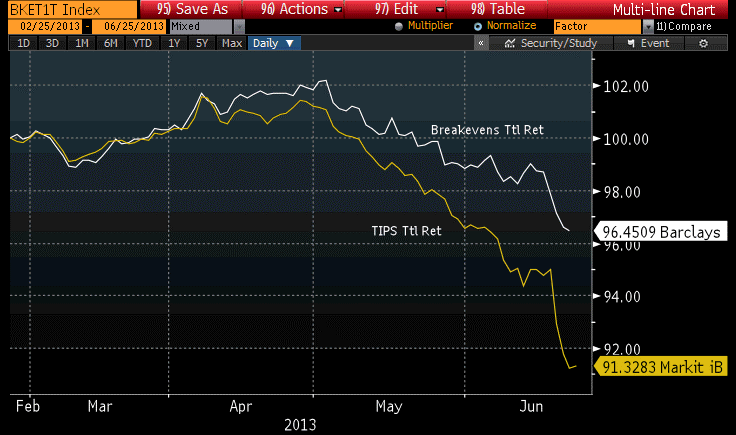
As the bond selloff extends, I don’t think TIPS will continue to underperform nominal bonds. I believe breakevens, already at low levels (the 10-year breakeven, at 1.97%, is lower than any actual 10-year inflation experience since 1958-1968), will be hard to push much lower, especially in a rising-yield environment.
Classic
Numerous classic cognitive errors are on display at once in these markets. We have “overconfidence,” with large bets being made on the basis of strongly-believed models and forecasts…but these are forecasts of the dynamics of a system whose configuration is distinctly unlike anything we have seen before, even remotely. What does a “taper” do to rates? How can we know, since we have never even had QE, much less a taper, before? How aggressively does it make sense to bet on the outcome of such a transition period, given rational-sized error bars on the estimates?
We also see naïve extrapolation of trends. TIPS go down every day, it seems, for no better reason than that “core inflation is low, and the Fed is no longer going to be maintaining as loose a policy.” Ten-year TIPS yields have risen 83bps since April 25th (5y TIPS, +107bps since April 4th). Ten-year breakevens have fallen from 2.59%, within 15bps of an all-time high, on March 14th to 2.03% – the lowest since January 2012 – now. What has changed? Our model identified TIPS as cheap to Treasuries (that is, breakevens too low for the level of nominal rates) and went nearly max-long when breakevens were still at 2.30%. It is some solace that this position has fared better than a long position in TIPS, but when markets simply follow recent momentum mindlessly it can be painful.
Year-ahead core inflation is priced in the market at roughly 1.50%, despite the fact that current core inflation of 1.7% is only at this level because of persistently soggy core goods prices (and core goods are much more volatile than core services prices). Meanwhile, although core services prices remain buoyant, housing rents have not even begun to respond to the sudden boom in housing prices. To realize the core inflation priced into the 1-year inflation swap, core goods prices need to remain low and rends would need to decelerate while a shortage of owner-occupied housing drives the prices of existing homes skyward. It is possible, but it would be a very unusual economic occurrence. As I have previously written, we are maintaining our forecast for core inflation in 2012 at 2.6%-3.0%; although we may tweak that lowers if next week’s CPI is disappointing, we will not be changing it dramatically. Based on both top-down and bottom-up forecasts, we think the inflation market right now is very wrong. However, in accordance with paragraph 1, above, our 80% confidence interval for that estimate would be quite wide. Still, we feel that most errors looking out at least one year are going to be in the direction of higher inflation, not lower inflation.
Now, our forecast relies significantly on the behavior of the housing market, since shelter is the largest share of the budget for most of us. There has been a lot written recently about how the rise in rates could shatter the housing recovery. But let me explain why I don’t think that will happen.
I remember reading many years ago in “The Money Game” by Adam Smith (a pseudonym) that “you make more money with good investing decisions than with good financing decisions.” At least, I think that’s where I read it. In any event, it is true: if you are creating the next Microsoft, it makes very little difference if you finance it at 2% or at 15%, because the investment performance will completely obliterate the cost of financing. And this is why higher rates, even significantly higher rates, will not derail the housing market while prices are rising at 10%+ per annum. A home buyer is clearly happier to borrow at 3% than at 5% (tax-deductible), but if the home price is appreciating at 10% per annum (tax free, for much of it, and tax-deferred in any event) then it is a home run for the buyer either way. What hurts the housing market is when the expectation of future home price changes goes from go-go to stop-stop. And, with most consumers concerned with inflation and recent price trends in the home market, this isn’t going to change soon.
Here is an illustration of the real-world response of housing to rates. This first chart is the Mortgage Banking Association’s Refinancing index, plotted against 10-year Treasury rates (inverted). You can see that the recent rise in rates is having a significant impact on refinancing activity.

And this next chart is a chart of the MBA Purchase Index, showing activity on mortgages related to new purchases of homes. Again, the 10-year Treasury rate is inverted. You can see that there is no meaningful correlation here; if anything, purchase activity has been rising over the past year while rates have also been rising.

So, rest easy: higher interest rates are not going to meaningfully impact the housing market, unless they go much higher. Indeed, homebuyers might reasonably believe here that there is a “Bernanke put” on home prices in the same way that investors (correctly) believed there was a “Greenspan put” on stock prices. The Fed (and for that matter the state and federal governments) clearly have responded and can reasonably be expected to respond robustly to a future home price bust. So why not be long real estate here, if your downside is protected…and in any case, is limited to your home equity?
And if home prices do not decline, then rents are not going to decline, and in fact need to accelerate to keep up with the previously-seen rise in home prices. That is going to cause core inflation to rise going forward.
.
One final note: over the next month or two I hope to put out a few more articles like the one I wrote on June 8th about equity returns and inflation, but focusing on other asset classes such as real estate, infrastructure, commodity indices, etcetera. But in the meantime, I wanted to point out one security to keep an eye on. It is one of only two inflation-linked bonds that is traded on an exchange with a daily price and reasonable bid/offer spreads. The symbol is OSM (for Bloomberg users: you need the <CORP> key), and it is a floating-rate inflation-linked bond issued by SLM Corp with a March 2017 maturity. The problem with this security is that it is very hard to figure out what its true yield is unless you have an inflation derivatives curve, and even harder to figure out whether the issue is priced correctly given that you own SLM credit. The recent selloff has driven the real yield of this issue to (approximately) 3.40%, which is obviously much higher than is available for TIPS. The bad news is that the bond is still fairly expensive given the spread that should exist for a SLM bond, but in terms of raw real yield to maturity there are not many inflation-linked bonds out there with that yield. I am not recommending this security, but mention it as a point of information for investors who may want to check it out on their own.
Rough Week, but it Could Have Been Worse
It was an interesting week. Considerable volatility in the foreign exchange markets (the dollar fell 5.5 handles from 105.50 yen to 95 yen before bouncing to 97.5 yen at week’s end) and a slide in several foreign equity markets (chiefly the Nikkei, -6.5%, but also the UK -2.6%, Italy -3.0%, Mexico, Brazil, Turkey -9%, etc) impacted the U.S. bourse at the margin but not severely. On Monday, a weak ISM helped push US stocks lower and bonds higher; but on Friday an as-expected Employment report led to a massive equity rally and sharp losses on bonds with the 10-year yield reaching a new high for the move.
The reaction from bonds isn’t terribly surprising. Bond funds are seeing near-record outflows as everyone knows that yields would not be near these levels without Fed backing, and no one wants to be the last one out. Any fear that “taper” is going to happen soon was going to send yields higher, and as I wrote on May 29th there is some risk for much higher yields.
The equity reaction on Friday is a little more confusing. Sure, the airwaves were full of news of the “better than expected” payrolls, although the combination of the May positive surprise (+12k) and the revisions to the prior two months (-12k) puts the Jobs number precisely on the consensus estimates while the Unemployment Rate rise slightly due to a rise in the participation rate. To be sure, there is nothing in the number to force the Fed to consider a “taper” with any kind of urgency, but considering that Bernanke and Dudley have already signaled that no taper is imminent, this is hardly news: the data on Friday was almost exactly as-expected.
Going forward, the market continues to face the same hurdles: higher rates mean more competition for investment dollars and will pressure equity prices. Lower unemployment implies that the current ratio of real wage growth relative to gross margins – which reflects the great power of capital right now relative to labor, with margins at record highs while real wages stagnate – will begin to shift back in favor of wages and away from capital. Higher rates also imply higher money velocity and hence, higher inflation. (See chart, source Bloomberg.)

If 5-year rates went to, say, 2%, and M2 velocity rose to 1.732 as the regression suggests, it would represent a 12.9% rise in money velocity. If M2 merely ticks along at the current (high, but not as high as it was) rate of 6.6% growth year-on-year, and GDP grows at an optimistic 4% rate, then it implies inflation of roughly 15.7% (1.129 * 1.066 / 1.04).
There are a lot of “ifs” in that statement, and I want to make clear that I am not forecasting 15.7% inflation over the next year, or even the next two years combined. But the point is that the risks are not insignificant. It isn’t a rise of core CPI to 2.5% by year-end that is the potential problem, although stocks might not take that well. It is a rise above that, which causes rates to rise, which causes velocity to accelerate further, etcetera in a spiral that the Fed is powerless to do anything about since it must first remove $1.9 trillion in excess reserves from the banking system…
And in that sort of inflationary environment, equities would be roundly trashed. A reader asked me to expound further on my prior observations about equities and inflation, and this seems like the right place to do it. However, so as to limit the length of this article, I am posting that further discussion/article separately here.
Bonds and the “Convexity Trade”
It has been a long time since we have had to worry about and think about the phenomenon of mortgage convexity and the effect that it can have on the bond market. But with 10-year interest rates up 50bps in less than 1 month, and some of the selloff recently being attributed to “convexity-related selling,” it is worth reminiscing.
We need to start with the concept of “negative convexity.” This is a fancy way of saying that a market position gets shorter (or less long) when the market is going up, and longer (or less short) when the market is going down. That’s obviously a bad thing: you would prefer to be longer when the market is going up and less long when the market is going down (and, not surprisingly, we call that positive convexity).
Now, a portfolio of current-coupon residential mortgages in the US exhibits the property of negative convexity because the homeowner has the right to pre-pay the mortgage at any time, and for any reason – for example, because the home is being sold, or because the homeowner wants to refinance at a lower rate. Indeed, holders of mortgage-backed securities expect that in any collection of mortgages, a certain number of them will pre-pay for non-economic reasons (such as the house being sold) and the rest will be pre-paid when economic circumstances permit. Suppose that in a pool of mortgages, the average mortgage is expected to be paid off in (just to make up a number, not intended to be an accurate or current figure) ten years. This means that the security backed by those mortgages (MBS for short) would have a duration of about ten years, so that a 1% decline in interest rates would, in the absence of convexity, cause prices to rise about 10%.[1]
Now, that’s really just a guess based on where interest rates are currently. As interest rates change, so does the duration of the bond. If mortgage interest rates fall significantly, then most of the mortgages in that MBS would pre-pay and the duration of the security would fall sharply. Suppose that after a sufficient decline in interest rates, the same pool of mortgages in that MBS is expected to be pre-paid on average in only 3 years. Now a further 1% decline in interest rates will only cause the price of the MBS to rise about 3%. This is negative convexity, and what is significant here is how holders of MBS respond. In order to maintain a similar market exposure, the owner of the MBS needs to buy more bonds, swaps, or MBS to maintain his duration. That is, into a rally, the MBS owner needs to buy more. This is “buying high,” and it’s the manifestation of one side of that negative convexity.
Suppose that instead interest rates rise sharply. Now, instead of expecting those mortgages to economically pre-pay over the next 10 years, we realize that the opportunities for these homeowners to refinance just went away (at least for a while); consequently, we now expect the mortgages to pay off in 15 years on average, rather than 10. A further rise of 1% in interest rates will cause prices to fall 15% rather than 10%. Again, the MBS holders need to respond, and they do so by selling bonds, swaps, or MBS to maintain duration. That is, into a selloff, the MBS owner needs to sell more. This is “selling low,” and it’s the manifestation of the other side of that negative convexity.
Put together, a manager of a large MBS portfolio is earning a higher-than-average coupon, but is also systematically buying high and selling low on his hedges and losing a little money each time. More importantly for our case here is that if the market moves enough to trigger the hedging activity then we say that “the convexity trade” has caused a significant amount of selling into a selloff, or a significant amount of buying into a rally, and this essentially means fuel is being added to the fire and the move is worsened. The mortgage market is massive, and especially with dealers having less capacity for market-making risk-taking a big convexity trade could cause a huge move. In the 2000s, I recall two massive selloffs of at least 125bps over a period of just a few weeks, in which every 5bps seemed to bring out another huge seller and push the market another 5bps.
Figuring out exactly what the trigger level is at which the convexity trade kicks in is the domain of mortgage analysts, and there is a lot of brainpower and computing power put to this analysis. These folks can tell you that “a 10-year note rate of 2.25% will cause the market to get longer by 150bln 10-year note equivalents [just to be clear, this is a made up example],” which in turn implies that there will be substantially more selling when interest rates approach that level.
Now, I don’t know what the current trigger levels are, but I can tell you a few more things from years of experience.
First is that the market’s negative convexity is greatest when the market has rallied to a new level and stayed there for a long time, allowing most borrowers to refinance their mortgages to the current coupon. The chart of 10-year yields below (Source: Bloomberg) illustrates this point. In 2008, 10-year note yields fell below 2.5%, but did so very quickly and few people had a chance to refinance (plus, mortgage spreads were quite wide and credit was hard to get), so the mortgage market maintained something like its prior equilibrium.

However, over 2010 and especially after mid-2011, rates got substantially lower and stayed lower; mortgage credit also got somewhat easier than in early 2009 (although obviously underwater homeowners cannot refinance, and this limited the amount of refinancing activity so that MBS prepay speeds weren’t as rapid as the pre-2008 models had expected). We have now been at these levels for some time, so that I suspect the market’s average coupon is substantially lower today than it was two years ago. This means the bond market is very vulnerable to a convexity trade to higher yields, especially once the ball gets rolling. The recent move to new high yields for the last 12 months could trigger such a phenomenon. If it does, then we will see 10-year note rates above 3% in fairly short order.
The second point is somewhat more subtle. The nature of the negative convexity in the higher rate direction is different from the nature of the negative convexity in the lower rate direction. When rates fall, we are looking at borrowers refinancing, which means that we can stair-step lower: rates fall, borrowers refinance, rates fall further, borrowers refinance again, etcetera. But when rates rise, the duration increase is caused by a lack of activity. Borrowers eschew refinancing. And this, fundamentally, can only happen once no matter how far rates move. If it is not economical to refinance with rates 2% higher, then few borrowers will refinance. But at 5% higher rates, there is no additional effect: once your model expects essentially zero refinancing, the convexity trade is over until you get substantial new origination of mortgages, and this takes longer. Therefore, in a selloff the convexity trade is somewhat self-limiting. It sure doesn’t feel like it at the time, but it is.
This is a long article but it is worth reflecting on because of the conclusion, and that is this: if rates rise because the Fed begins to raise rates (or finds it doesn’t have enough will to keep them low, once the bond market expects much higher inflation), then there is no “cap” on how high they can go. But if rates rise in a sloppy fashion because of a convexity trade, there really is a cap. It would be ugly to see interest rates rise another 100bps (and really, really bad for stocks I think), but if they did so because of the convexity trade then we would probably get a bunch of that move reversed thereafter.
I don’t have a strong opinion about whether we are at that point yet, and I no longer have access to great mortgage analysts. But Fed speakers should tread very lightly, as I doubt the first trigger point is terribly far away and you surely don’t want to hit it.
There is one reason I don’t think that the bond market selloff we have seen to date is heavily driven by convexity-related flows, and that is that TIPS yields have risen faster than nominal bond yields. Over the period during which nominal 10-year yields have risen 50bps, 10-year TIPS yields have actually risen 58bps. If the trade was a convexity-driven trade, it would be primarily affecting nominal yields, which means that while TIPS would be suffering, they would be suffering less than nominal bonds, rather than more. (The flip side is that if you are bearish here because you think the convexity trade might kick in, you should also expect breakevens to widen substantially when that trade does kick in). Indeed, TIPS at -0.13% is the best bargain we have seen in quite some time (see chart, source Bloomberg).

Indeed, our multi-asset strategy has kicked the TIPS component all the way up to 11%, which is the highest it has been in a long while. TIPS are not cheap, but they are cheaper, and they are extremely cheap relative to nominal bonds. And they are not yet as cheap as i-Series savings bonds, although the yield advantage of those bonds has dropped from the 159bps it was when I wrote about it here to “only” 93bps. But that’s still a great arb, and so I continue to advocate i-bonds.
[1] I am abstracting from the niceties of Macaulay versus modified versus option-adjusted duration here for the purposes of exposition.
Comparisons
With little economic data on the calendar, and the Fed speakers back-loaded at the Chicago Fed conference later in the week, there is time to reflect on other questions (unless, of course, the Israel/Syria back-and-forth turns into something more than the last couple of jabs have produced).
It is interesting to me that analysts and journalists truly enjoy finding comparisons between present situations and actors, except when the comparisons suggest unpleasant conclusions. This is at a time when there are really no comparable periods in history to compare to, at least with respect to major global policy initiatives!
I read comparisons between Shinzo Abe’s pressure on the Bank of Japan and Fed Chairman Bernanke’s campaign to resurrect the American economy with ever-greater monetary policy shocks. Somewhere, I saw an analyst ask “isn’t Abe taking note of the failure of U.S. monetary policy to goose the economy?” But the comparison is not apt because the two men, and the two economies, face very different challenges. Abe doesn’t need to increase consumer spending and reinvigorate the economy with monetary policy. While that might be nice, the main goal of Japanese monetary policy now is to raise the price level and the rate of inflation. They are using exactly the right tool to do so: lots of monetary easing. On the other hand, Bernanke is trying to kick-start the real economy with a monetary tool, while at least in principle avoiding an inflationary outcome. That’s like trying to hammer a nail with a fish. It might work, but it’s the wrong tool for the job. So the comparison doesn’t work: one man knows how to use his tools, the other does not.
Here is another useless comparison: “Bond Buyers See No 1994 as Bernanke Clarity Tops Greenspan.” The myth that transparency really helps markets in the long run is sort of silly: is there any sign that the crises caused by monetary policy have become less frequent since the Greenspan glasnost than they were before? I know that’s the belief, because the Fed has told us that’s the way it is. But my scorecard tells a sorry tale of bubbles and crashes since the early 1990s. It isn’t a lack of transparency that causes routs. It’s leverage, and negative gamma. Mortgage hedgers are more active now than they were in 1994, and they have larger books. Hedge funds are orders of magnitude larger. And Wall Street is smaller, and is able to provide less liquidity – partly because they are more levered (which they think is okay because of “Fed transparency”), and partly because the government doesn’t want them to take bets with the leverage they have (which, since they’re paying for failures under the current system, isn’t wholly absurd).
So will the next bond selloff not be as bad as in 1994, because the Fed will give more warning? Remember that no matter how transparent the Fed is, there is still a transition point. Somehow, the market goes from a state of thinking there will be no tightening of policy, to a state of thinking that there will be a tightening of policy. That requires a re-pricing, whether it occurs because the Fed signaled it in a speech or a statement, or because they signaled it by doing Matched Sales for the SOMA account with Fed funds already trading above target (as was the old way of telling us something had changed). There is no way to go from “not knowing” to “knowing” without a moment of realization. And when that phase change ultimately occurs, the greater leverage inherent in the market and the diminished role of market makers will cause the selloff (in my view) to very likely be more dramatic than in 1994.
One place where we cannot prevent comparisons – nor should we want to – is in the asset markets. Stocks are doing well, despite absurd valuations, because most other markets are either more-absurdly valued (e.g., Treasury bonds) or have horrible momentum that means they’re not popular right now (e.g., commodities). I have no doubt that equity performance over the next 10 years will be very uninspiring, because equity markets that start from this level of valuation never produce inspiring returns. But when people ask me what the trigger will be for a selloff, I have to shrug. There have been plenty of “reasons” for that to happen. But I think the ultimate reason is probably this: equities are perceived as the “only game in town.” I have read several articles recently that echo this one: “Bond Fund Managers are Loading Up on Stocks.” When there is some other asset class, or some other world market, that starts doing appreciably better, perhaps investors will decide to allocate away. Unfortunately, the candidates for that market are pretty few, given the general level of valuations. Could it be commodities, which is one of the few genuinely cheap markets? Or perhaps real estate, which is still only fair value but has some pretty striking momentum? I don’t know – but I am also not sitting around waiting for a “trigger event.” There may well be a selloff without such a trigger.
